The basics of observing Kubernetes: A bird-watcher’s perspective


 Share on Twitter
Share on Twitter

 Share on LinkedIn
Share on LinkedIn

 Share on Facebook
Share on Facebook

 Share by Email
Share by Email

 Print this page
Print
An avid bird-watcher once told me that for bird-watching beginners, it’s more important to focus on learning about the birds and identifying their unique songs rather than trying to find the perfect pair of binoculars.

One of the aspects that makes Kubernetes such an interesting and dynamic system to observe is that unlike many other pieces of technology, it is not just one big bird always singing the same song but a group of different bird species who happen to sing a variety of amazing songs.
Using these metaphors around bird-watching relates well to Kubernetes observability. Let's first learn about the equivalent Kubernetes birds we can observe by looking at the key Kubernetes components and start exploring their bird songs by understanding which signals each one emits.
In this blog, we will focus on observing the infrastructure of Kubernetes over observing applications deployed on Kubernetes, giving us a view from the perspective of a Kubernetes cluster administrator.
What is observable in Kubernetes?
Kubernetes has four main components that we need to be aware of in order to understand what we will be observing: the control plane, nodes, pods, and containers.
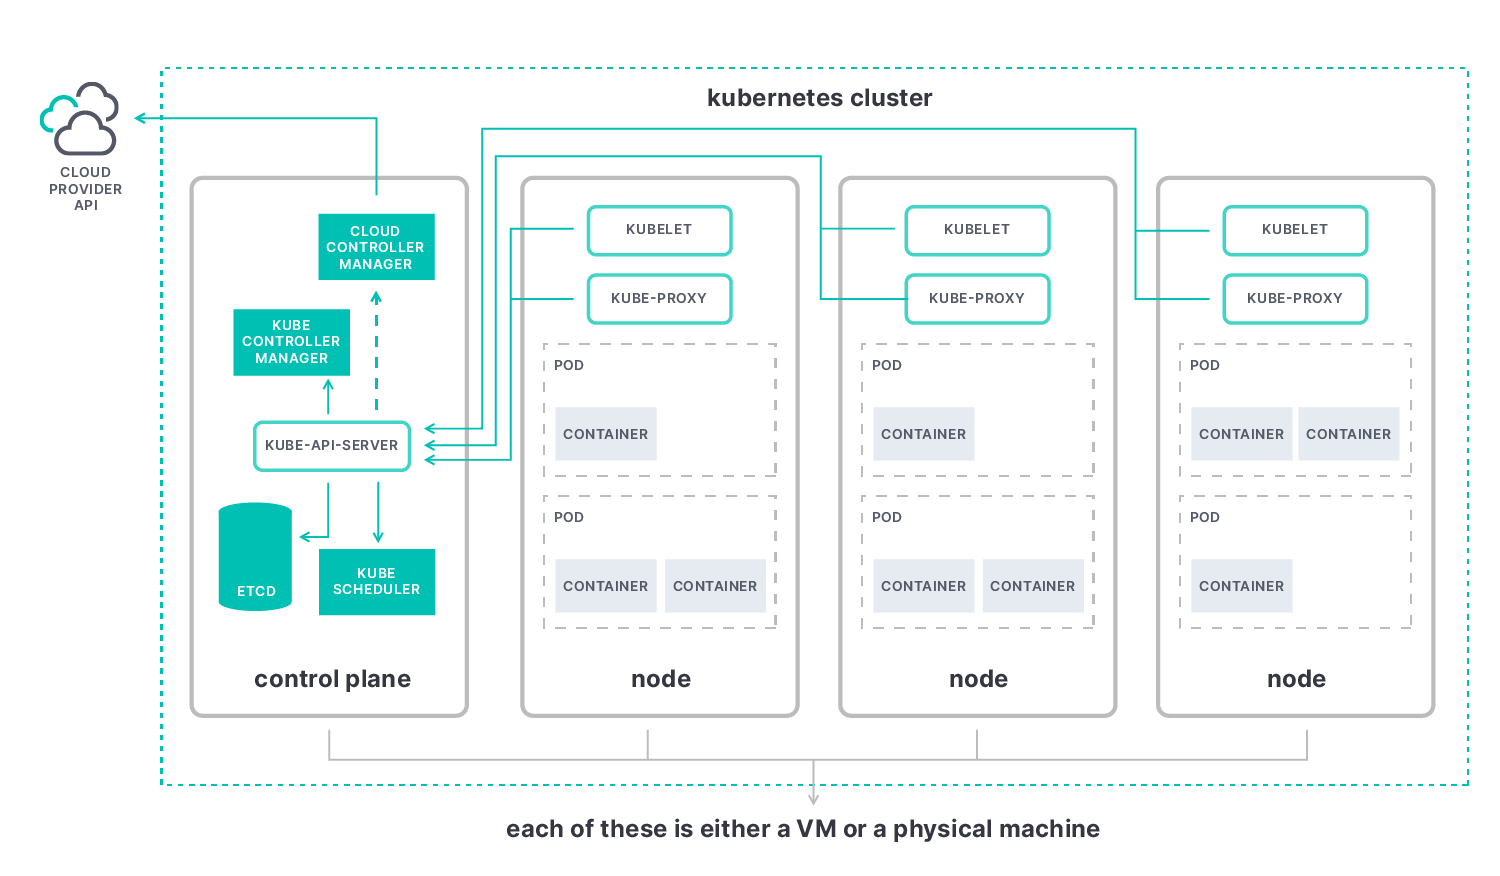
Monitoring the Kubernetes control plane
This is a machine (virtual or physical) comprising a collection of items that are mainly focused on dealing with Kubernetes being an orchestrator. The key element of the control plane is the kube-apiserver, and the data we can get through it will enable us to best understand the overall status of the cluster.
Control plane elements observable through the kube-apiserver are:
- etcd: a distributed key value pair database used as a backing store for cluster data
- kube-scheduler: the controller responsible for deciding which node to place new pods in
- kube-controller-manager: runs all controller processes; logically controllers are separate but to reduce complexity they’re bundled into a single binary and process
- cloud-controller-manager: the controller responsible for interacting with cloud provider resources via the cloud provider API
A read through the Kubernetes documentation is recommended to get into more details of the functions that each of these control plane components is there to perform.
Monitoring Kubernetes nodes
Nodes give Kubernetes its computing power. They are the (virtual or physical) machines pods run on. Each node contains the following elements:
- kubelet: an agent in charge of registering the node with control plane, making sure containers running in each pod are healthy and communicating this information back to the control plane through the kube-apiserver
- kube-proxy: a network proxy that runs on each node, making network communication to pods from inside and outside the cluster possible
- container runtime: the software that is responsible for running containers
More details on each node component can be found in the Kubernetes documentation.
Monitoring Kubernetes pods and containers
Pods are the smallest deployable computing unit in Kubernetes. We can think of pods as a wrapping for running containers.
The most common model is to have one container per pod, but there can be multiple containers running in a pod for use cases that require them to be tightly coupled or share resources, such as applications with sidecar containers.
Understanding the Kubernetes resource based model
Kubernetes has a declarative model based on resources. The idea is that users provide an intent and Kubernetes acts on that intent to create or modify the resources as requested by the user without requiring further user input.
We will discuss only some examples from the full list of resources available through the Kubernetes API.
Workload resources
Pods can be created using different workload resources, which can provide different patterns of deployment. These can be Deployments, ReplicaSets, StatefulSets, DaemonSets, Jobs, etc.
For example, DaemonSets ensure that there is an instance of the same pod running on each node.
Grasping details of how each workload resource works is crucial for a thorough understanding of deployment issues in Kubernetes.
Other relevant resources
- namespace: a cluster resource that can be used to provide logical boundaries for other resources, enabling a cluster administrator to decide who has access to what or monitoring a group of resources that may be linked with a specific area of the business
- event: a report of an event somewhere in the cluster, usually a state change in the system
What can be observed in each Kubernetes component?
Similar to how bird songs are composed of different musical notes, the status of a Kubernetes cluster is derived from the signals it emits. Understanding these signals will get us closer to having music in our ears.
The signals we can get from the Kubernetes components can be categorized within the three pillars of observability: metrics, logs, and traces.
Kubernetes metrics
Metrics are numerical signals that can help us understand a component's overall behavior over time. For example, we can use metrics to build a dashboard to understand resource usage and answer questions such as “What is the average CPU consumption per pod?”
Metrics are available in Prometheus format, which is structured plain text that humans and machines can both read. The majority of Kubernetes components metrics are available on the /metrics endpoint of the HTTP server.
Given the open source origins of Kubernetes, the Kubernetes community makes the decision to introduce or deprecate metrics as the Kubernetes ecosystem grows and evolves. There is a published list of stable metrics to help you stay on top of things.
Kubernetes logs
Logs are records that help us keep track of what a component is doing at a given time. The information provided by logs when correlated with metrics makes for a powerful combination and provides important insights. While metrics will tell you that a resource is dead, logs will help you understand the exact reason the resource died. The lowest level of logs we can gather from Kubernetes is individual container logs — these are available as standard streams (stdout and stderr).
Getting a sneak peek at a pod’s logs using the kubectl cli is as easy as typing the below kubectl logs command.
kubectl logs POD Example:
# Return snapshot logs from a pod running Elastic Agent as its only container

kubectl logs elastic-agent-894vs -n kube-system
The result will contain a number of logs looking similar to the example below.
{"log.level":"info","@timestamp":"2022-10-03T10:39:28.047Z","log.origin":{"file.name":"operation/operator.go","file.line":307},"message":"operation 'operation-start' skipped for filebeat.8.3.1","ecs.version":"1.6.0"}It is important to be aware that Kubernetes containers’ ephemeral nature means that container logs will only be available for the previous and current instance of a container. Therefore, implementing a cluster-level logging solution is required to guarantee access to logs beyond the lifetime of a pod or even the cluster.
Traces in Kubernetes
A trace will record the touchpoints of a request or action as it moves through the different components of a distributed system.
Application layer tracing can be implemented with external components in similar fashion to any other distributed system. For tracing of requests between Kubernetes system components, there is a feature in alpha state aimed at keeping records of latency and relationships between operations in the cluster.
Kubernetes events
There is an area where bird watching significantly diverts from Kubernetes, and that is the ephemeral nature of Kubernetes. Imagine that we’re part of a video game with characters that get killed and respawn automatically with another identity.
Keeping track of that happening would be impossible with conventional heartbeat signals. This is where another type of information called Kubernetes events can help us stay on top of changes.
While Kubernetes events are not part of the aforementioned three pillars of observability, they are a resource that has a crucial role in helping us understand the potential causes of issues. Events are a resource type that is automatically generated when other resources have a change of state, an error occurrence, or any other message that is important to broadcast. Each event message is assigned a type (normal, error, warning, etc.) to better help us categorize those we should be more aware of.
Events can be explored by using the kubectl describe pod command or using kubectl get events.
Getting events with kubectl describe pod example:
# Explore the events related to a specific Kubernetes pod
kubectl describe pod elastic-agent-894vs -n kube-systemThe output of describe will have a section at the end containing the events for this specific pod.
Events:
  Type     Reason             Age                       From                Message
  ----     ------             ----                      ----                -------
  Warning  FailedScheduling   2m (x4886 over 3d16h)     default-scheduler   0/3 nodes are available: 1 Insufficient memory, 2 node(s) didn't match Pod's node affinity/selector.
  Normal   NotTriggerScaleUp  110s (x31772 over 3d16h)  cluster-autoscaler  pod didn't trigger scale-up:
Getting events with kubectl get events example:
# Explore the events across the cluster
kubectl get events -AThe output of describe will have a section at the end containing the latest cluster wide events.
LAST SEEN   TYPE     REASON                   OBJECT                 MESSAGE
49m         Warning  ContainerdStart          node/miguel-cluster1   Starting containerd container runtime...
49m         Warning   DockerStart             node/miguel-cluster1   Starting Docker Application Container Engine...
49m         Warning   KubeletStart            node/miguel-cluster1   Started Kubernetes kubelet.
50m         Normal    Starting                node/miguel-cluster1   Starting kubelet.
50m         Warning   InvalidDiskCapacity     node/miguel-cluster1   invalid capacity 0 on image filesystem
50m         Normal    NodeHasSufficientMemory node/node/miguel-cluster1   Node node/miguel-cluster1 status is now: NodeHasSufficientMemory
50m         Normal    NodeHasNoDiskPressure     node/miguel-cluster1 Node node/miguel-cluster1 status is now: NodeHasNoDiskPressure
Deducing the status of a Kubernetes cluster from signals
Now that we are familiar with a variety of musical notes, it is time to create some observability music!
Similar to how there is no fixed formula to create songs, there is no unique way to find meaningful correlation in the signals we are gathering. There are, however, best practices that can help us make sure we ask the right questions according to our use case and get the best possible answers.
Using Kubernetes metrics to identify issues
The most popular methods for analyzing metrics on distributed systems can help you choose which metrics to gather and how to analyze the performance of your system. Great resources include Google’s SRE book, The four golden signals, Brendan Gregg’s USE method, or Tom Wilkie’s RED method.
Using one of these will help us make music by choosing the metrics relevant to our system. There are different tools to help us stay on top of information; the appropriate one will be based on the circumstances.
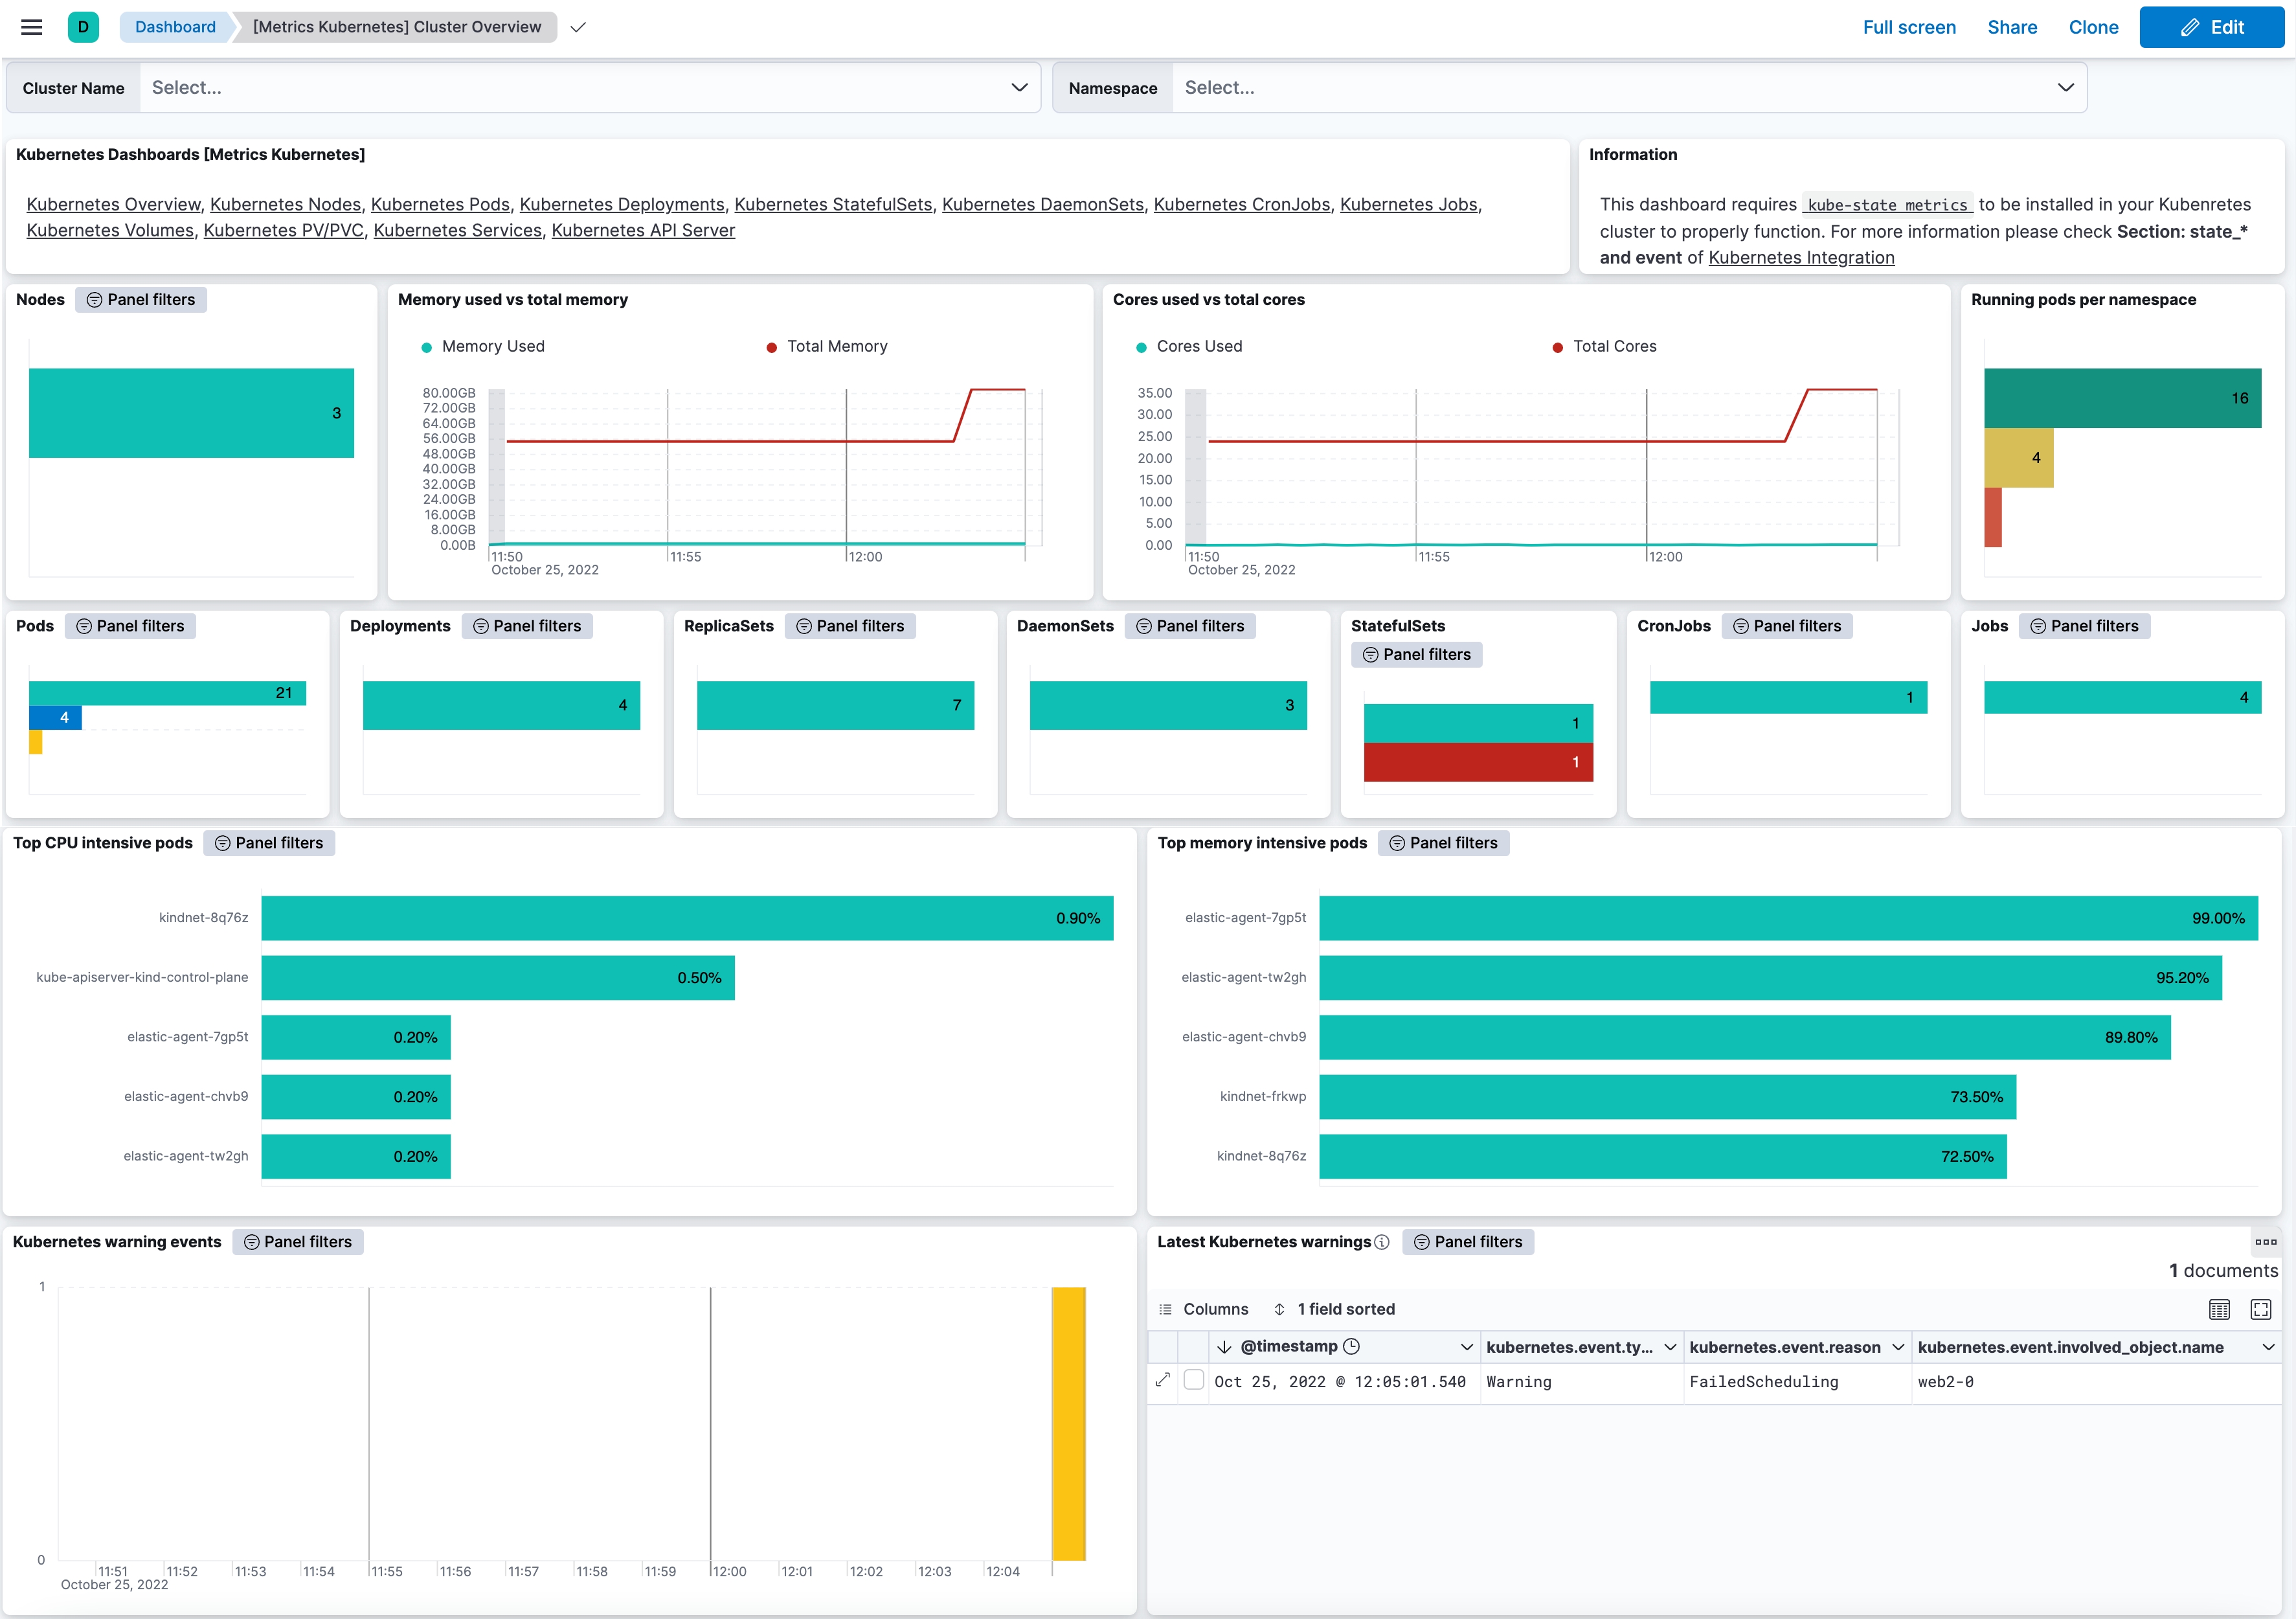
Visualizations
Dashboards can help us get a quick visual of the overall status of the metrics we have chosen or help us understand behavior over time. The below example dashboard provides a good overview of the status of the Pod workload resources and Pod resource usage of CPU and memory.
Staying on top of your Kubernetes cluster at all times
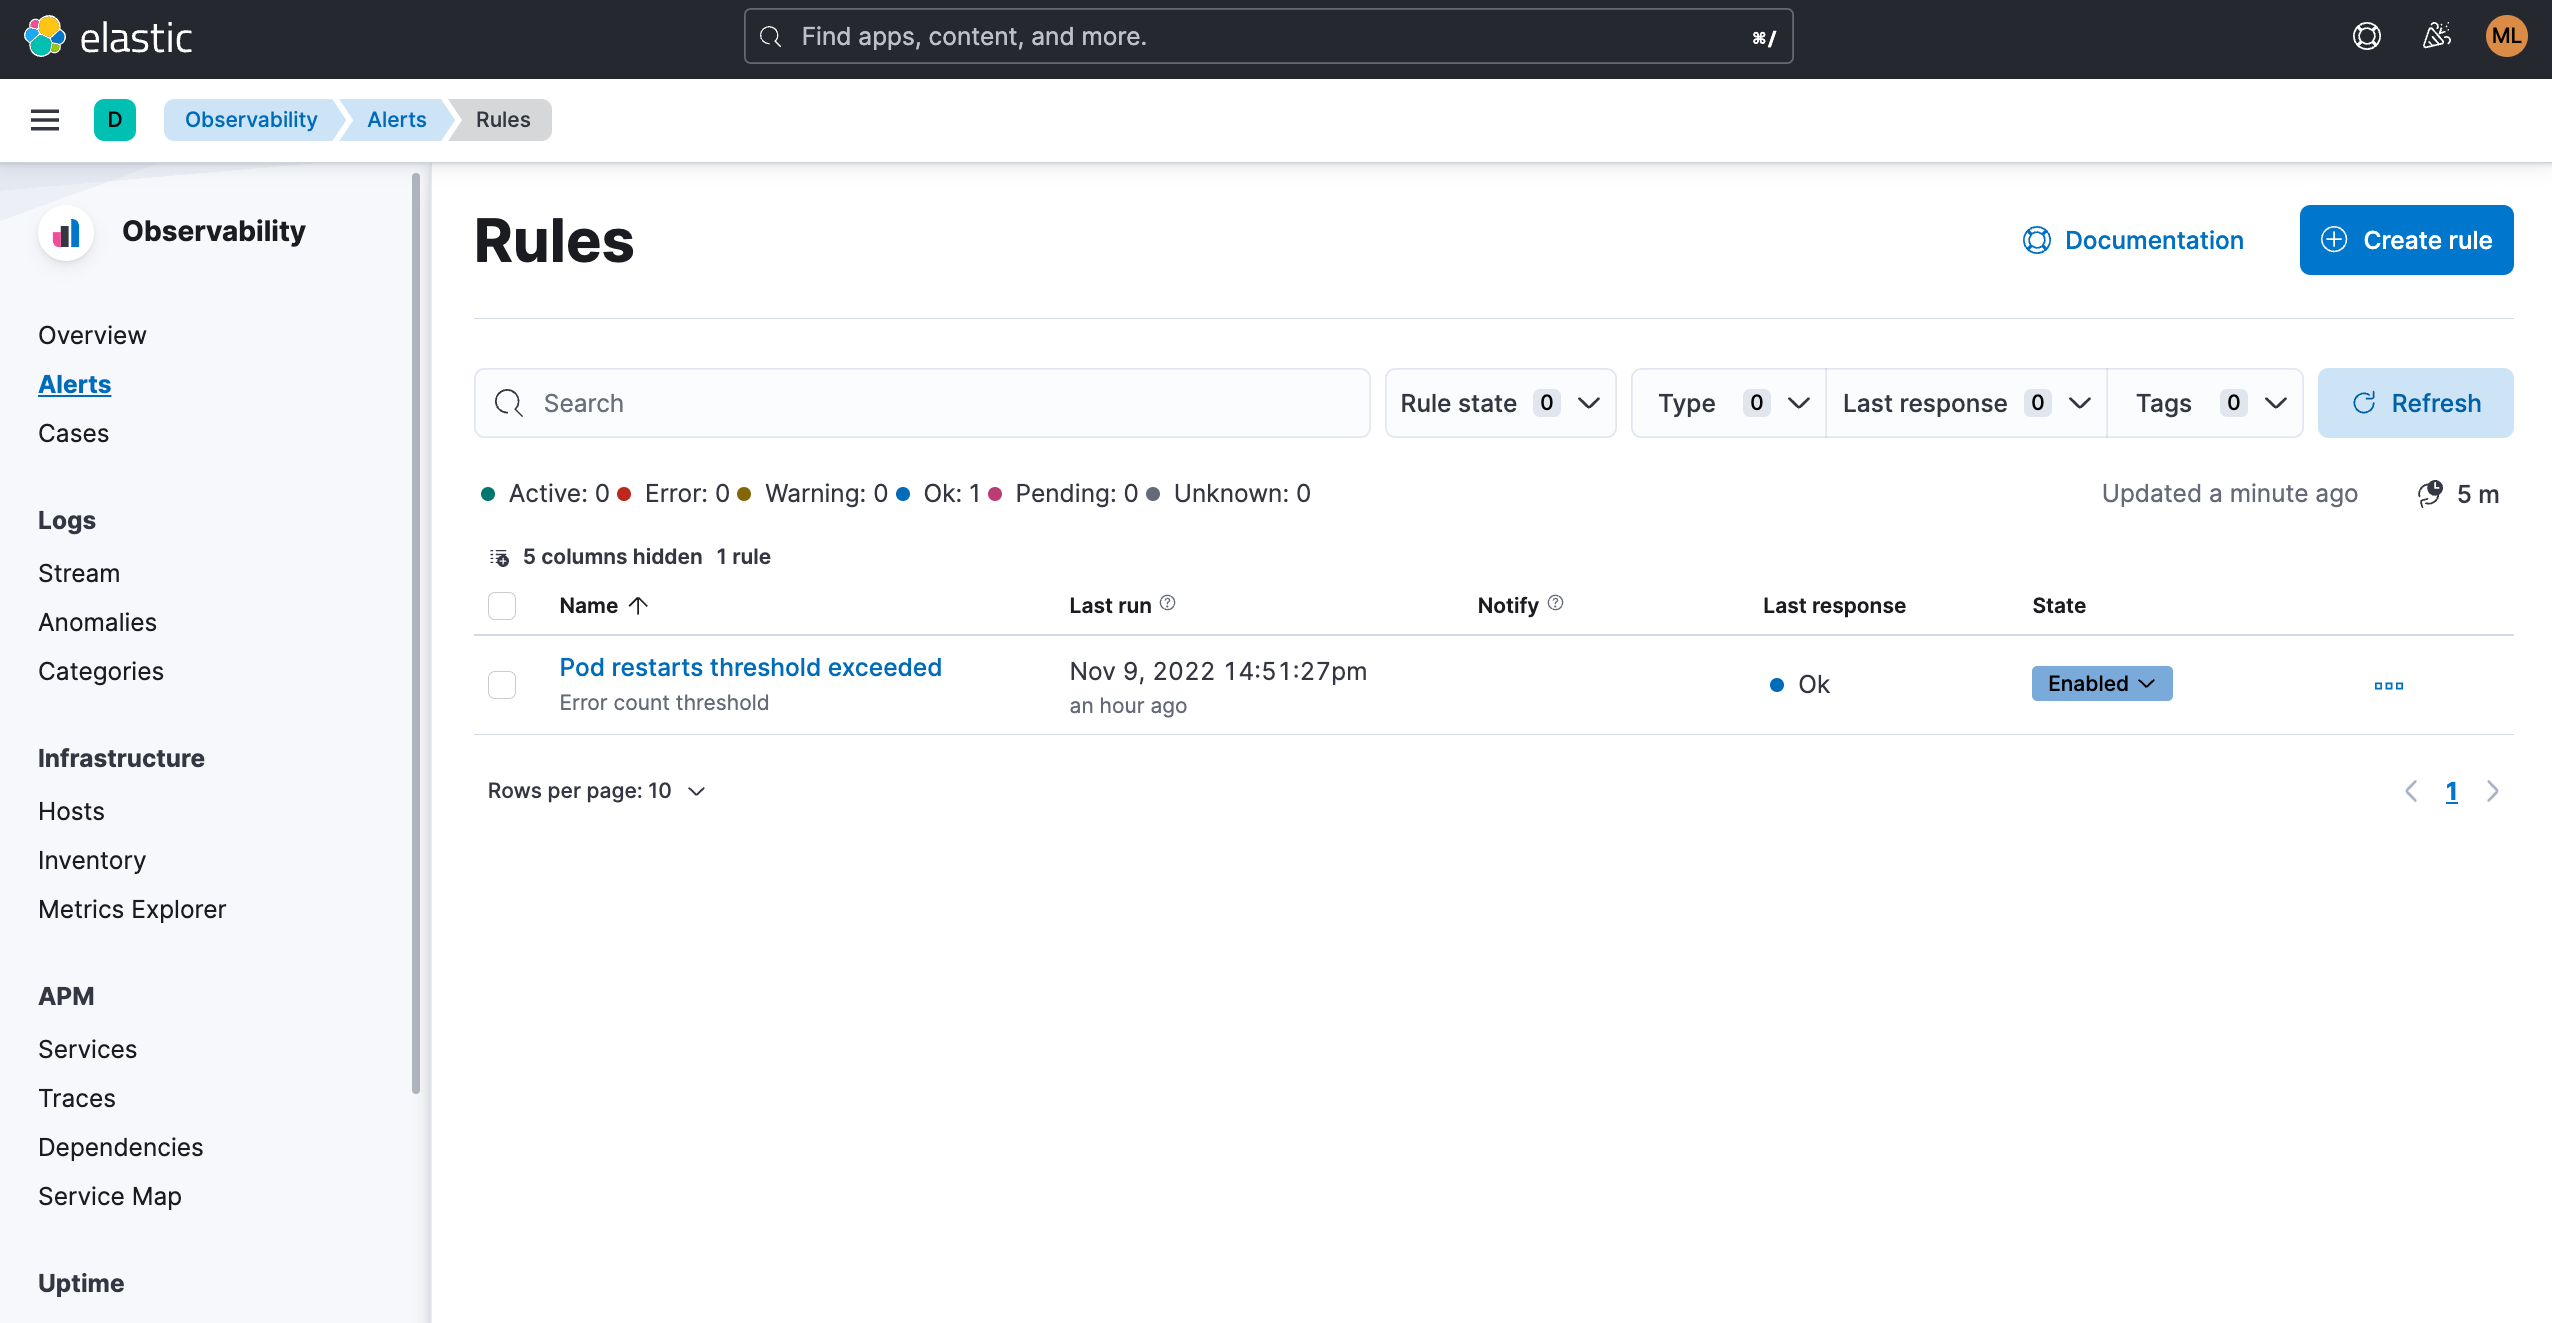
For observability practitioners whose goal is to keep Kubernetes up and running at all times, such as an SRE or a CloudOps professional, being stuck to a dashboard with the hope of looking at the right thing at the right time is not a feasible option. Many common use cases can be covered by implementing threshold rules that will trigger informative alerts when a threshold is reached or close to being reached.
For example, set up an automated rule that will send a Slack message whenever a pod is restarted more than X times within a certain period.
Spotting what you might otherwise miss
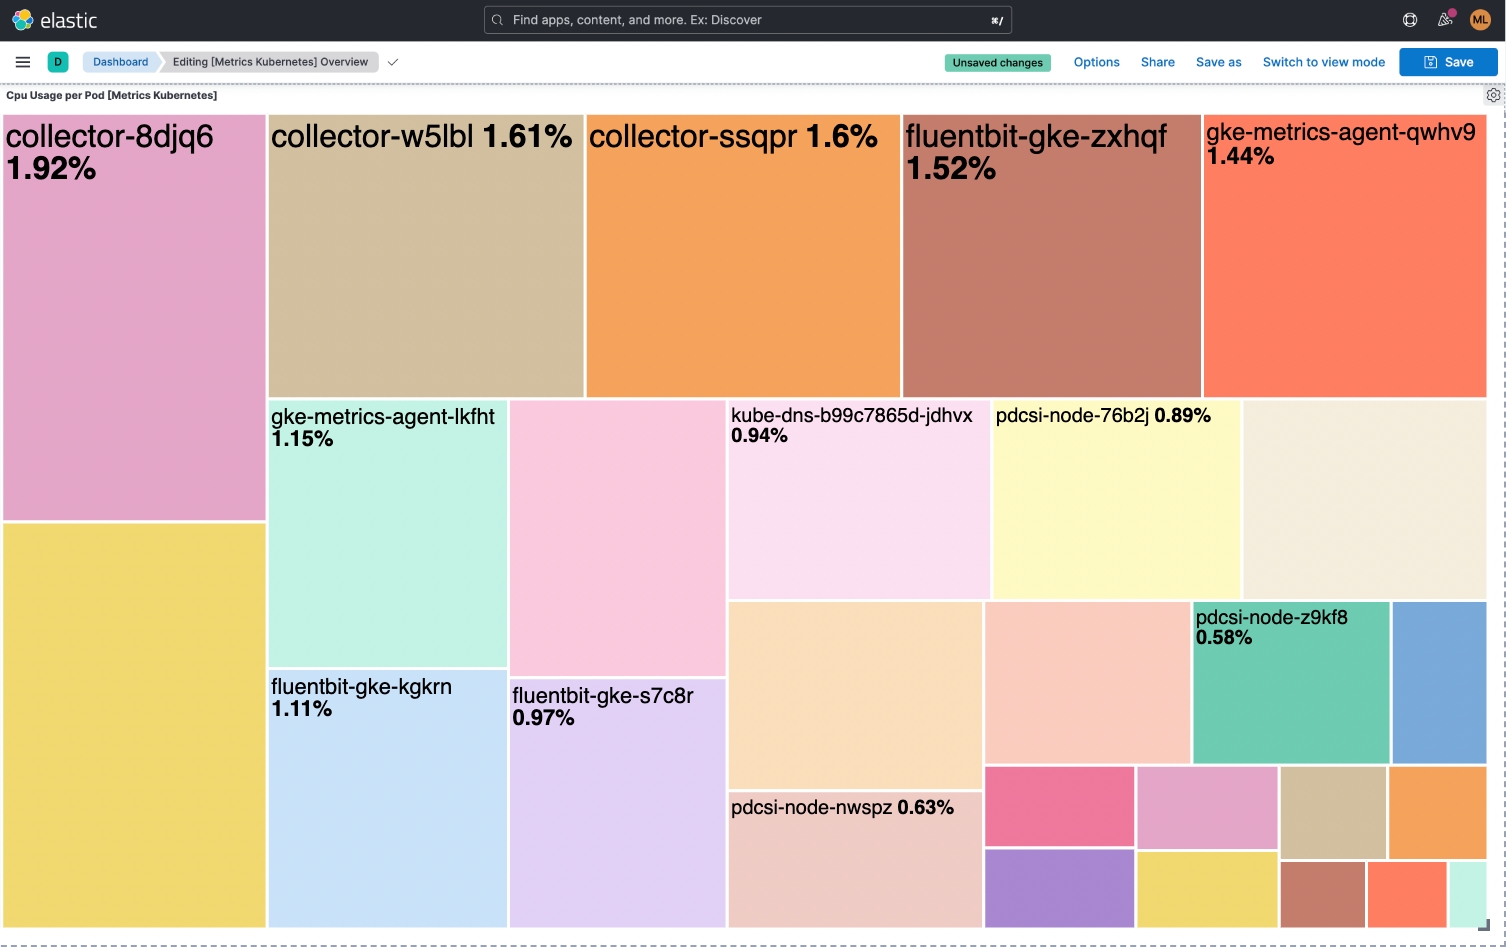
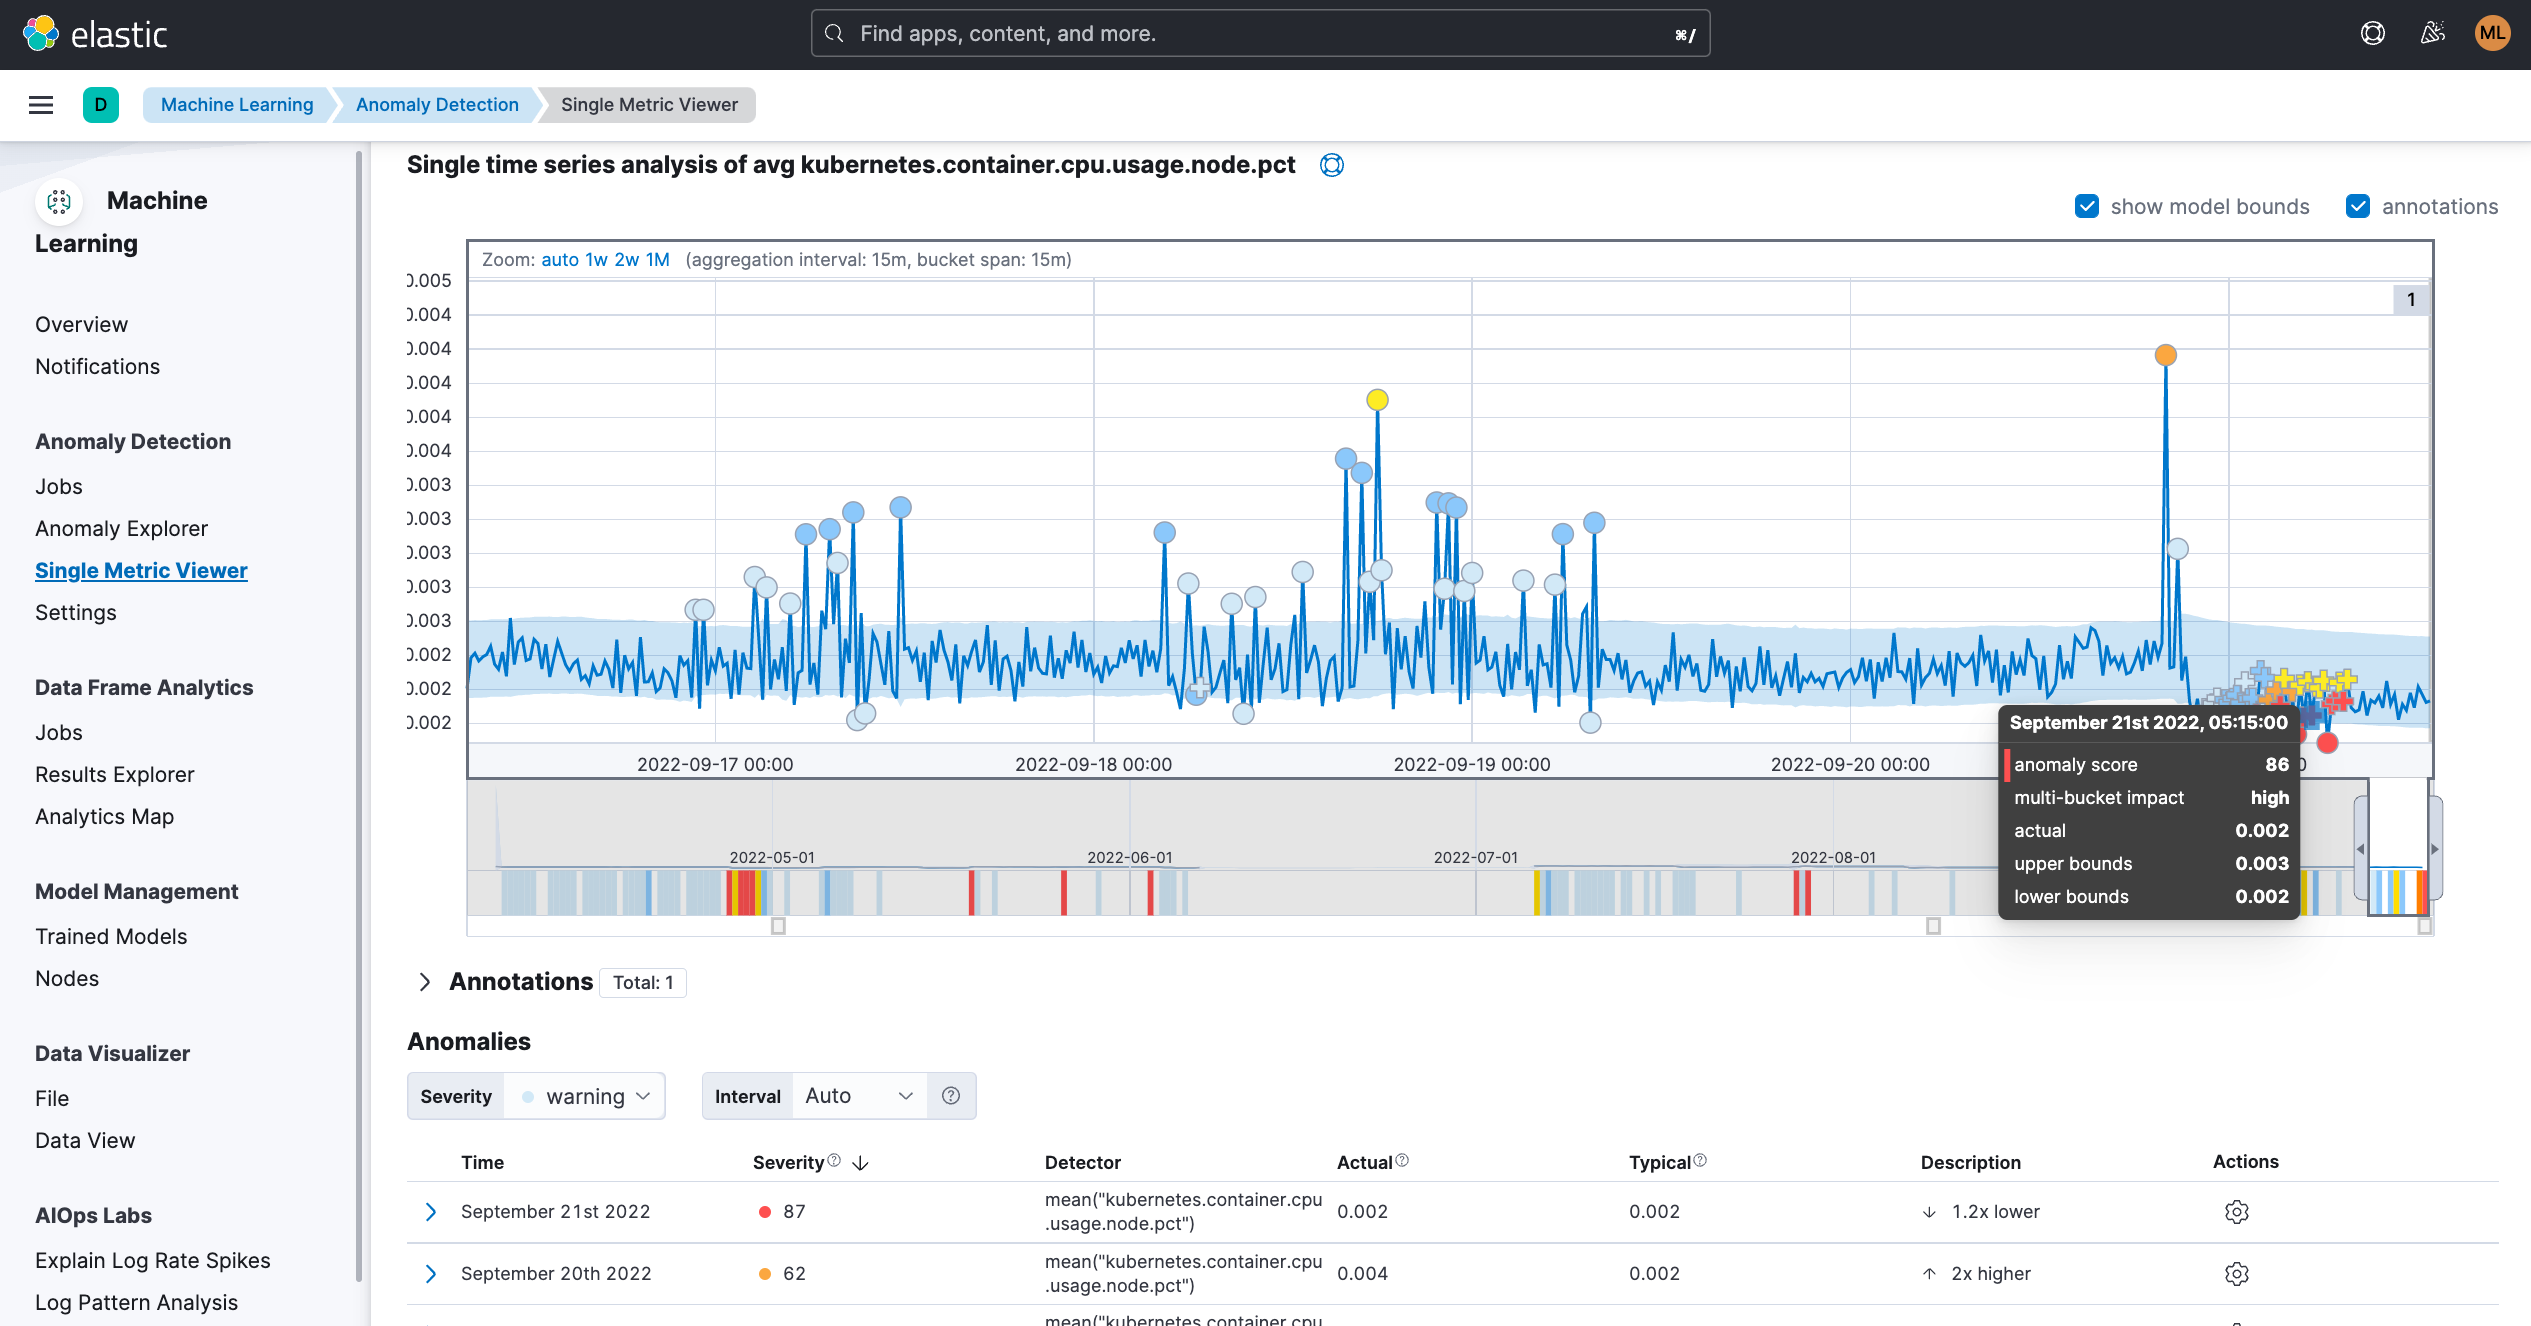
Setting up basic threshold rules will not provide enough coverage given there are behaviors that can only be considered abnormal based on the preceding or surrounding data points. The use of tools like machine learning will enable us to find anomalies in behavior or predict how a Kubernetes component should perform based on trends and with limited guidance required from the user.
For example, using a single metric ML job to identify an anomaly for Kubernetes Pods CPU usage.
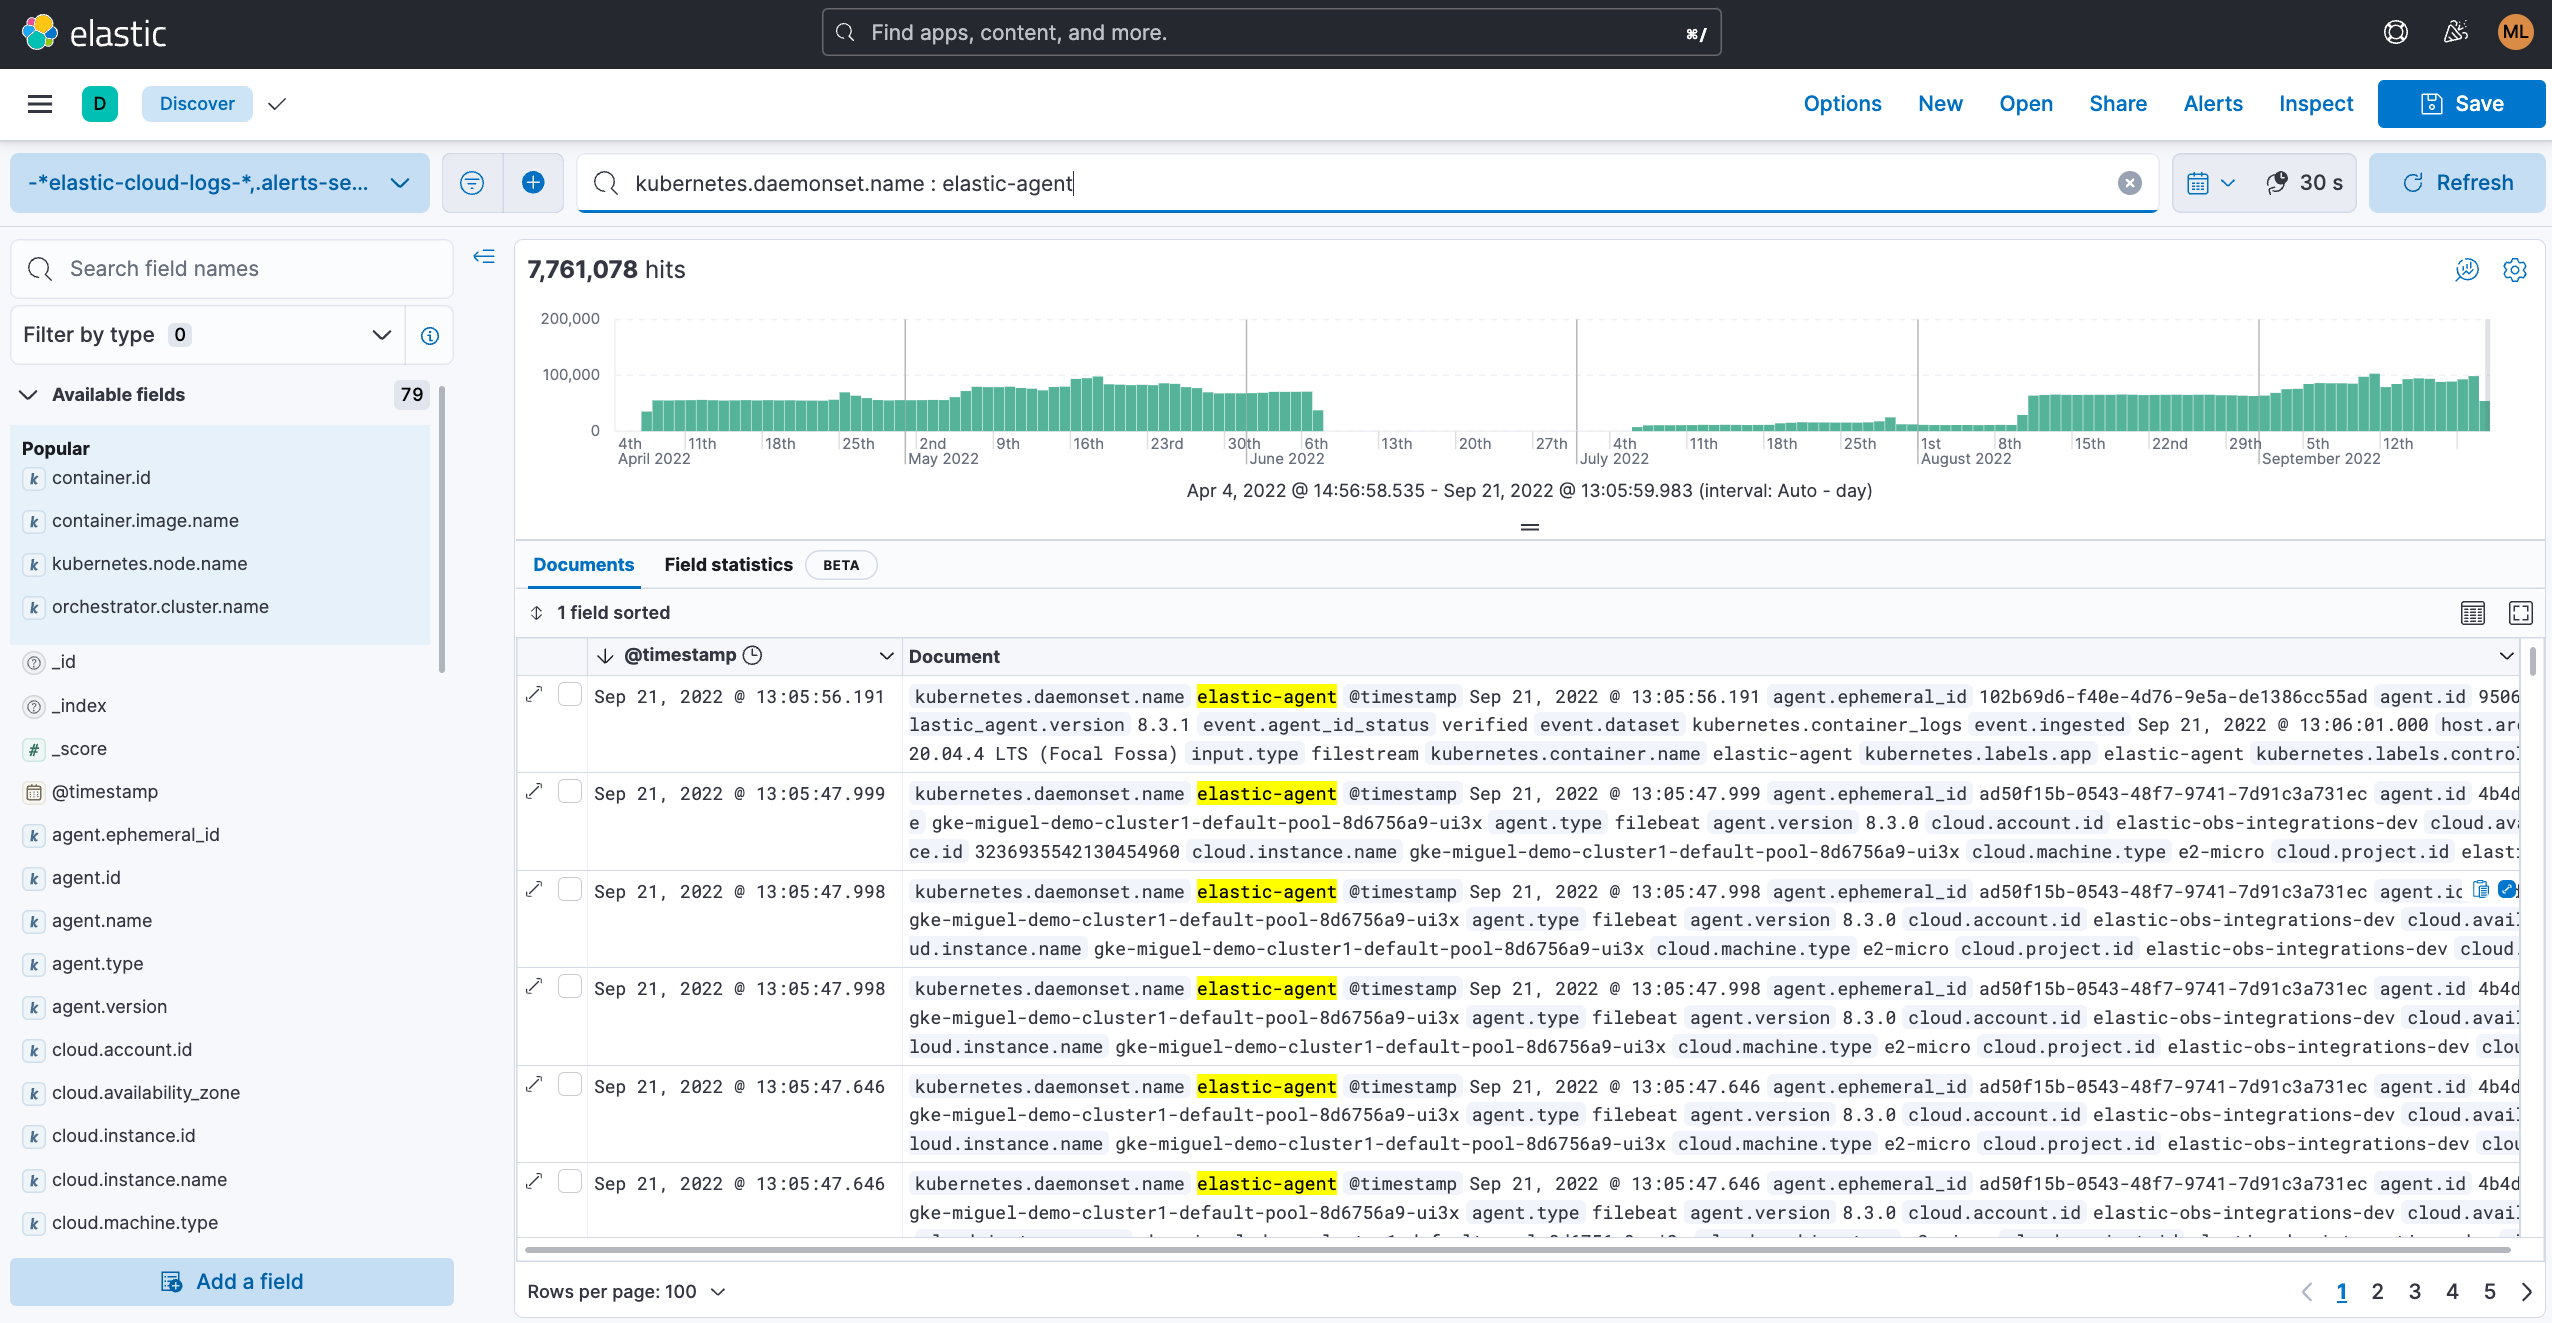
Moving the investigation from metrics to logs
After metrics have helped us identify issues, logs are great at surfacing granular information with rich local context. Trying to find an issue by looking at logs on their own can be compared to finding a needle in a haystack, but once metrics have helped us to narrow down potential cluster issues to a few components, log analysis will help us understand more details about what has happened. Stored and indexed logs can be visualized with a variety of tools to help you slice and dice them as required.
Putting it all into practice
Now that you are familiar with the most common type of Kubernetes birds and their songs, it’s important to actually go and do some Kubernetes watching — this is where finding a good pair of binoculars or a telephoto lens will come in handy.

To properly observe Kubernetes, we need reliable software tools to help us gather and store the data we can get from it and more importantly, help us visualize the most comprehensive picture of the status of our Kubernetes clusters and containers running on them.
Explore how Elastic can provide you with a unified Kubernetes observability solution to help you store all types of Kubernetes signals from logs, metrics, and traces. Elastic Observability offers a multitude of data analysis tools to help you surface the meaning behind the data, such as cluster overview dashboards, log analysis console, and machine learning based anomaly detection.
Share
- Share on Twitter
Share on Twitter
- Share on LinkedIn
Share on LinkedIn
- Share on Facebook
Share on Facebook
- Share by Email
Share by Email
- Print this page
Print