Create anomaly detection jobs with AI in chat
If you have time series data and want to catch unusual behavior in it, but you're not sure how to set up an anomaly detection job, you can describe your data and your goal to an AI agent in Elastic Agent Builder. The agent asks follow-up questions in everyday language, tests a proposed setup on your historical data, and creates real-time jobs only after you've reviewed the results.
Because the agent uses a large language model, its questions and the setup it proposes can vary between conversations. Nothing runs in real time, and no job is deleted, until you approve it.
- Turn on the
agentBuilder:experimentalFeaturesadvanced setting. Theanomaly-detectionskill doesn't appear without it. - Use an agent that has the
anomaly-detectionskill. The default Elastic AI Agent has it because Elastic capabilities are on by default. For a custom agent, turn on Elastic capabilities or assign the skill to the agent. - Make sure your user has the Kibana and Elasticsearch privileges to create and run anomaly detection jobs. Refer to Setting up machine learning.
- Have time series data in Elasticsearch, such as logs or metrics, with a timestamp field.
Start a chat with an agent that has the
anomaly-detectionskill. Describe what you want to detect and where your data is. For example:Detect unusual error rates per host in my nginx access logs.The agent first checks which fields and time range your data has, and starts from a prebuilt machine learning configuration if one matches.
Answer the agent's questions. They're about your goal, not machine learning settings, for example what a bad day looks like, how fast you need to know about a problem, and whether planned events such as deployments would look unusual. The agent turns your answers into a job configuration.
Review the proposed setup. The agent validates it, estimates the memory it needs, and summarizes the time range, record count, and expected run time in plain language, along with the full job and datafeed definitions. It then asks whether to run the setup on your historical data first. A test run lets you review the results and adjust the setup before anything goes live.
If you agree to the test run, wait while the agent analyzes your historical data. It then summarizes what it found, such as the number of anomalies, the highest score, and the time and entity behind the strongest one. It also shows a swim lane, anomaly charts, and a single metric viewer in the conversation, with a link that opens the jobs in the Anomaly Explorer.
The charts are interactive. Use a chart's time range picker to change the period it shows, select View in Anomaly Explorer or View in Single Metric Viewer to continue in the full app, or select Save to dashboard to add the chart to a new or existing dashboard. The app and the saved panel open with the period you set, and saving needs permission to edit dashboards.
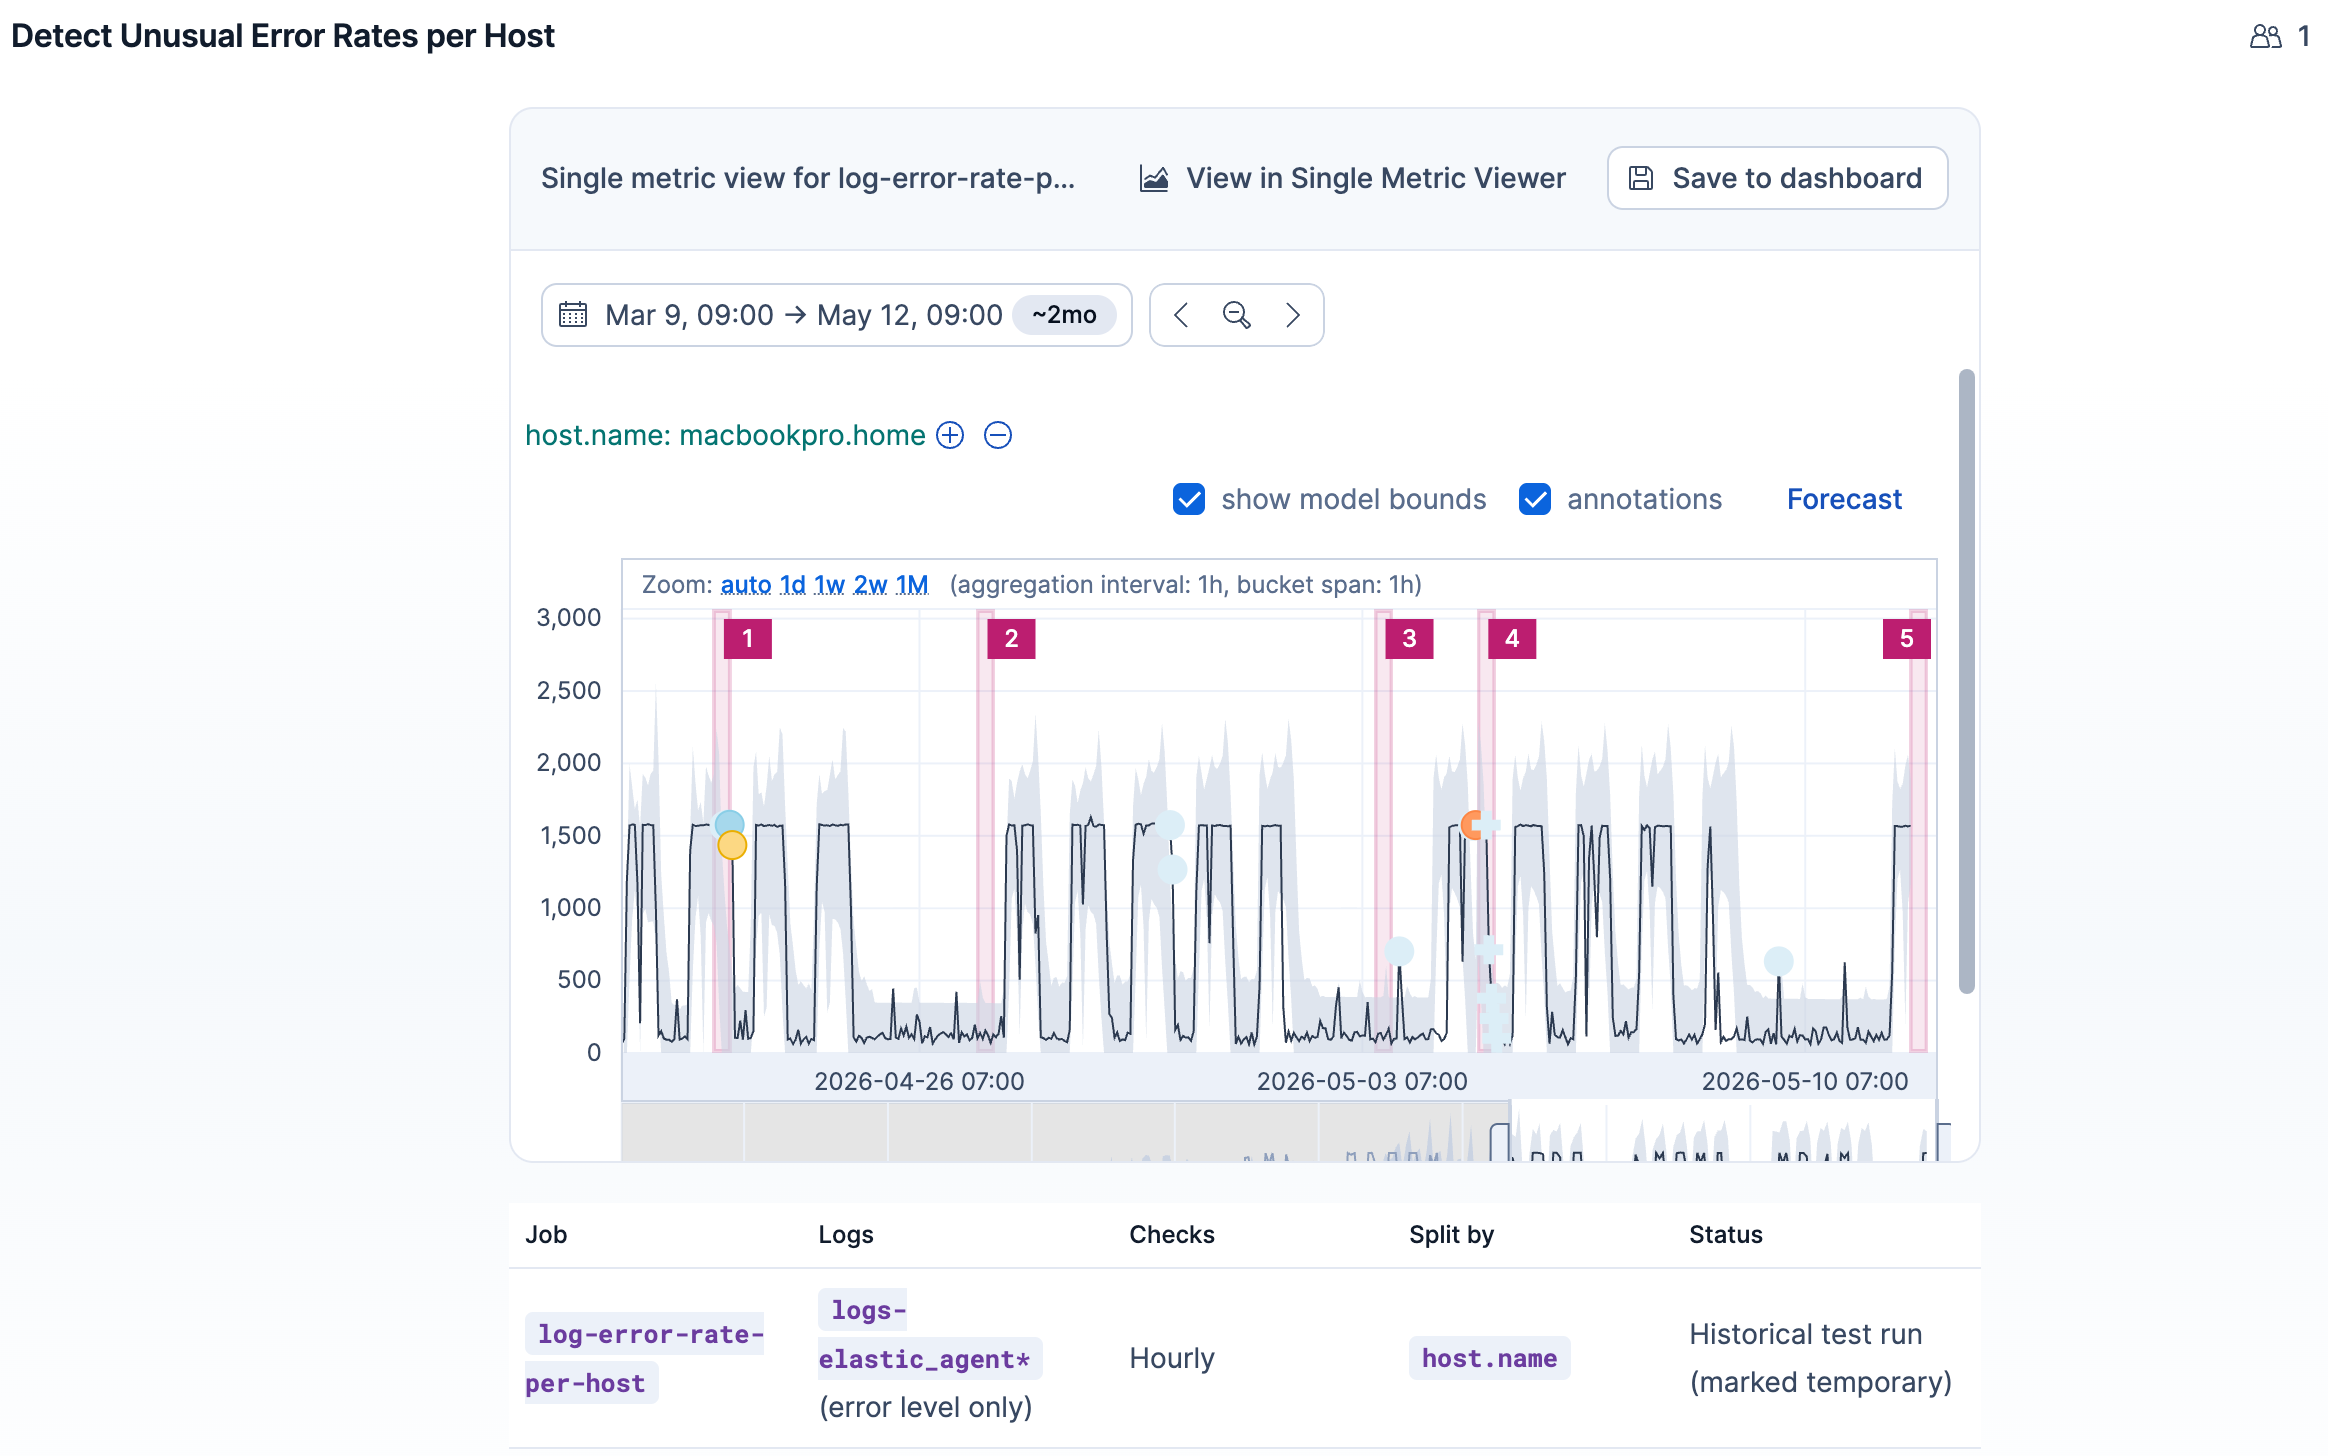
If the agent finds no anomalies, it says so and offers to widen the time range, try a different field or function, or adjust the sensitivity. That can mean your data is very consistent or that the setup needs adjusting.
Tell the agent whether the results look right.
- If they do, the agent creates a second set of jobs with the same configuration that runs on incoming data from now on. These jobs get new IDs, such as the original ID plus
-realtime, so they don't replace the historical ones. The agent then offers to delete the historical jobs, which it does only after you confirm, and to create an alerting rule. - If they don't, tell the agent what looked wrong, such as too many false alerts, the wrong entities, missing events, or the wrong time scale. The agent adjusts the setup and runs it again.
- If they do, the agent creates a second set of jobs with the same configuration that runs on incoming data from now on. These jobs get new IDs, such as the original ID plus
To check the outcome, open the Anomaly Detection Jobs page. It lists the new real-time jobs, open with their datafeeds started, and the historical jobs until you delete them. The model keeps learning what's normal for your data, and the results improve over time.
The test run uses temporary jobs. The agent adds them to a job group named ml-agent-scratch, a label that lets you refer to several jobs at once, for example in calendars or alerting rules, so it can tell them apart from your other jobs. The real-time jobs don't carry that group.
When you approve the results, the agent names every historical job it wants to delete and deletes only jobs in that group, after you confirm. If you decline, the jobs stay in place. You can delete them yourself later, or keep them to review the historical results.
If you accept the agent's offer to set up alerting, it creates a Kibana Classic Alerting rule and lets you pick one of two rule types:
- Anomaly detection: Notifies you when a job's results match the conditions you define. The agent proposes a default severity threshold of 75 and asks whether you want to change it.
- Anomaly detection jobs health: Notifies you when a job has an operational problem, such as a stopped datafeed or a memory limit error.
Refer to Generating alerts for anomaly detection jobs to learn how these rules work.
- To adjust a job the agent created, or to explore its results, open it in the Anomaly Explorer. Refer to View the results.
- To ask the agent about existing jobs, such as which entity caused a spike, why a score is high or low, or why a datafeed stopped, use the same
anomaly-detectionskill. Refer to its entry in the built-in skills reference.