Create a dashboard drilldown
A dashboard drilldown opens another dashboard and can carry the time range, filters, and query with it. Use one to continue from a summary into a more specific view.
For example, a dashboard can show logs and metrics for several data centers. A drilldown can open a dashboard for the one data center or server you select.
Refer to Drilldowns to choose a drilldown type.
To create a dashboard drilldown, you need:
- All privilege for the Dashboard feature in Kibana
- An existing dashboard with at least one panel that supports drilldowns
- A destination dashboard.
The following panel types support dashboard drilldowns:
- Visualizations that use a data view
-
Visualizations based on an ES|QL query - Vega visualizations
- Maps
- Legacy Kibana visualization types, such as TSVB, Aggregation-based, and Timelion
A drilldown is compatible only with indexed fields. Fields created at query time are not supported. Refer to Values that cannot open a drilldown.
This example opens another dashboard from a panel. Follow it with the sample data, or use your own dashboards.
Add the Sample web logs data. This also adds the [Logs] Web Traffic dashboard.
If you don't already have a dashboard to open from the panel, create one. This example uses a dashboard named Detailed logs.
Create the Detailed logs dashboardCreate a new dashboard.
-
In the application menu, select Add → From library. -
In the application menu, select Add from library.
-
Add the [Logs] Visits panel.
Save the dashboard. In the Title field, enter
Detailed logs.
Open the [Logs] Web Traffic dashboard and select Edit.
Set a search, a filter, and a time range for the drilldown to carry.
Search:
extension.keyword: ("gz" or "css" or "deb")
Filter:geo.src: US
Time filter: Last 30 days, or a 30-day period that contains data, depending on when you installed the sample data.Hover over the [Logs] Errors by host panel, open the panel menu, then select Create drilldown.
Select Go to dashboard.
- In Name, enter a name. For example,
View details. - From Choose destination dashboard, select Detailed logs.
- To keep the
geo.srcfilter, the KQL query, and the time filter, select Use filters and query from origin dashboard and Use date range from origin dashboard. - Select Create drilldown.
- In Name, enter a name. For example,
Save the dashboard.
On the [Logs] Errors by host table, select + on a value, then select View details.
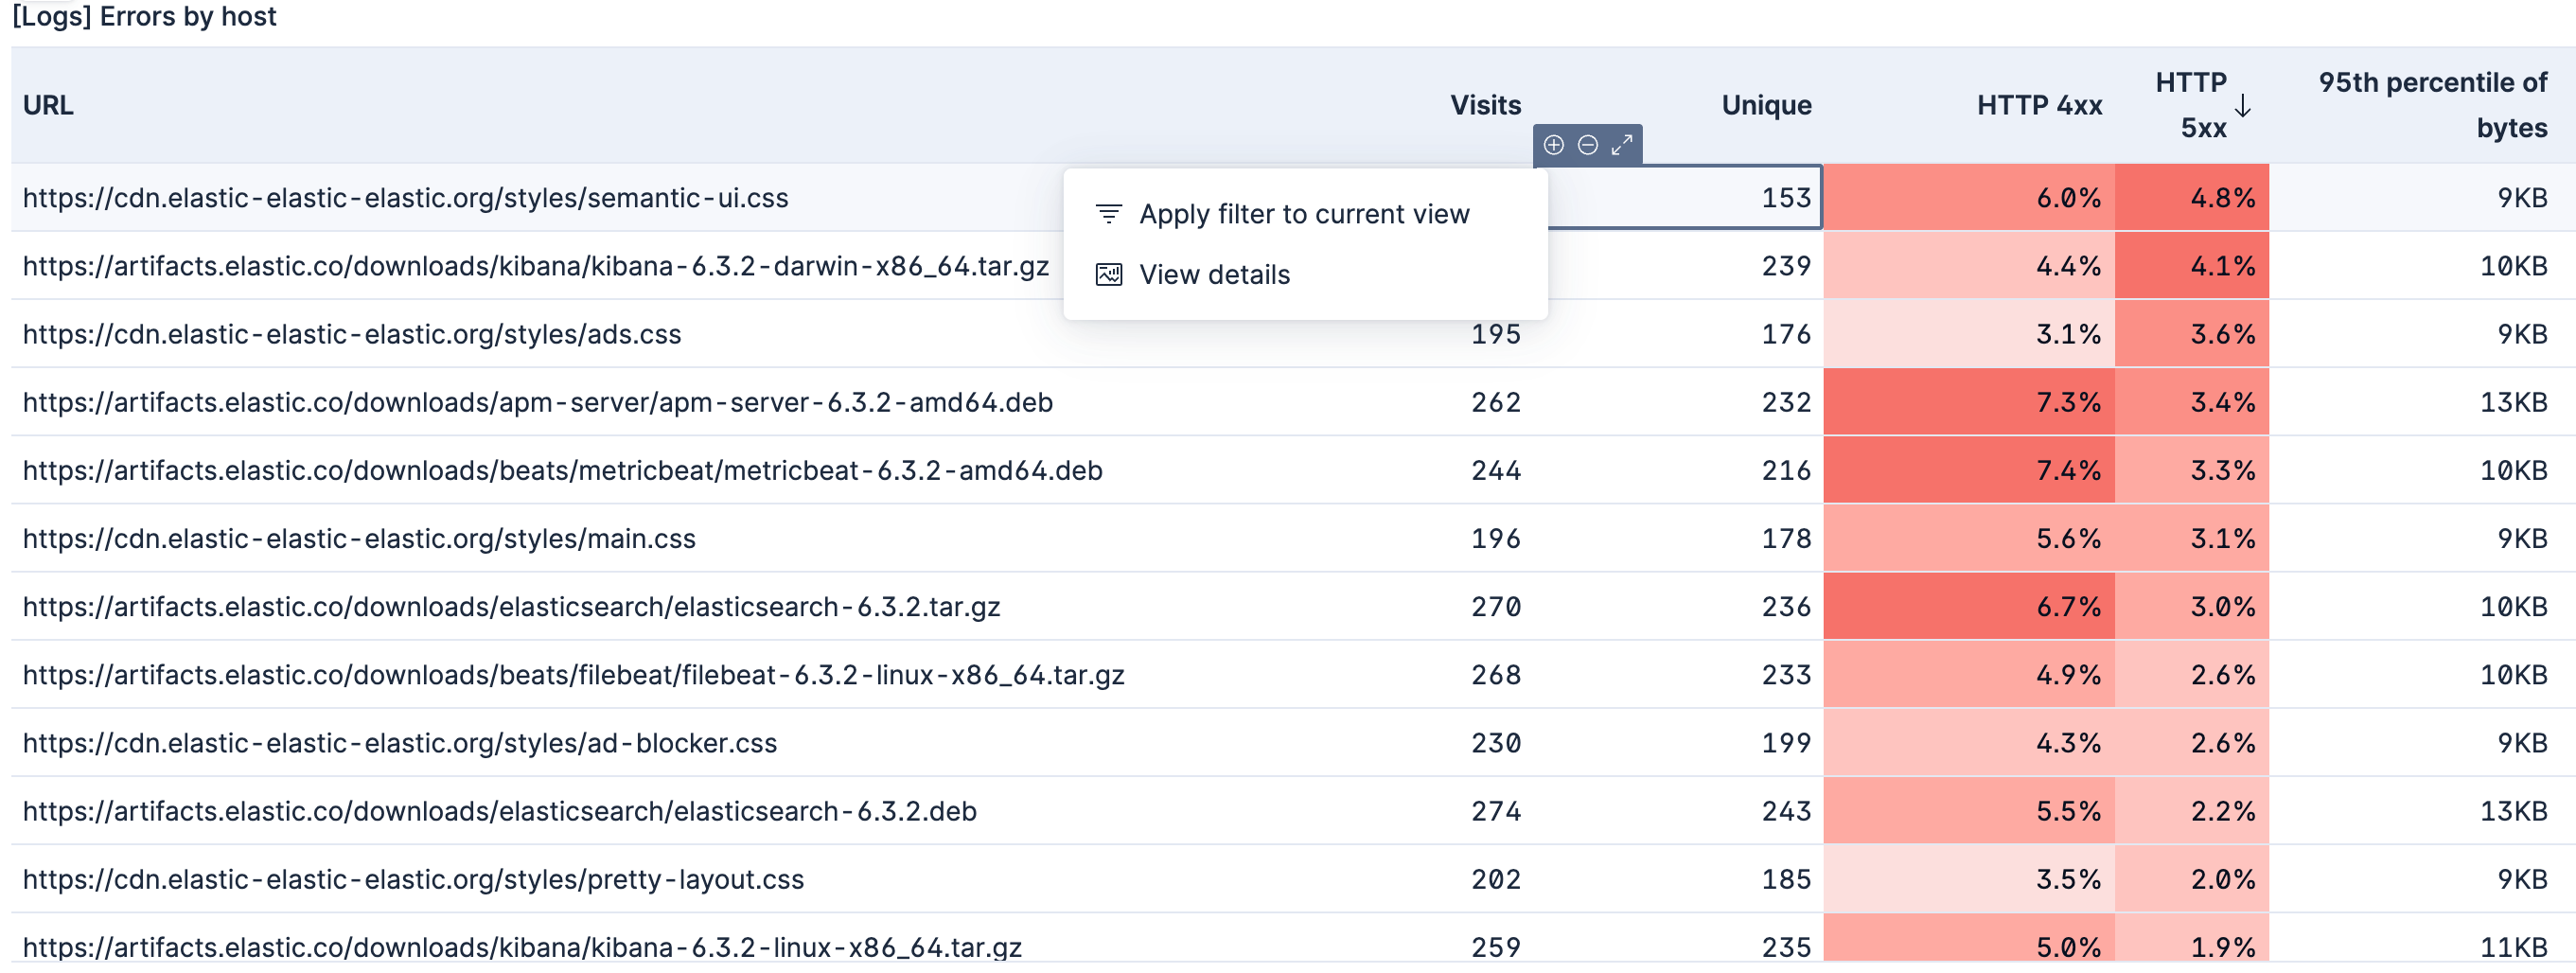
The Detailed logs dashboard opens with the geo.src filter, the KQL query, and the time range you set.