Work with ES|QL results in Discover
After an ES|QL query runs in Discover, the results table shows what that query returned. You can filter the rows, sort them, and show the fields you want. You can also set the time filter, and the table and the chart use that time range.
- Rows: Filter from a value, or sort rows or change which rows the query returns. Show more than 1,000 rows with
LIMIT. - Columns: Show the fields you want, from the fields list or with
KEEP. The table displays at most 50 columns. - Time filter and chart: Set the time filter for the table and the chart. Discover applies the time filter when the data has an
@timestampfield. If the time field has another name, name it in the query.
To keep the chart or the table, save the session or add it to a dashboard.
- You need an ES|QL query in Discover that returns rows. If you're new to ES|QL in Discover, start with Get started with ES|QL in Discover.
Hover over a value in the results table, then filter for it or filter it out.
Filter for this keeps that value. For example,
WHERE `machine.os` == "osx".Filter out this excludes that value. For example,
WHERE `machine.os` != "osx".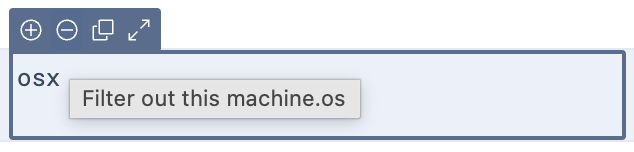
Filtering for multi-value fields translates into WHERE MV_CONTAINS or WHERE NOT MV_CONTAINS clauses. For example, WHERE MV_CONTAINS(`tags.keyword`, ["error", "security"]::keyword).
ES|QL mode has no filter bar, and dragging a field onto the table doesn't change the query.
Result: When you select Filter for this or Filter out this, Discover adds or completes a WHERE clause for that value, and the table shows the matching rows.

From the menu of a column, select Sort High-Low or Sort Low-High. Discover reorders the rows already in the table. The query stays the same, and Discover doesn't run it again.
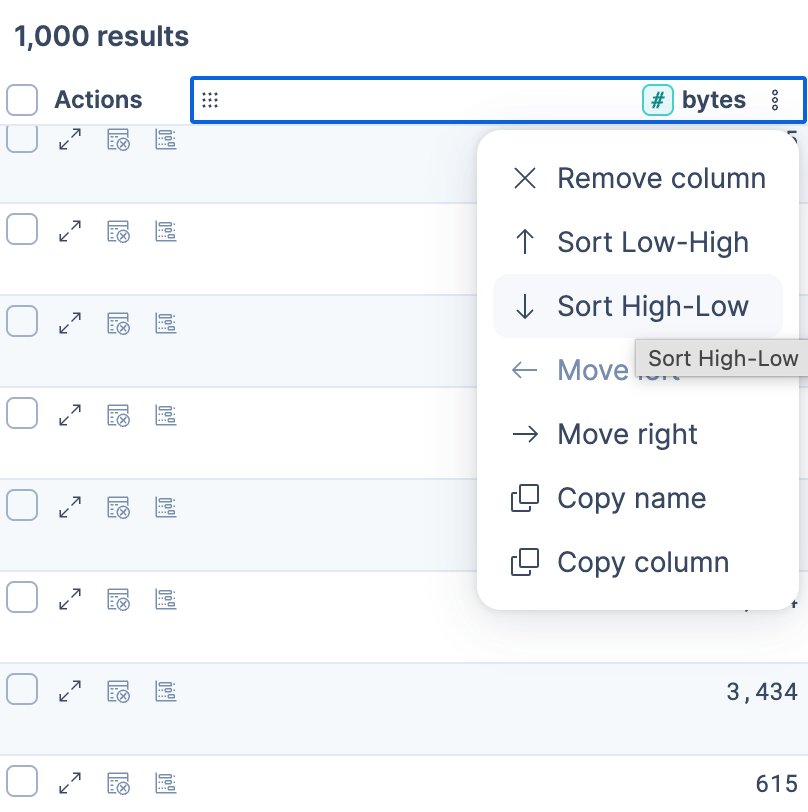
Result: The table shows those same rows in the new order, and the query has no SORT command.

A column sort reorders only the rows the query returned. For a FROM query with no LIMIT, that is at most 1,000 rows. To change which rows come back, add a SORT command. Elasticsearch orders the data, then keeps the first rows of that order. This query returns the 1,000 largest bytes values:
FROM kibana_sample_data_logs
| KEEP @timestamp, bytes, geo.dest
| SORT bytes DESC
Until you add fields, the table shows a Summary column of each result's key-value pairs. The time field is the first column when the data has @timestamp, or when the query names that field.
When a query without a command such as KEEP or STATS returns five or fewer columns, Discover shows each column individually instead of the Summary column.
To hide the time field, enable Hide 'Time' column (doc_table:hideTimeColumn).
Add a field from the fields list to show it as its own column. The query stays the same.
KEEP or STATS, the time field stays the first column after you add other fields. CSV exports from Discover and from Discover session panels on dashboards also include the time field.
To control which fields the query returns, use the KEEP command:
FROM kibana_sample_data_logs
| KEEP bytes, geo.dest, machine.os, response.keyword
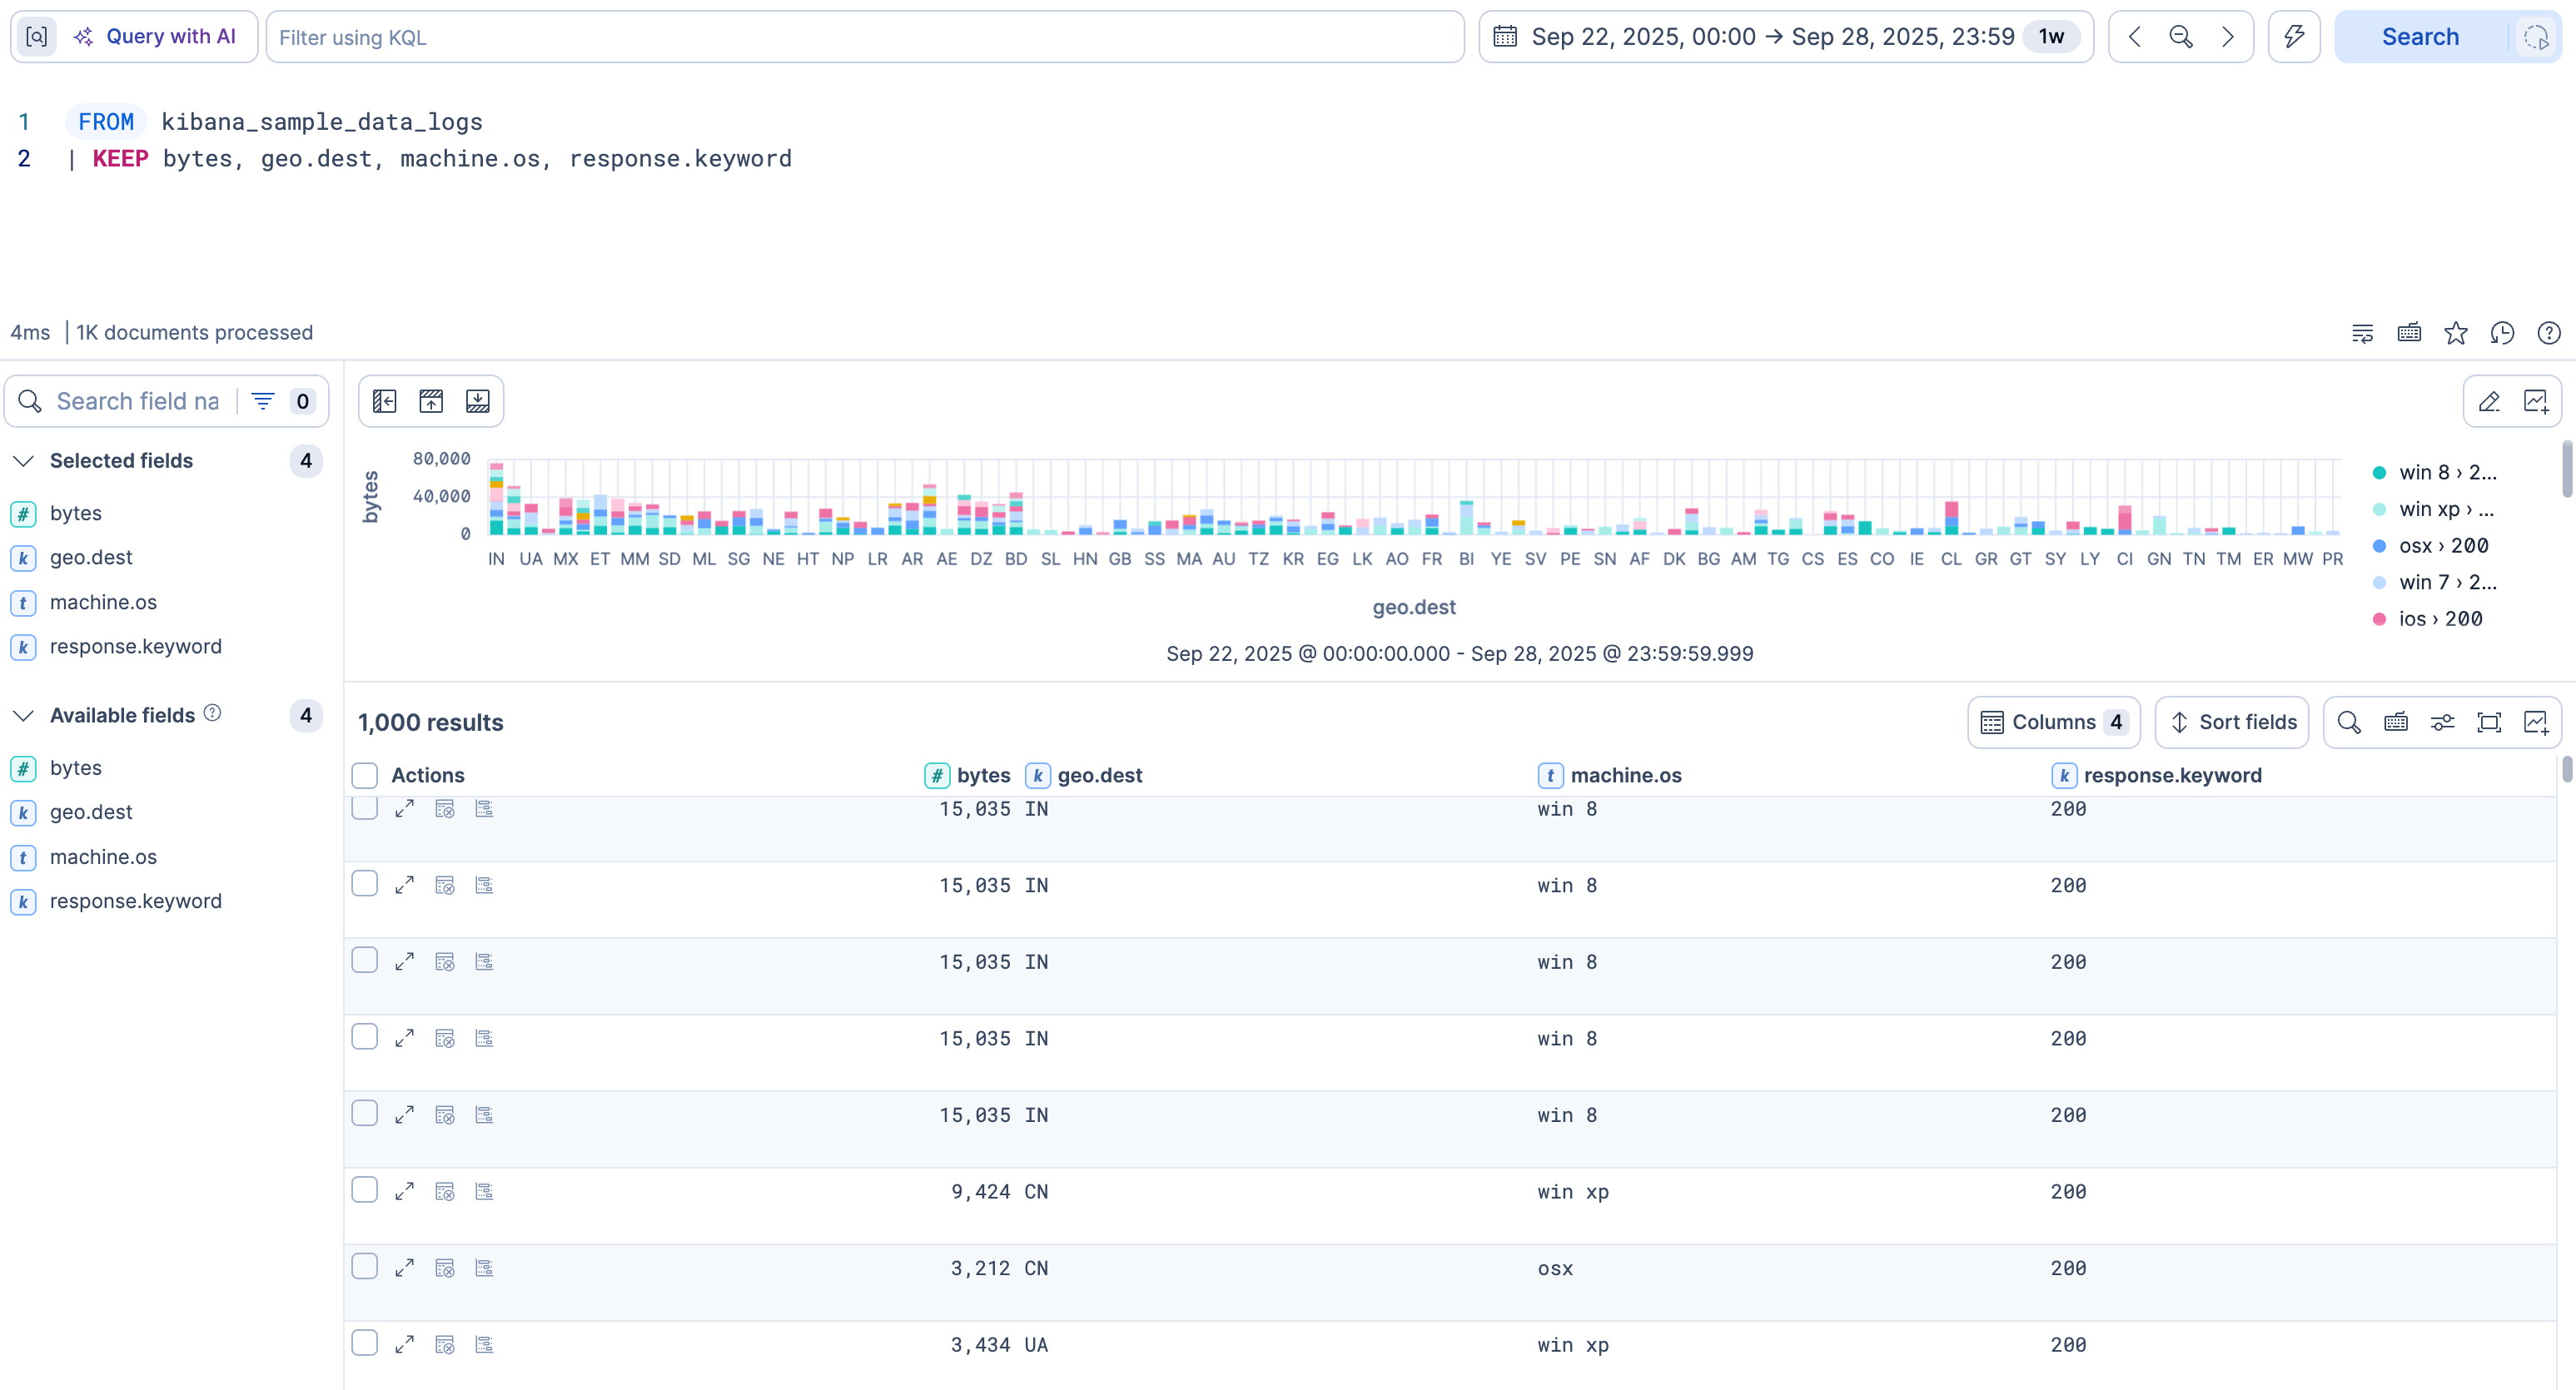
To display all fields as separate columns, use KEEP *:
FROM kibana_sample_data_logs
| KEEP *
If you omit LIMIT, the table shows up to 1,000 rows, or up to 10,000 rows for queries that start with TS or PROMQL. LIMIT can raise that to 10,000, which is as many rows as Discover displays. Aggregations still run on the full data set.
- Column limit: Discover displays up to 50 columns. If a query returns more than 50 columns, only the first 50 are shown.
- CSV export: CSV exports from Discover are also limited to 10,000 rows. Queries and aggregations still run on the full data set.
When the data has an @timestamp field, the time filter applies to the table and the chart.
If the time field has another name, name it in the query with the ?_tstart and ?_tend parameters. For the editor behavior, refer to Custom time parameters.
For example, the eCommerce sample data set has no @timestamp field. It has an order_date field. With this query, the time filter doesn't apply, and Discover shows no chart:
FROM kibana_sample_data_ecommerce
Add the parameters on order_date. The time filter then applies, and Discover shows the chart.
FROM kibana_sample_data_ecommerce
| WHERE order_date >= ?_tstart AND order_date <= ?_tend
| LIMIT 100
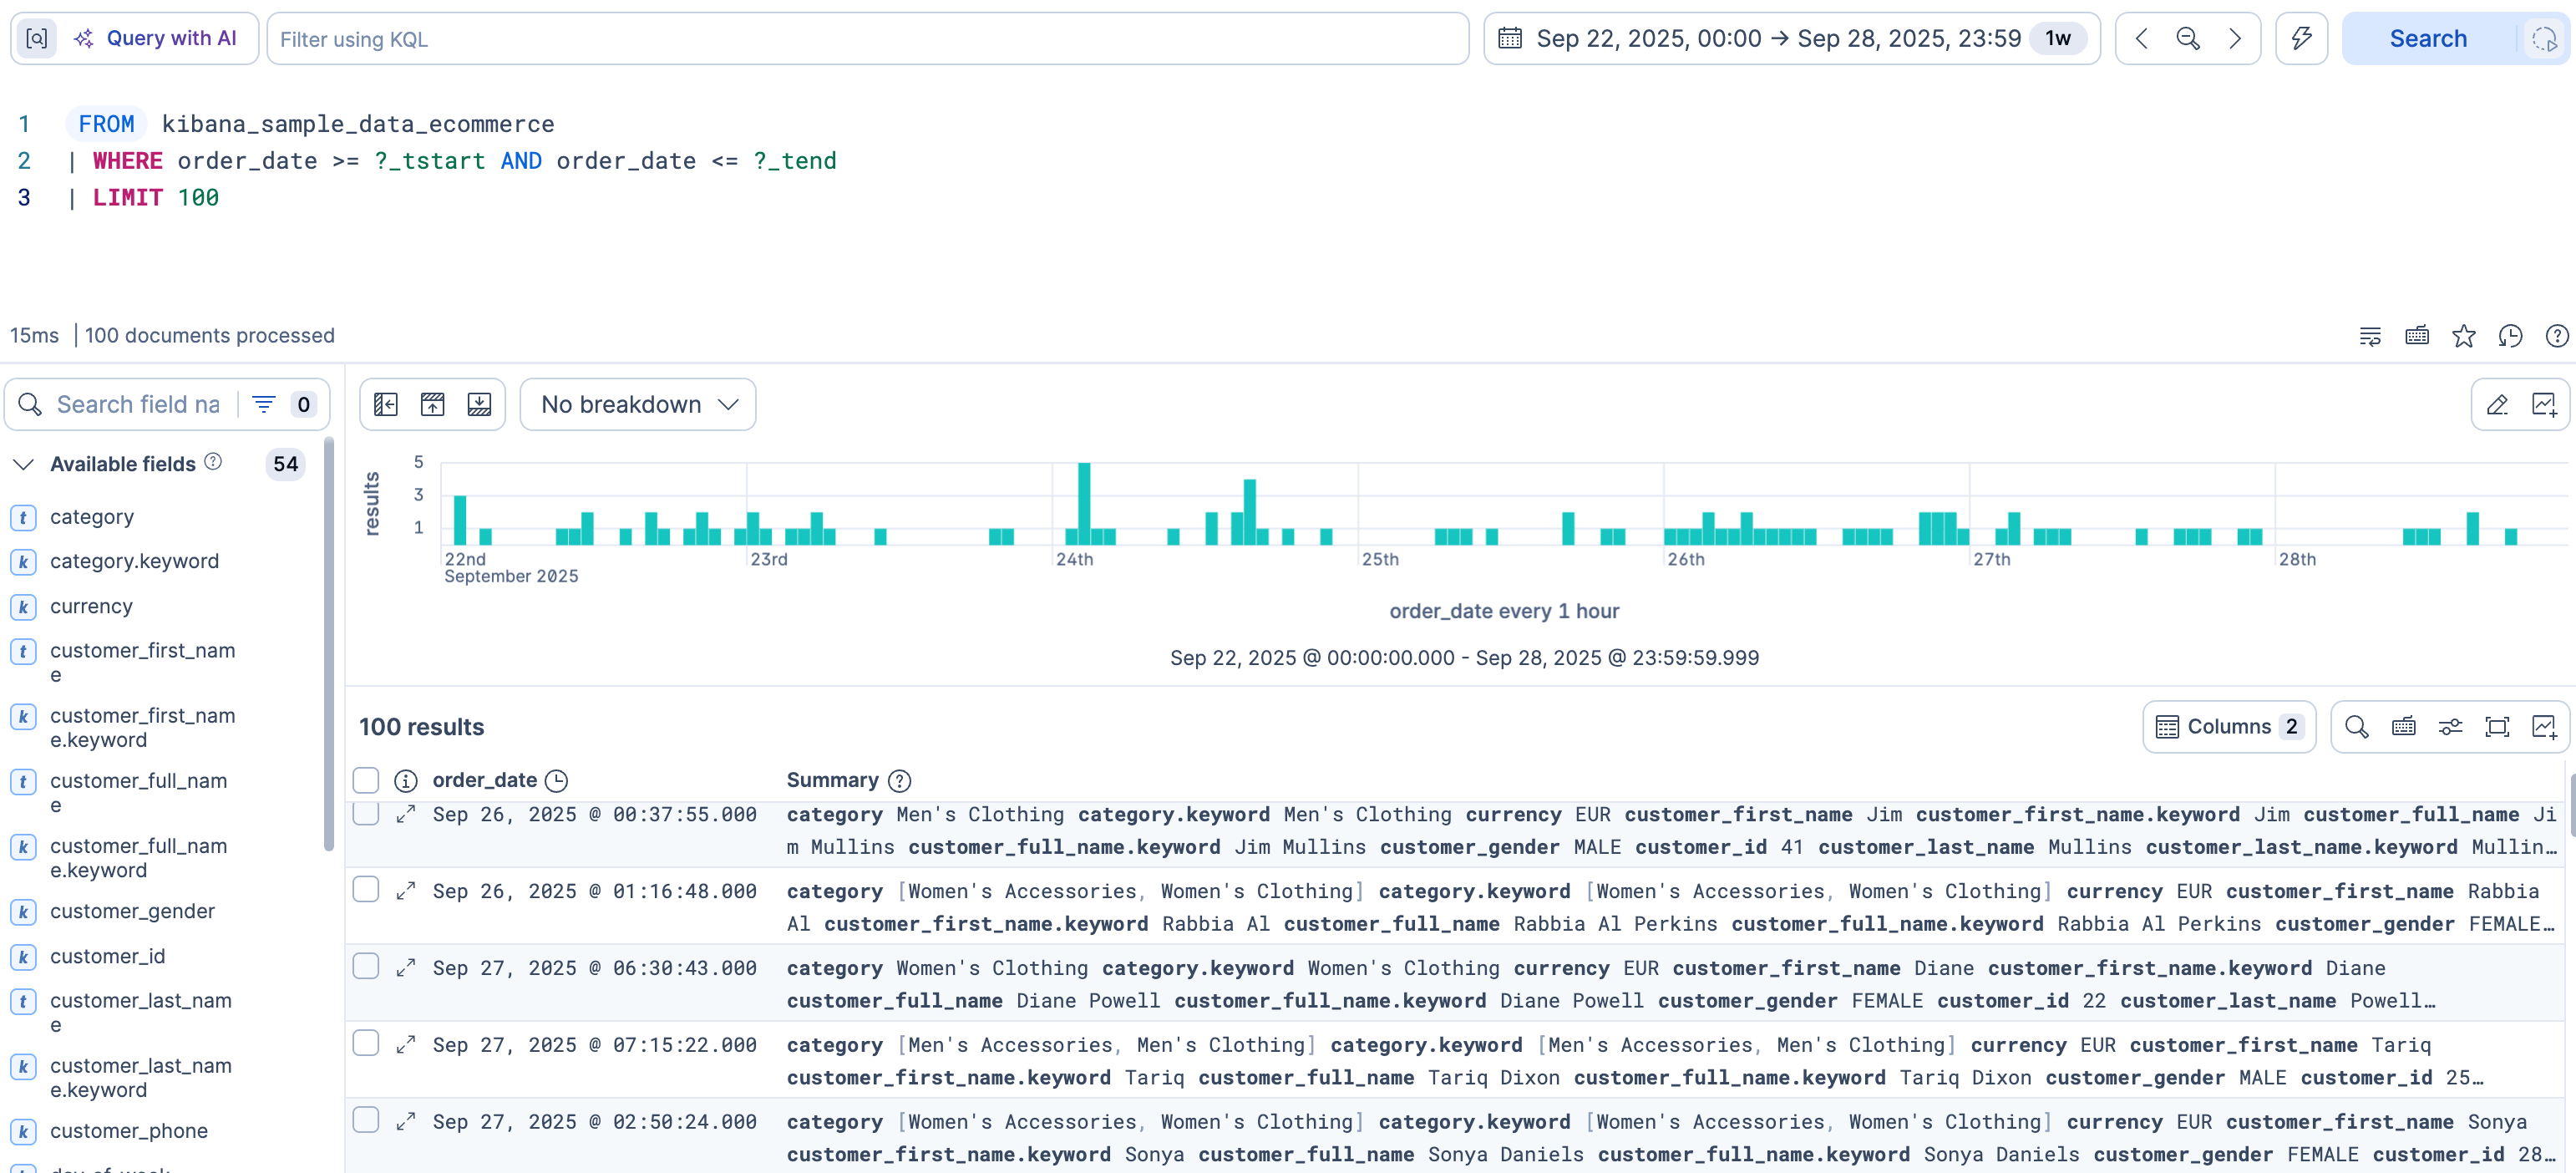
Result: The time filter sets the time range for that table and chart.
To keep the chart or the table, use one of these options:
- Save the Discover session. Save a Discover session for reuse explains the options.
-
Save the table to a dashboard. Customize the table explains how to configure it before you save it. - Save the chart to a dashboard. Change the chart type and display options explains how to configure it before you save it.