Create a Discover drilldown
A Discover drilldown opens Discover from a visualization panel and can carry the time range, filters, and query with it. Use one to read the documents behind a chart value.
For example, a Discover drilldown on a pie chart can open only the documents for the slice you select.
Refer to Drilldowns to choose a drilldown type.
To create a Discover drilldown, you need:
- All privilege for the Dashboard feature in Kibana
- An existing dashboard with at least one panel that supports drilldowns
The drilldown opens Discover from the panel itself.
The following panel types support Discover drilldowns:
Visualizations that use a data view
Visualizations based on an ES|QL query On ES|QL panels, Kibana turns the dashboard filters and the dashboard KQL or Lucene query into a
WHEREclause in the panel's ES|QL query. Discover then uses that same context. Kibana drops a filter when ES|QL cannot express it. The Explore in Discover panel action applies the same translation.
You can open a visualization panel in Discover without setting up a drilldown.
A drilldown is compatible only with indexed fields. Fields created at query time are not supported. Refer to Values that cannot open a drilldown.
This example opens Discover from a visualization panel. Follow it with the sample data, or use your own dashboard and data.
Add the Sample web logs data. This also adds the [Logs] Web Traffic dashboard.
Open that dashboard and select Edit.
Hover over the [Logs] Bytes distribution panel, open the panel menu, then select Create drilldown.
Select Open in Discover. In Name, enter
View bytes distribution in Discover. Open in new tab is already on. Turn it off to open Discover in the same tab. Select Create drilldown.Save the dashboard.
Drag across the bars to select a range of
bytesvalues, then select View bytes distribution in Discover.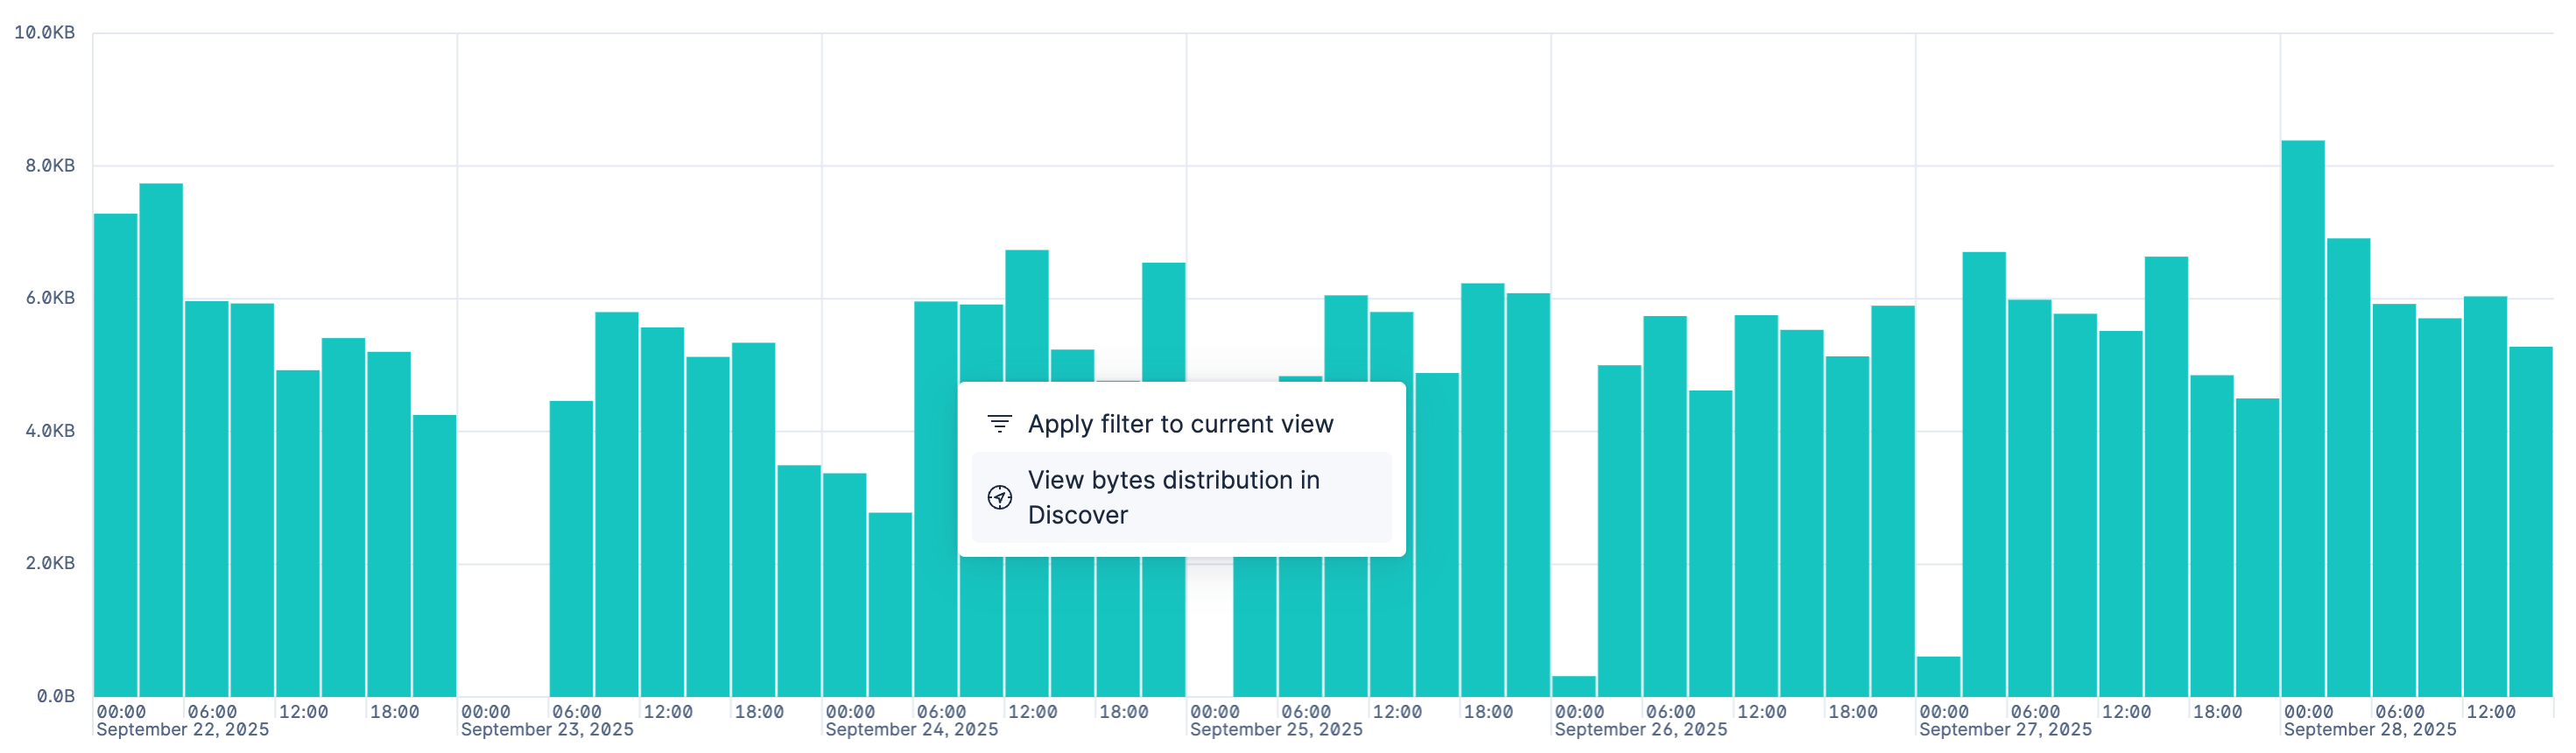
Discover opens in a new tab and shows the documents for the bytes range you selected. The dashboard time range, filters, and query stay in place.