OPEN SOURCE SEARCH, ANALYTICS, AND AI PLATFORM
Elasticsearch
Elasticsearch is an open source, distributed search and analytics engine built for speed, scale, and AI applications. As a retrieval platform, it stores structured, unstructured, and vector data in real time — delivering fast hybrid and vector search, powering observability and security analytics, and enabling AI-driven applications with high performance, accuracy, and relevance.
What makes Elasticsearch a search, analytics, and AI powerhouse?
It's because Elasticsearch is a …

Serious capabilities. Surprisingly simple.
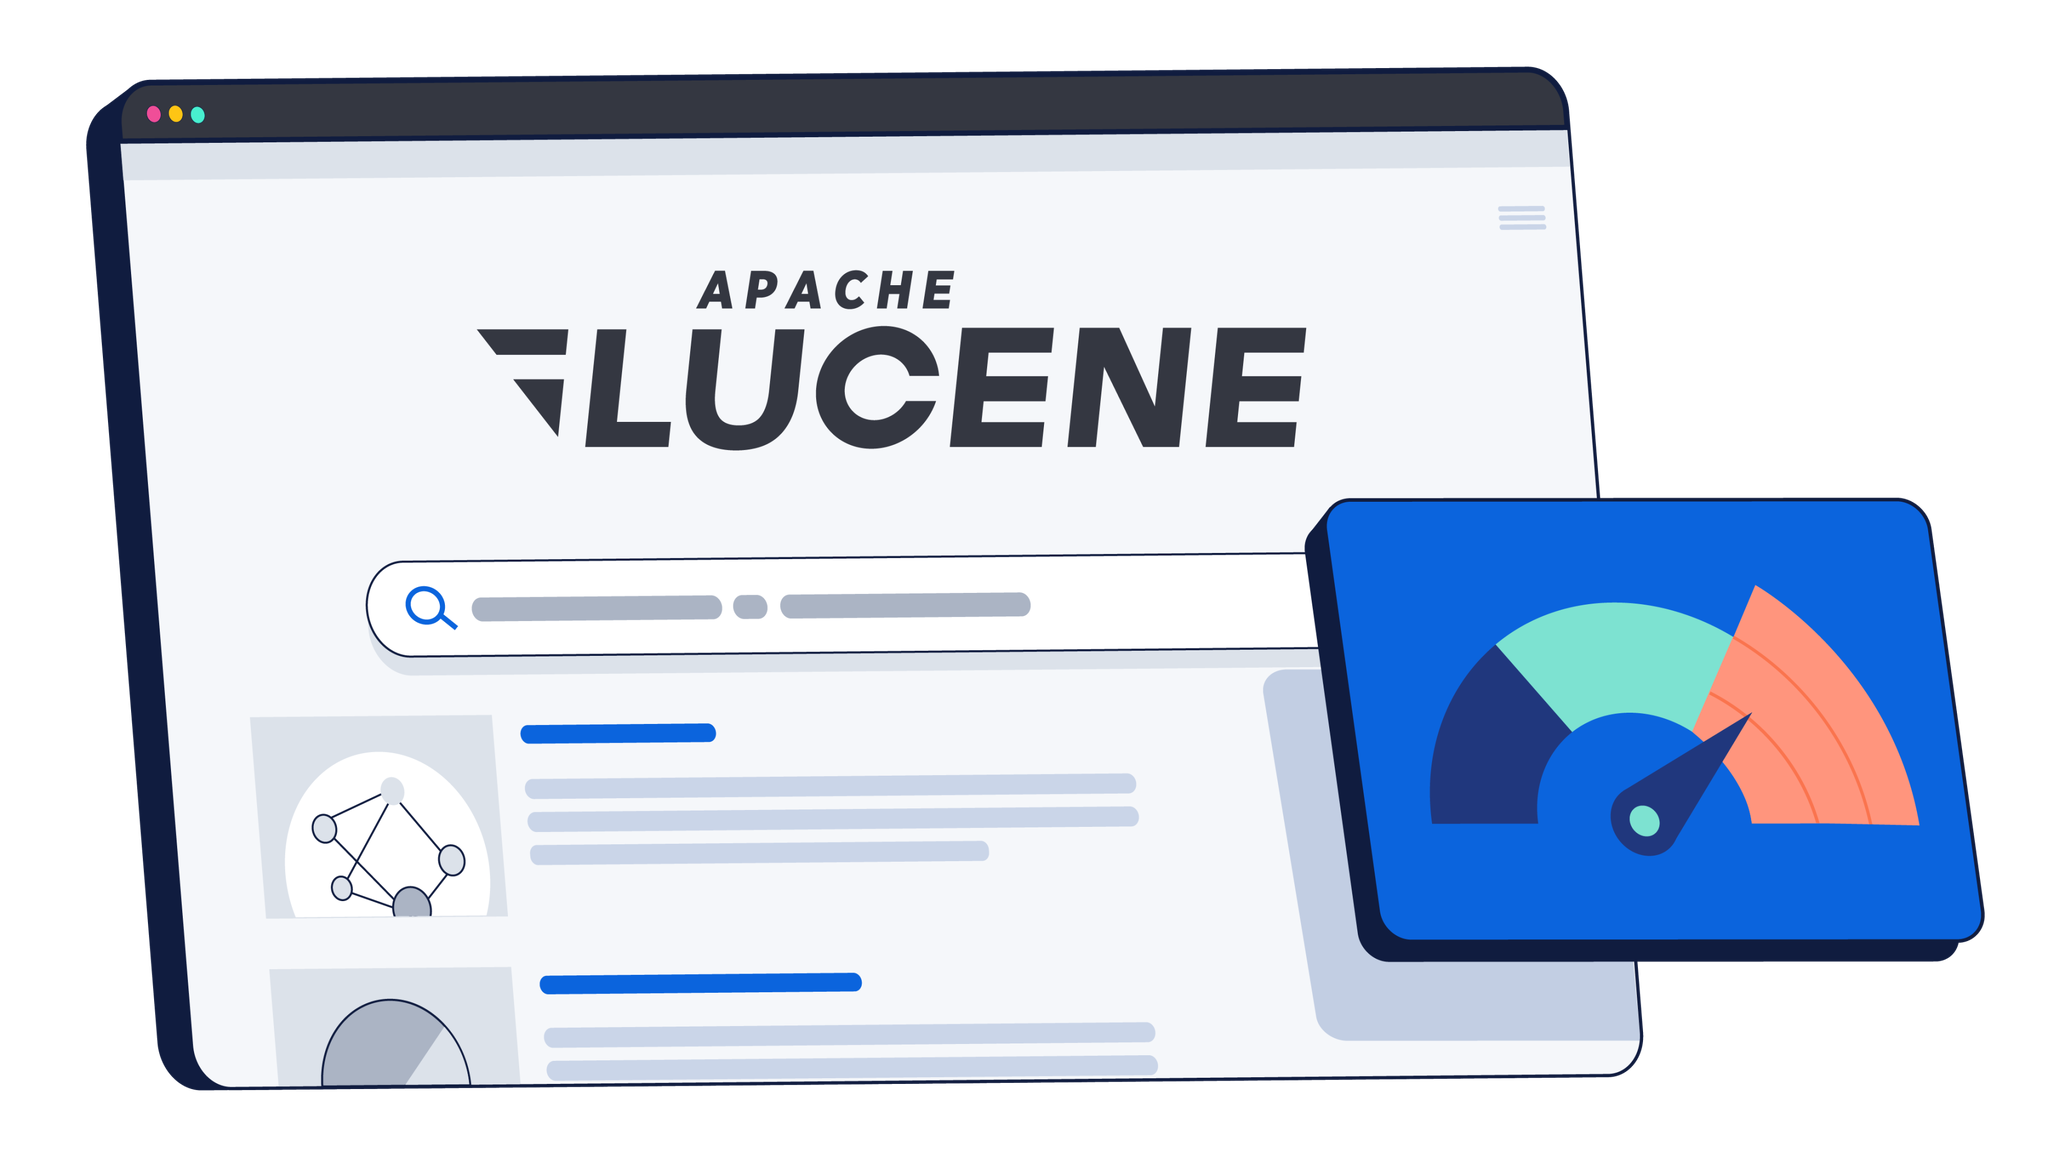

Lightning-fast search performance
Build search applicationsMillisecond-latency search, powered by Lucene. Instant answers, no matter how fast data moves.
Global distributed scalability
Scale effortlessly. Elasticsearch autoscales, rebalances, replicates, and powers through petabytes — with no downtime and no drama. Need global reach? Cross-cluster search delivers federated search without the fuss.
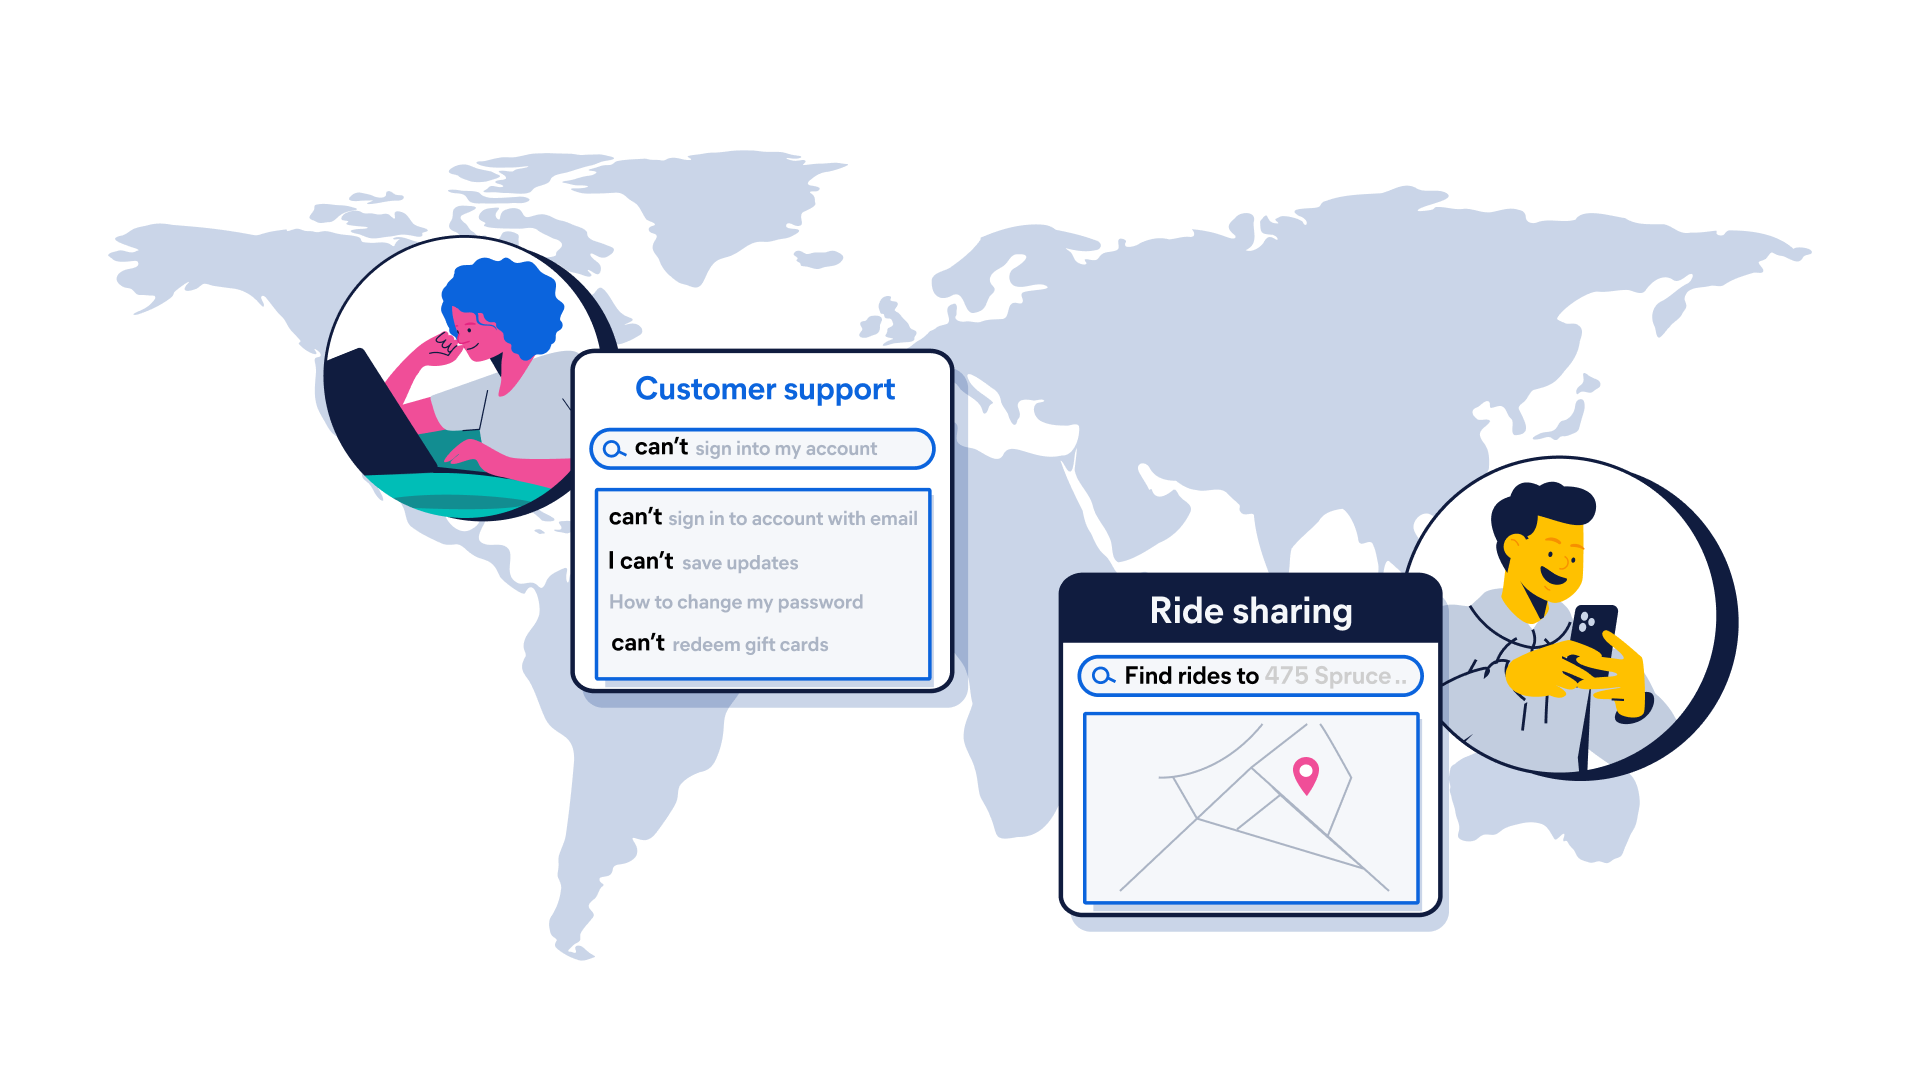
Versatile data and use case flexibility
Text? Timestamps? Vectors? Yes. One platform to do it all. From search to observability to security, Elasticsearch is built once and reused everywhere. Developed for whatever else your data dreams up.
From bare metal to serverless. It's your call.
From a laptop to a hundred‑node cluster, Elasticsearch works the same everywhere. On‑premises, in the cloud, or across clouds — we'll be there.
Elastic Cloud Serverless
Do less with serverless
Hassle-free operations with a fully managed serverless offering — the easiest way to ramp up search, observability, and security.
Elastic Cloud Hosted
Deploy hosted Elasticsearch and Kibana on AWS, Google Cloud, and Azure
Spin up a fully loaded deployment on the cloud provider you choose. As the company behind Elasticsearch, we bring our features and support to your Elastic clusters in the cloud.
On-Prem
Download Elasticsearch
Grab a fresh installation and start running Elasticsearch on your machine in just a few steps.
Build with a rich ecosystem and integrations
350+ integrations, endless flexibility. Elasticsearch meets your data where it lives — with APIs, language clients, and ingest pipelines that make it simple to connect, ship, and search from anywhere.


Code with the language you use today
Code it your way. Clients for Java, Python, GO, and much more — plus raw API access when you want it. Fast, easy, flexible, and designed to support your projects on Elasticsearch.


Get hands-on with Elasticsearch
Check out Elasticsearch Labs, the one-stop destination to learn how to build search experiences like GenAI, embedding models, reranking capabilities, and much more.
Securely store, analyze, and scale all data types — structured, unstructured, time-series, logs, events, geospatial, vectors, and more. No need to move data to a central location or refactor data to fit.
POST /my-index/_doc/1
{ "timestamp": "2025-02-19T14:30:00Z", "log_level": "ERROR", "message": "Unauthorized access attempt detected", "event_id": "abc123xyz", "user": { "id": "user_456", "username": "jdoe", "ip_address": "192.168.1.100" }, "geo": { "lat": 39.7392, "lon": -104.9903, "city": "Denver", "region": "Colorado", "country": "US" }, "http": { "method": "POST", "url": "/admin/login", "status_code": 401, "user_agent": "Mozilla/5.0 (Windows NT 10.0; Win64; x64)" }, "security": { "alert_type": "Failed Login", "severity": "high", "action_taken": "Blocked IP", "detection_engine": "SIEM" }, "server": { "hostname": "webserver-01", "environment": "production" } } }
Text? Timestamps? Vectors? Yes.
Elasticsearch powers search, observability, and security all from one platform — built once, reused everywhere. With flexible APIs for AI search, vector retrieval, and more, it delivers fast results at any scale.
Built for builders
Developers like you are powering the next-gen search AI apps that scale anywhere with Elastic.
Customer spotlight

Chat Leap uses Elastic to power global campaigns reaching millions of customers for everything from Black Friday sales to global sporting events.
Customer spotlight

Brolly greatly streamlined its entire incident management with Elastic Observability.
Customer spotlight

Lawrence Livermore National Laboratory maximizes its HPC system availability for ground-breaking national security and scientific research with Elastic Security.
Join the neighborhood
Explore what other developers are doing with Elasticsearch, ask questions, and get help when you get stuck.

Dive into Elastic forums — discuss, learn, teach, troubleshoot, and explore with the global community.

Slack off the right way — join the Elastic Slack channel and stay connected with fellow search ninjas.