Elastic Maps
An open source exploration of location data
Analyze your geospatial data with Elastic Maps. Visualize multiple indices as unique layers in one view to query and correlate across all of your Elasticsearch data.
Take a tour of Elastic Maps for geospatial analysis on your Elasticsearch data.
Watch videoSpot potential security anomalies such as irregular latency with Elastic Uptime and more.
Watch videoBecome an Elastic Certified Engineer to grow opportunities as you work with Elasticsearch.
Learn morePutting geo on the map
"Where" is a critical question for many users of the Elastic Stack. Whether you're protecting your network from attackers, investigating slow application response times in specific locations, or simply hailing a ride home, geo data — and search — play an important role. The open source Maps app in Kibana gives you an intuitive way to weave geospatial layers in with your temporal, structured, text, and other Elasticsearch data so you can ask (and answer) meaningful questions.
The Nature Conservancy monitors the security of their network across offices and outposts (with limited connectivity) around the globe.
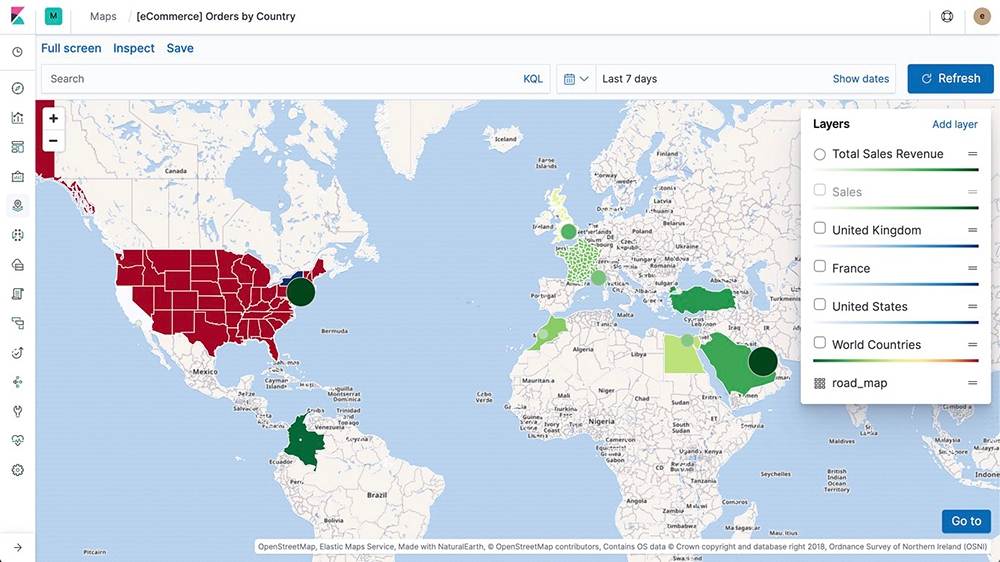
Multiple sources, one map
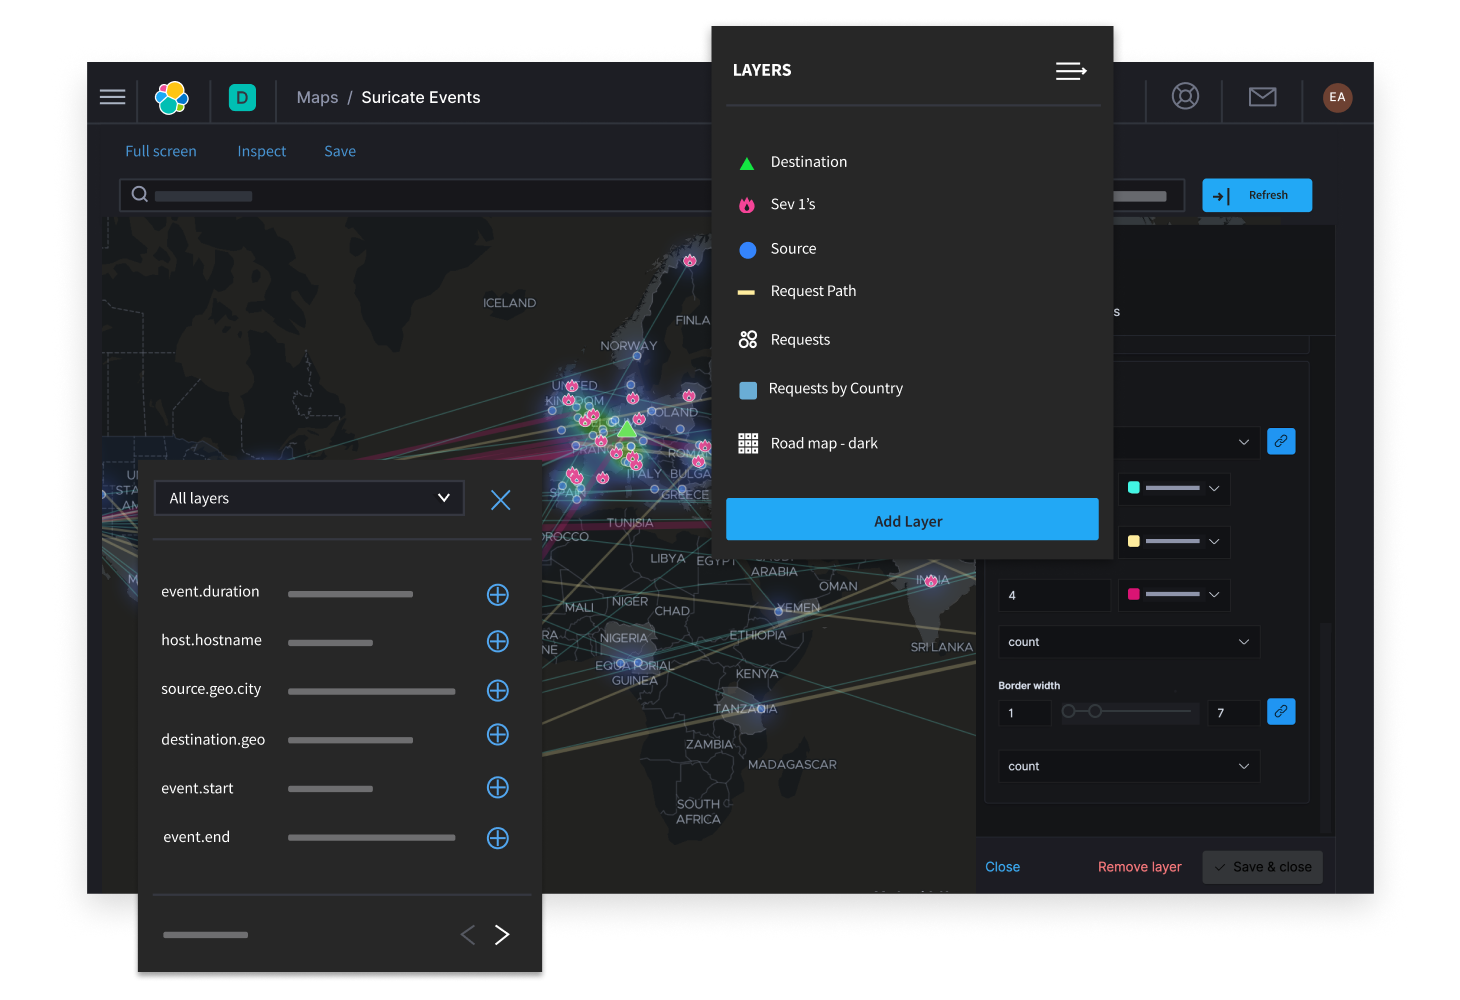
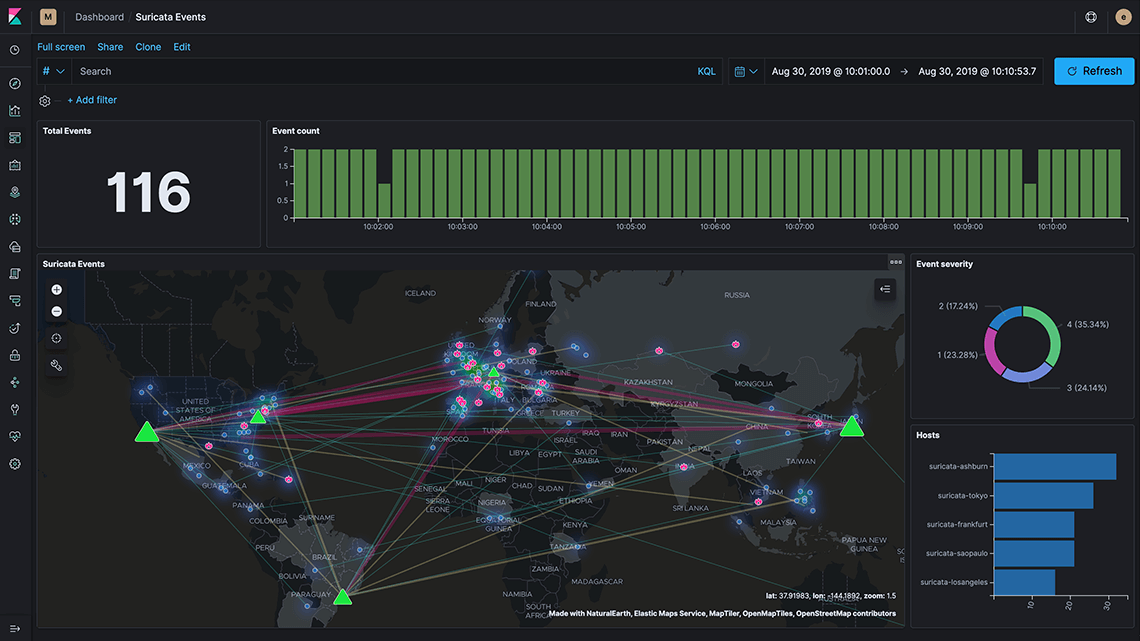
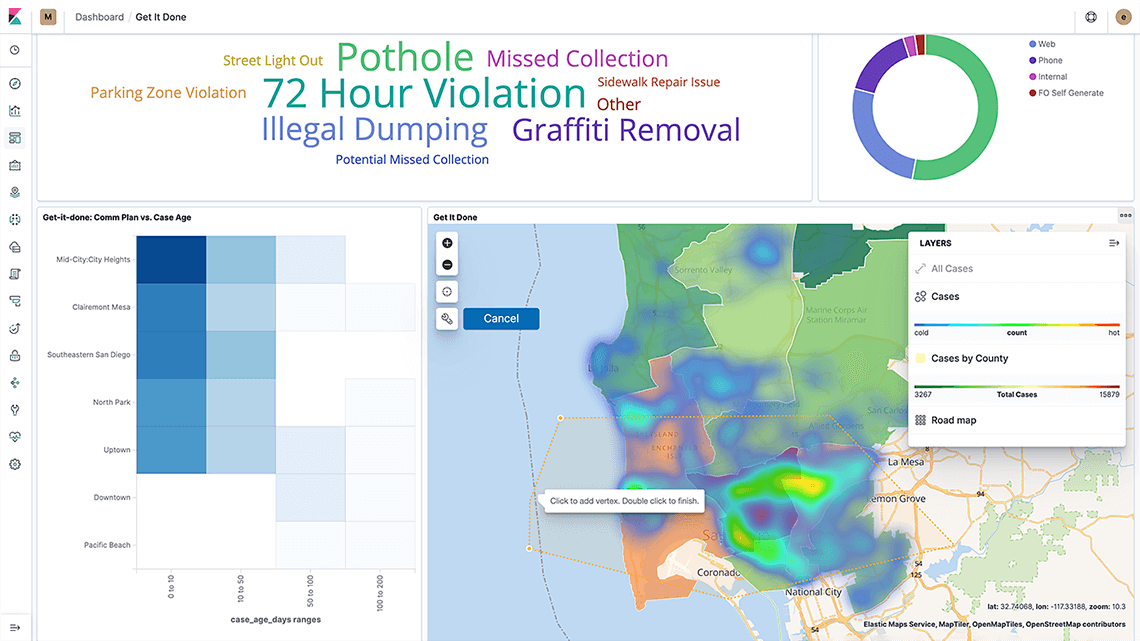
Drop layers from unique indices into one view using the Maps app in Kibana. And since the layers from your various indices are on the same map, you can search and filter across all of them in real time. Monitor static server locations alongside dynamic attack locations in the same view in your SOC. When you spot something interesting, zoom in and drill down on granular details like individual documents on the map.
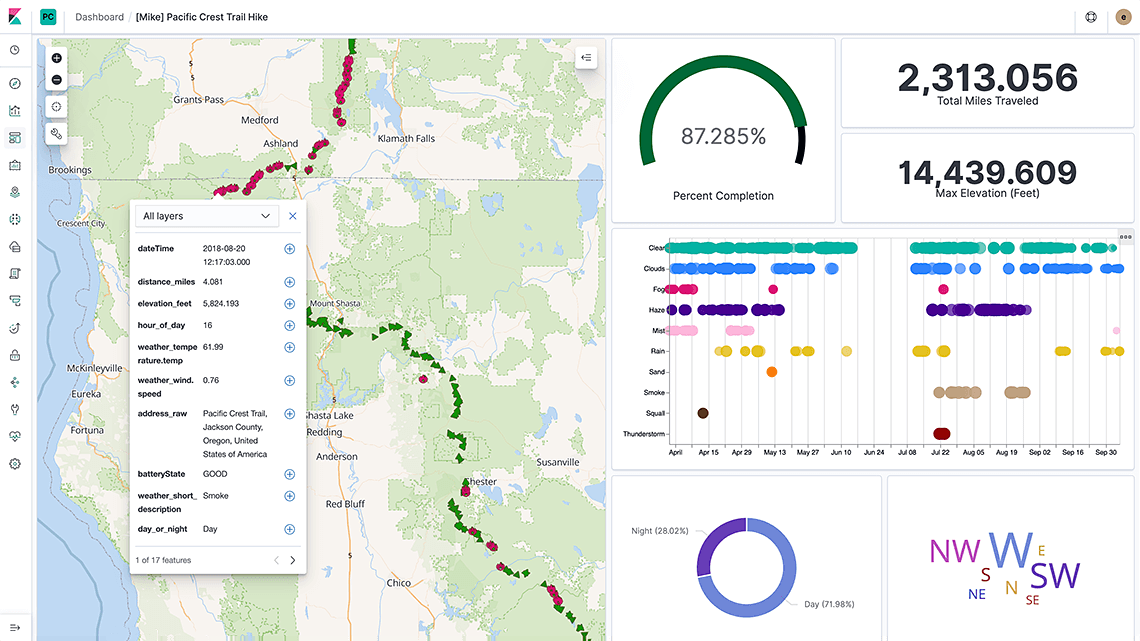
More than just geo
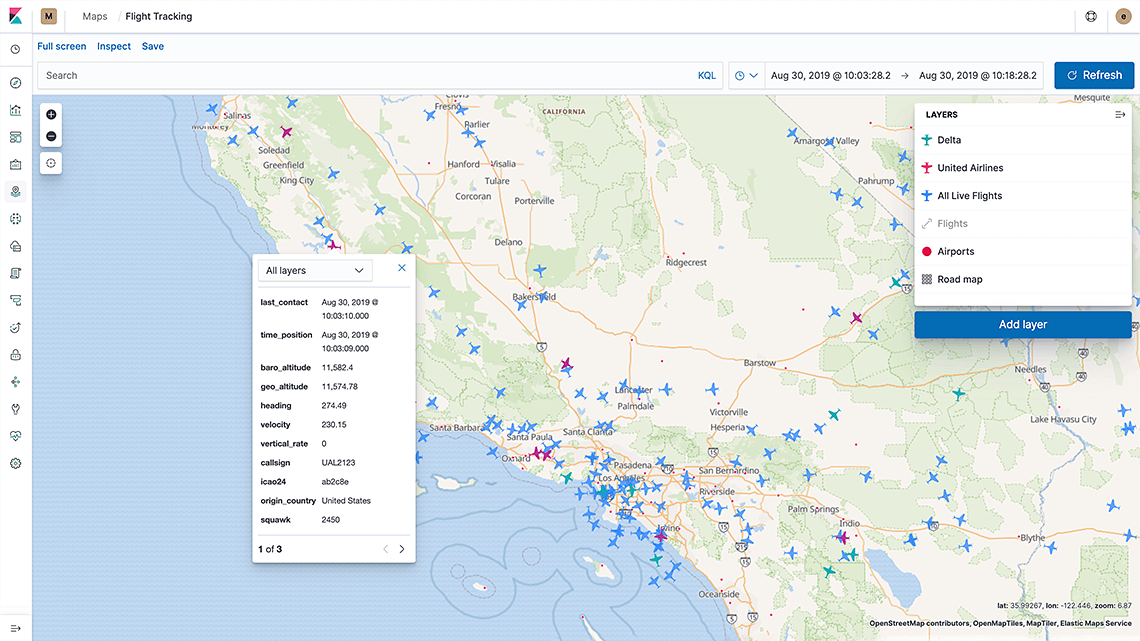
Geographical data is more than latitudes and longitudes. Each pin on the map may contain metrics, a timestamp, and additional metadata. Elasticsearch is a great store for all kinds of location data — from geopoints to geoshapes like polygons, circles, lines, multi-lines, and boxes. And as a full-text search engine, a columnar store, and a metrics store for all types of numeric data, Elasticsearch also serves your analysis needs beyond just geo.
Boundless analysis, quick answers
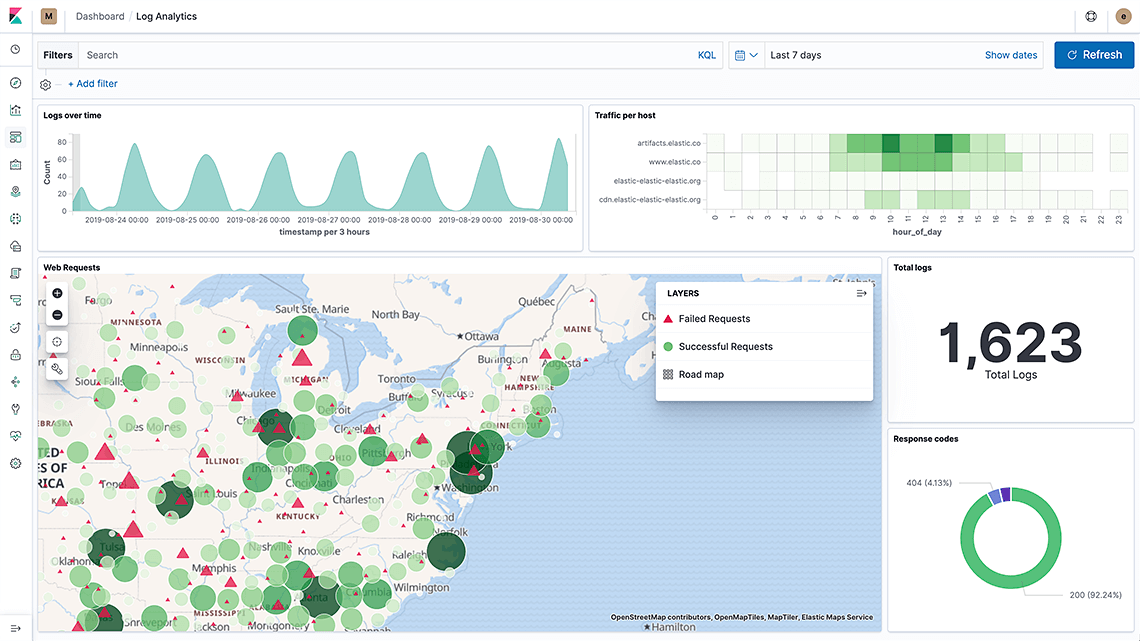
The Elastic Stack joins speed with scale, relevance, and dynamic visualizations — bringing powerful analysis options to your geo data. Embed maps into your Kibana dashboards, and interact with your location data alongside everything else. Mix in geo queries, like sorting by distance and filtering by bounding shapes, with other numerical and text queries to analyze your data in a single dashboard.
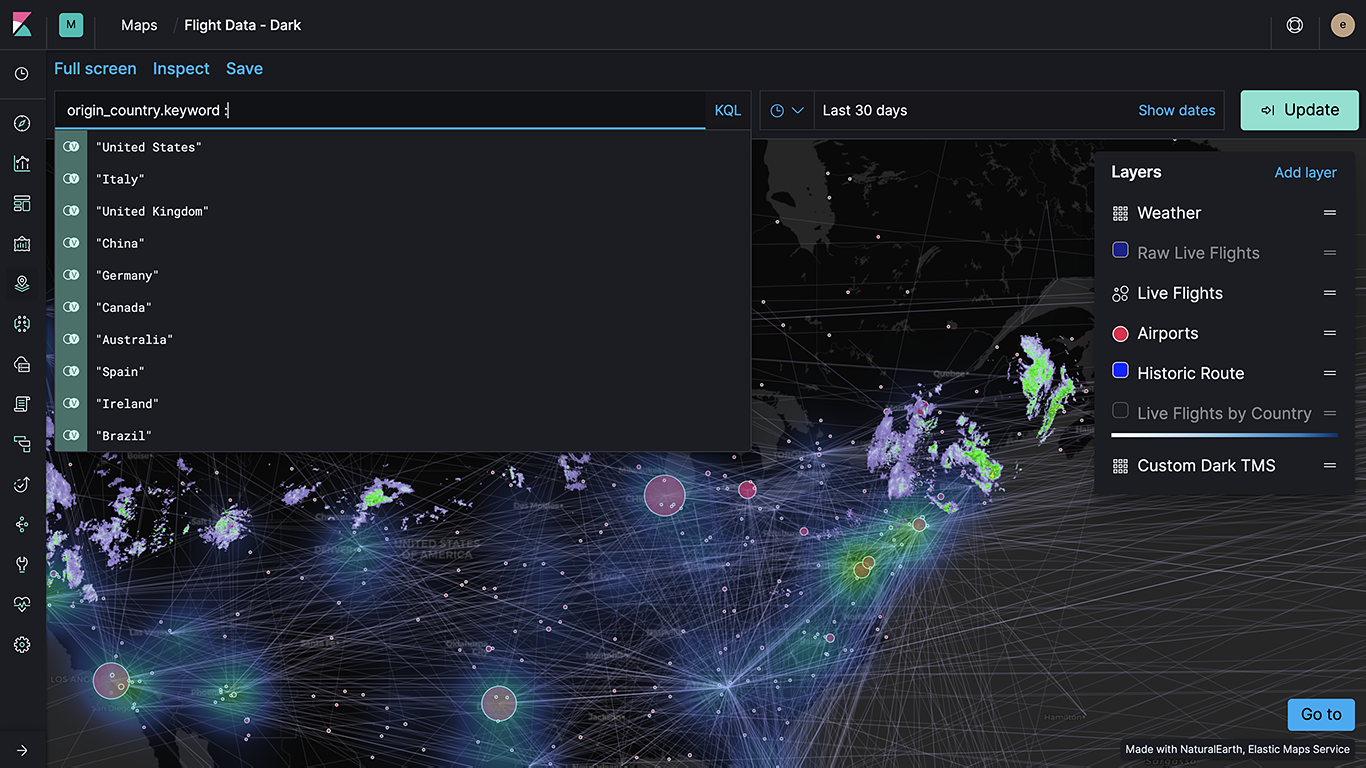
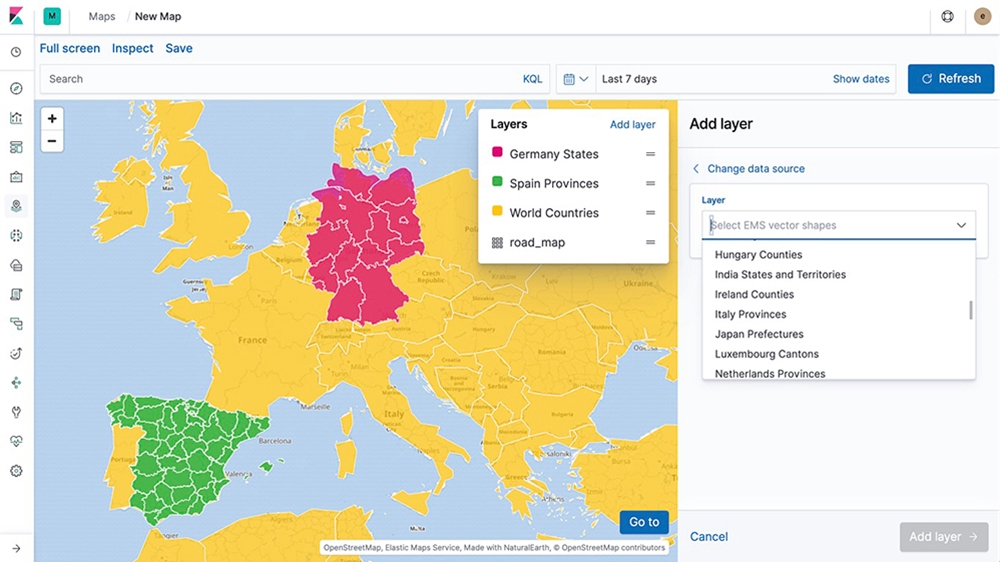
Out-of-the-box maps
Start with the layers, vector shapes, and basemaps provided by the Elastic Maps Service. Watch your data take form on the map in real time with detailed vector shapes, then dial in on areas of interest with 18 zoom levels that go down to street level. Looking for more options? Create custom layers, use dynamic client-side styling, and more with the Elastic Maps app.
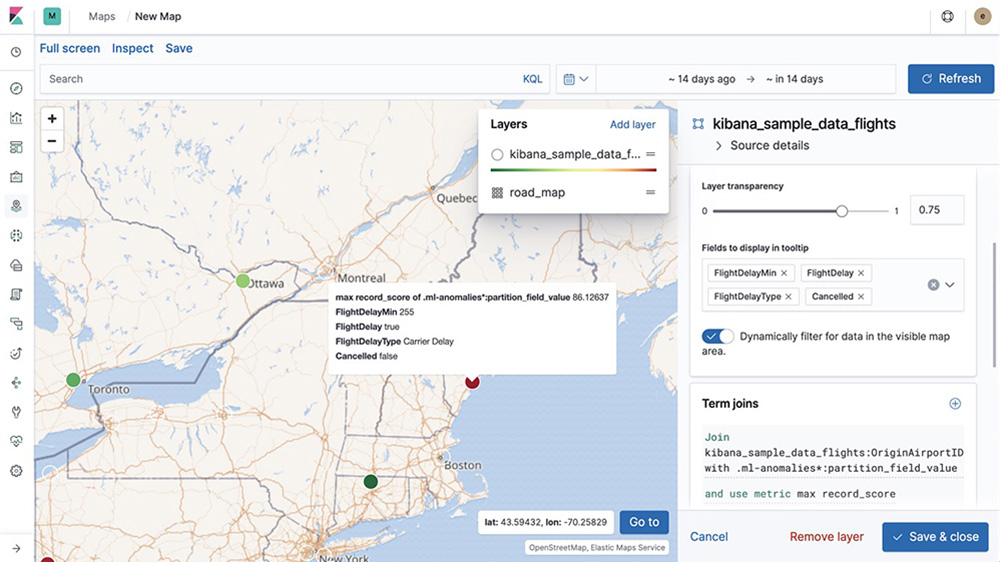
Machine learning
Find anomalies in your geo data. Spot inconsistencies by location, dive into issues, and discover root causes.
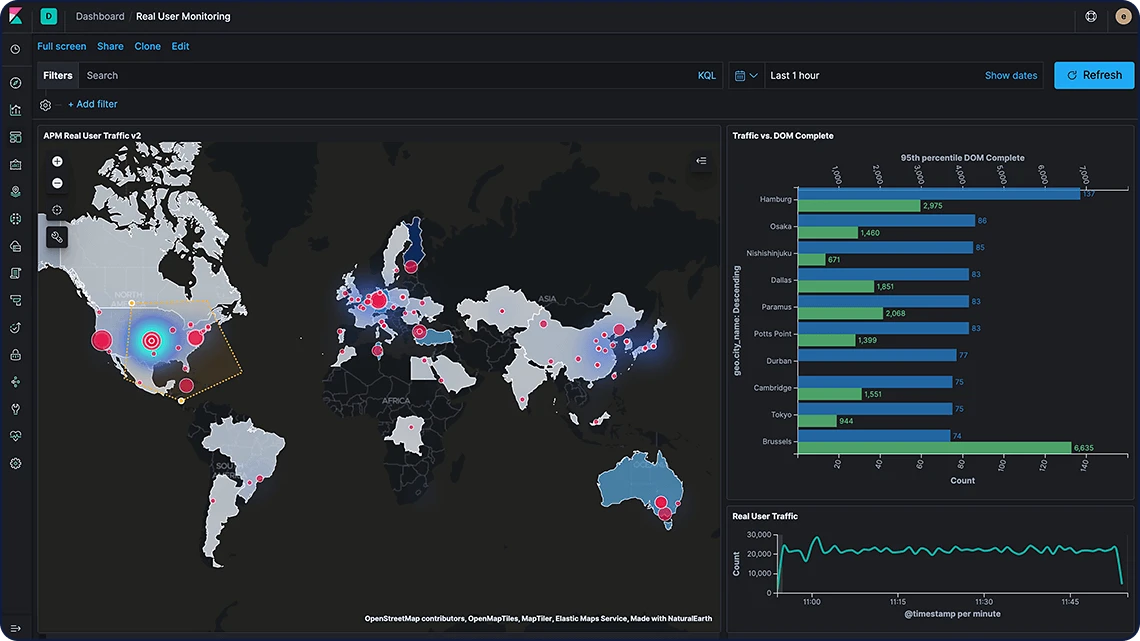
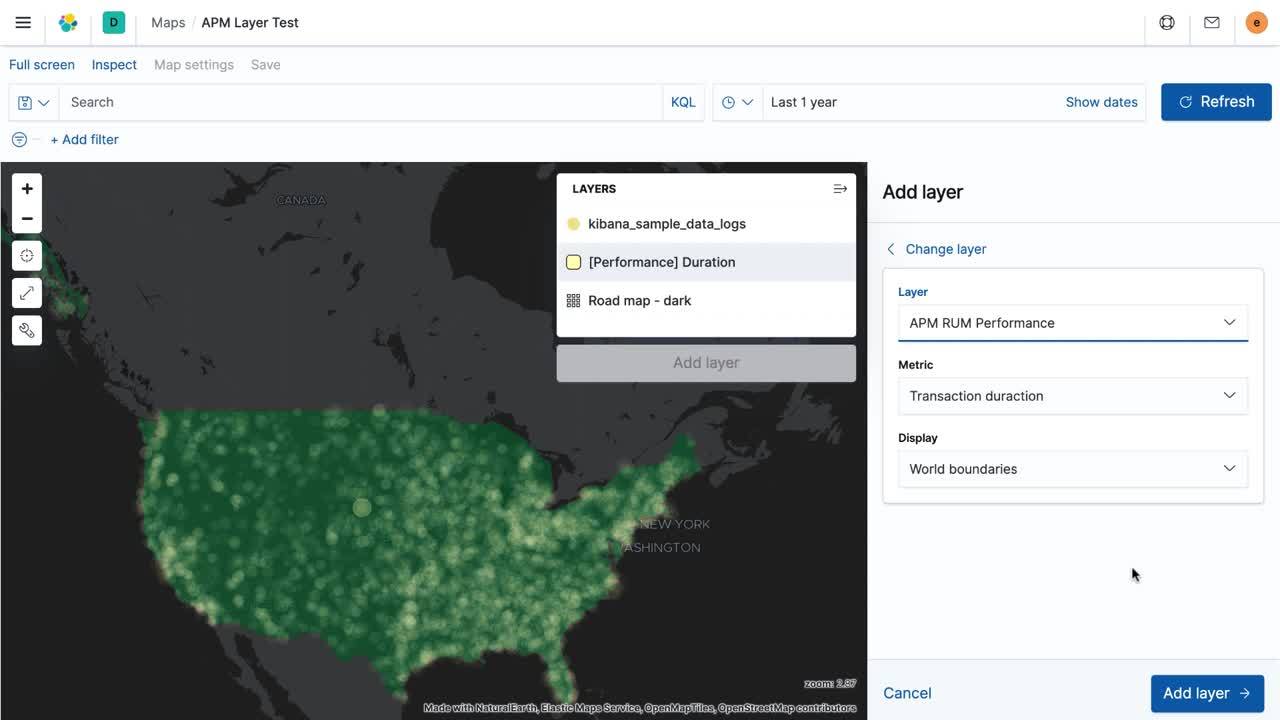
Built-in layers to fit your use cases
With solution-based layers available natively in Elastic Maps, you can build the perfect geoanalysis in a fraction of the time. From real user monitoring (RUM) for APM use cases to network traffic for security scenarios, Elastic Maps has out-of-the-box options to support your needs.
Built-in layers to fit your use cases
Finding a ride with Uber
Discover how Uber uses Elastic to handle more than 1,000 queries per second, supporting multiple use cases at the transportation company.

Geo is just one layer of your data
Have metrics? Proxy or firewall logs? Documents with tons of text? Centralize it all into the Elastic Stack to enrich your analyses, lower operational costs, and simplify your architecture.