
Jeffrey Rengifo
Engineering, Consulting
Jeffrey Rengifo is a software developer focusing on improving search experiences using Elasticsearch. He specializes in GenAI and aims to innovate by creating new tools to help optimize different processes and solve everyday problems.
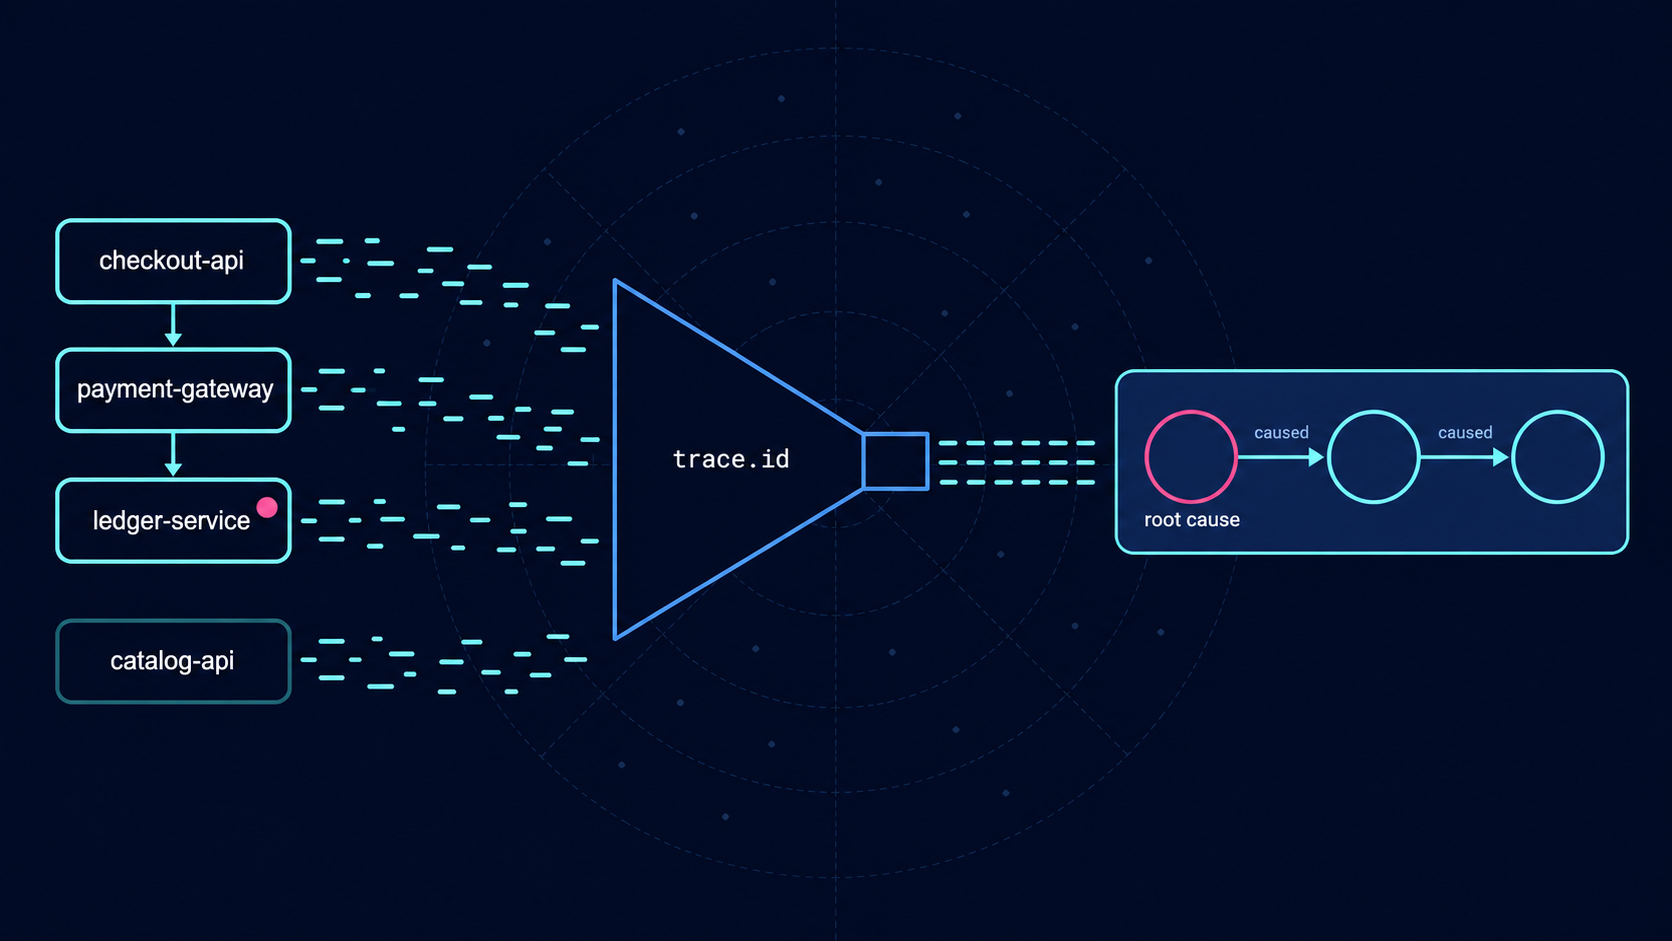
The service with the most errors was healthy: root cause analysis from logs with ES|QL
Metrics ranked three services identically at 19.1%. Four ES|QL queries over the same 4,688 OpenTelemetry log records traced 955 of 956 failure chains back to one of them, and needed no service dependency model to do it.
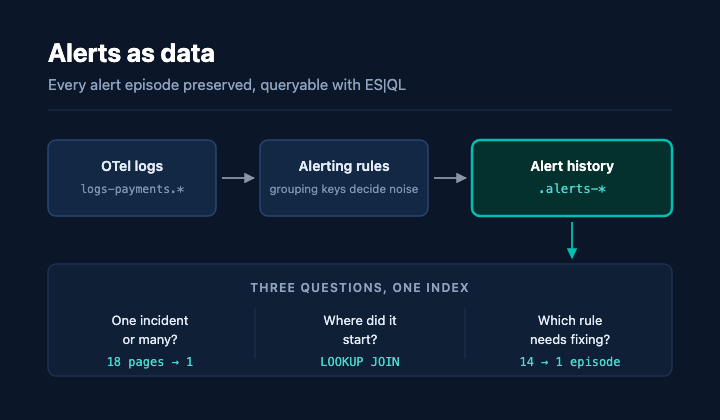
14 alerts, 1 incident: Measuring alerting rule noise with ES|QL in Elasticsearch
Grouping keys decide how many alerts one incident produces, and because Kibana stamps every alert document with a rule revision, you can measure your alert noise reduction against the same incident that caused the alerts in the first place.
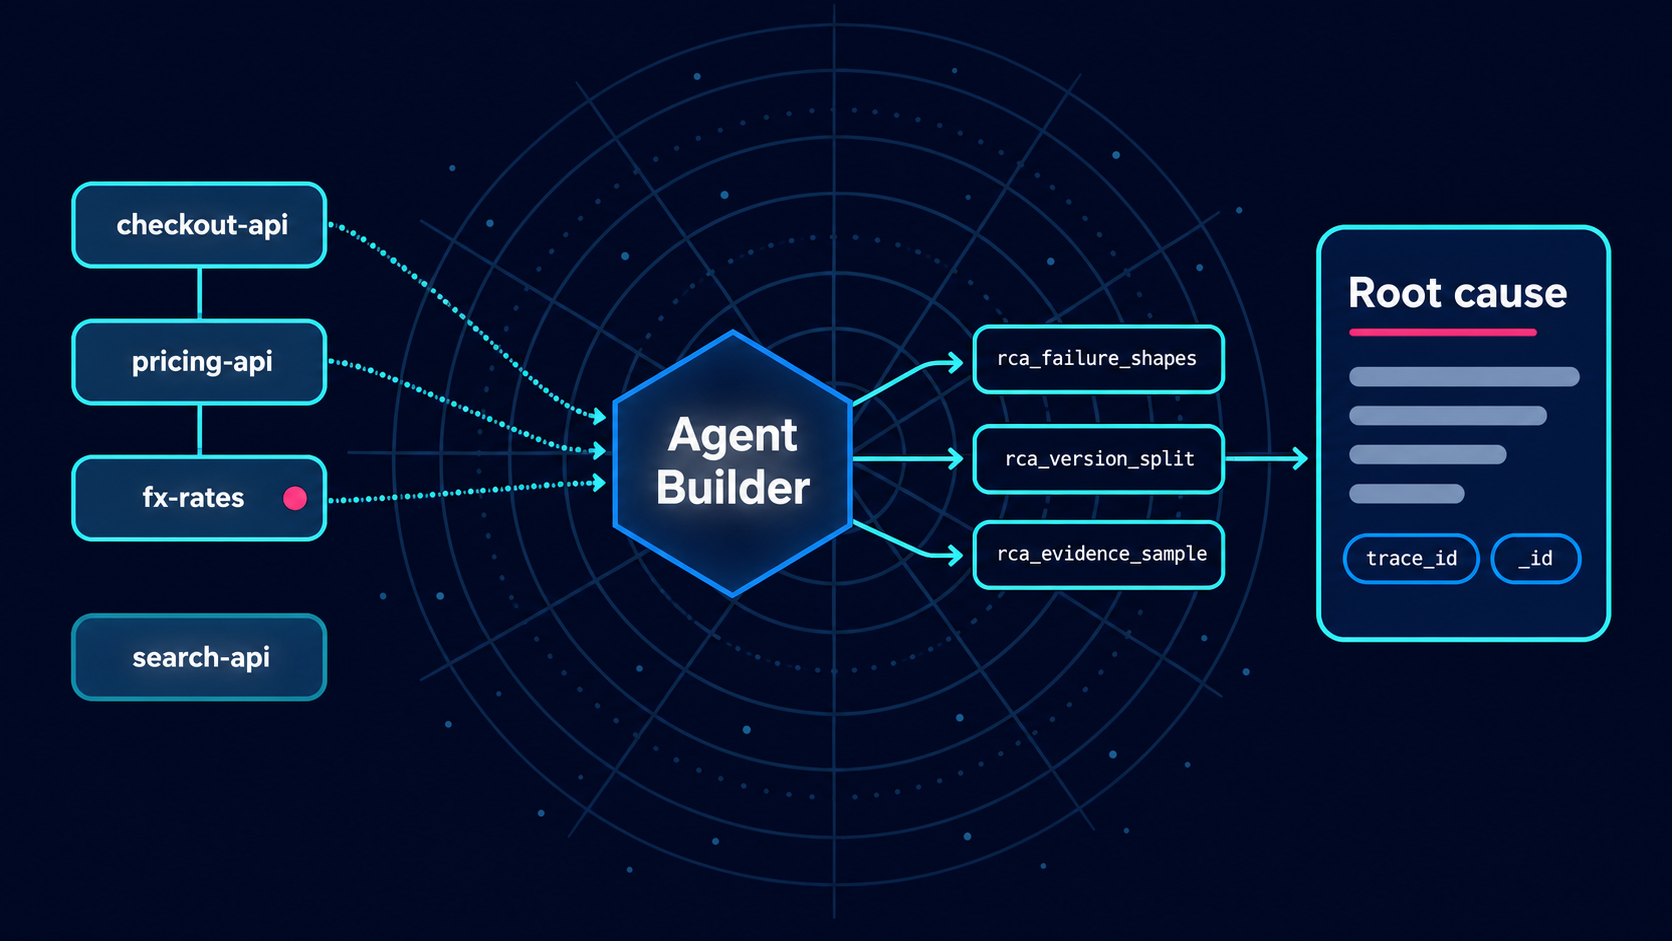
AI root cause analysis in Elastic Agent Builder that cites its evidence
The new release failed at 27.2%, the old one at 28.2%, so the deploy was never the cause; the agent worked that out in 72 seconds and handed back a trace ID for the failure that was.
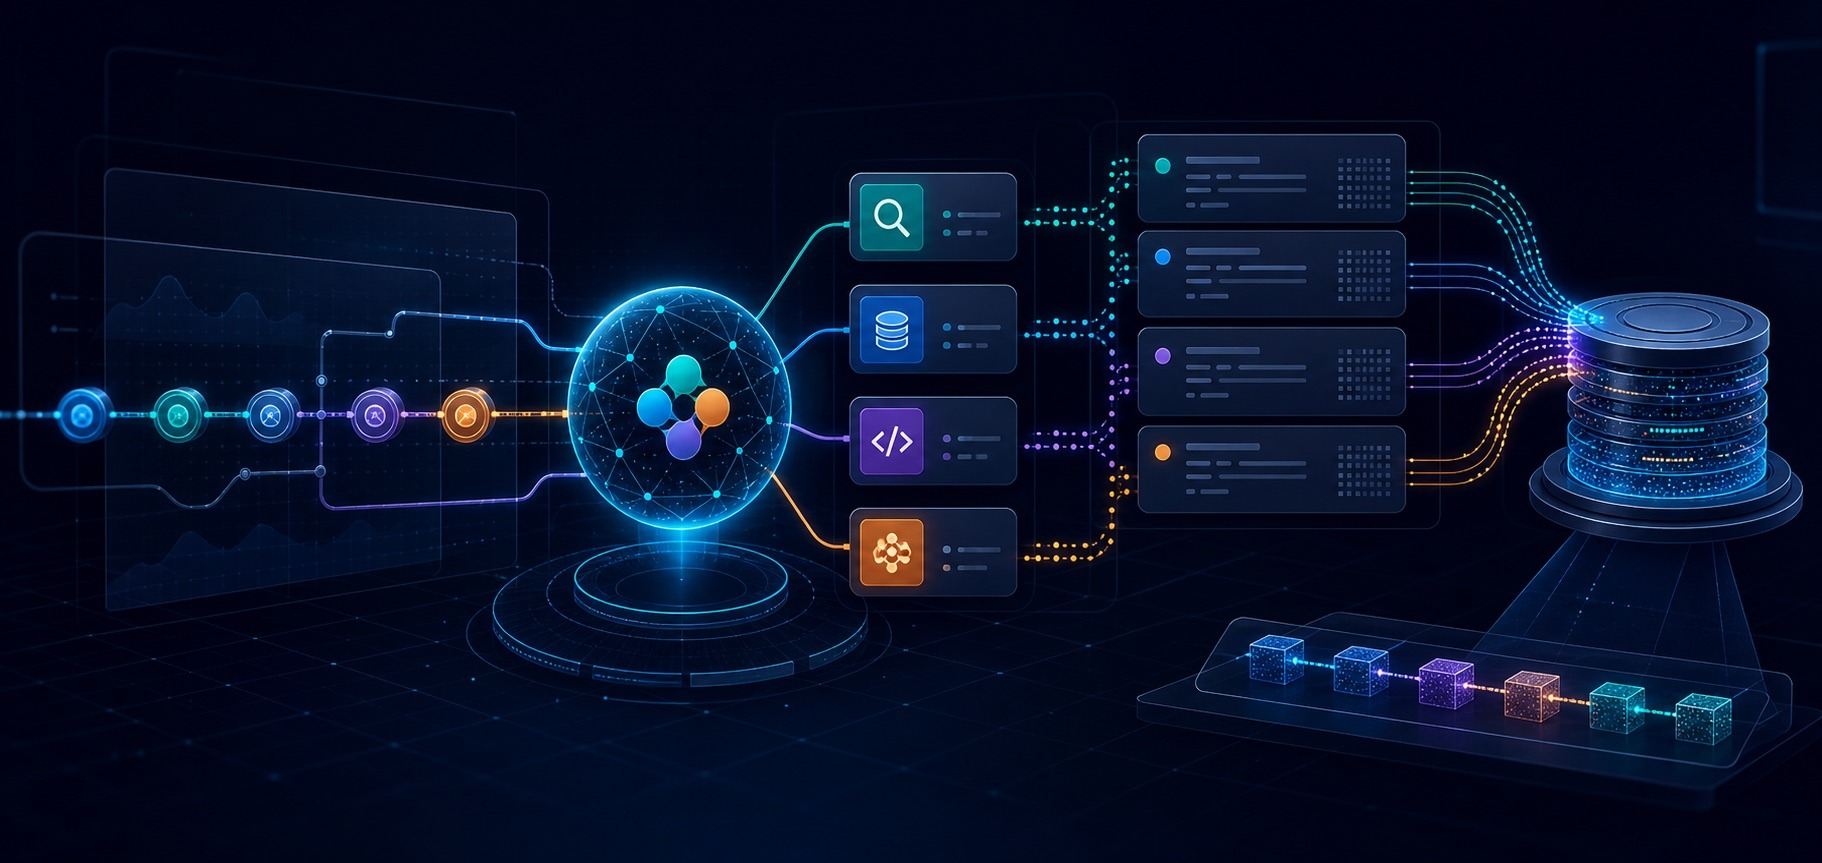
Your AI agent needs an alibi: Observability and audit trails for Agent Builder in Elastic
Elastic 9.5 traces every Agent Builder run as OpenTelemetry spans in your own cluster, so tool calls and token counts are queryable with ES|QL. One workflow step adds the approval record, in a data stream the pipeline cannot rewrite.
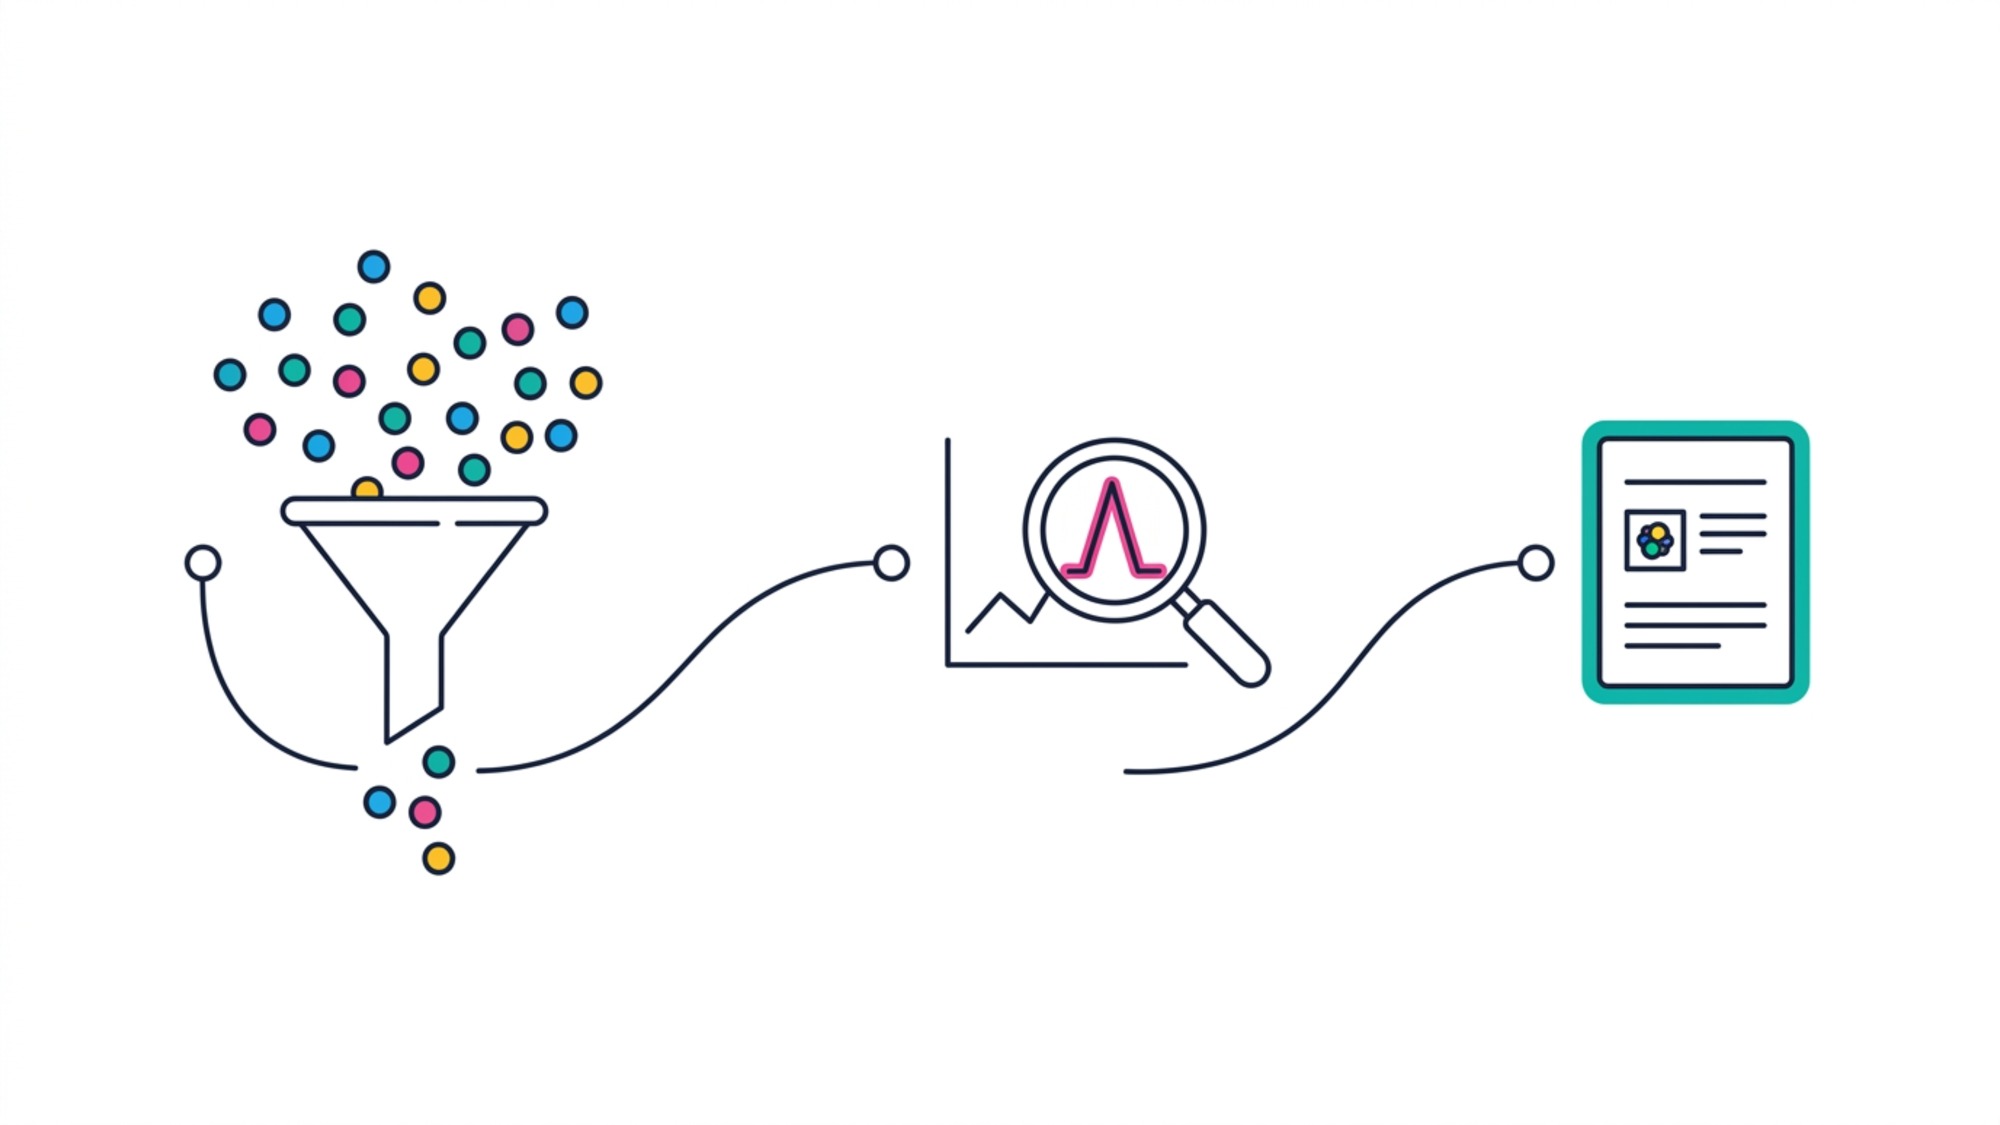
From a 582ms latency spike to the team that owns it, using Kibana Discover
Getting there takes a data view, some filter pills, a KQL query and a switch to Lucene query syntax, but the part that actually names the team is one ES|QL LOOKUP JOIN against a service catalog index.
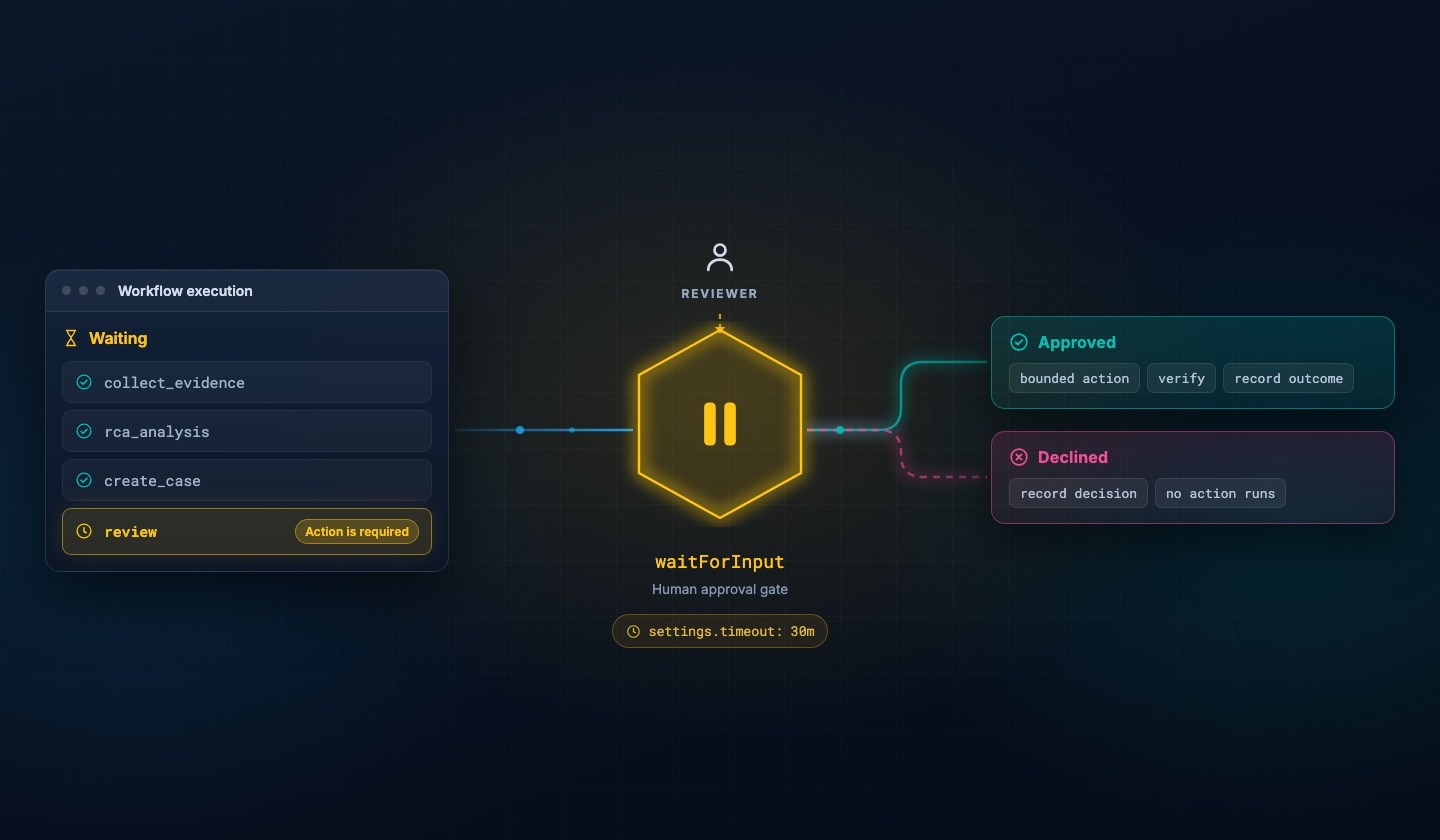
From recommendation to remediation in 4 stages: human-in-the-loop automation with Elastic Workflows
An approval gate that pauses incident response automation before the action and gives the reviewer enough evidence to decide in seconds. Whatever happens next, approved or declined, lands in one auditable record.
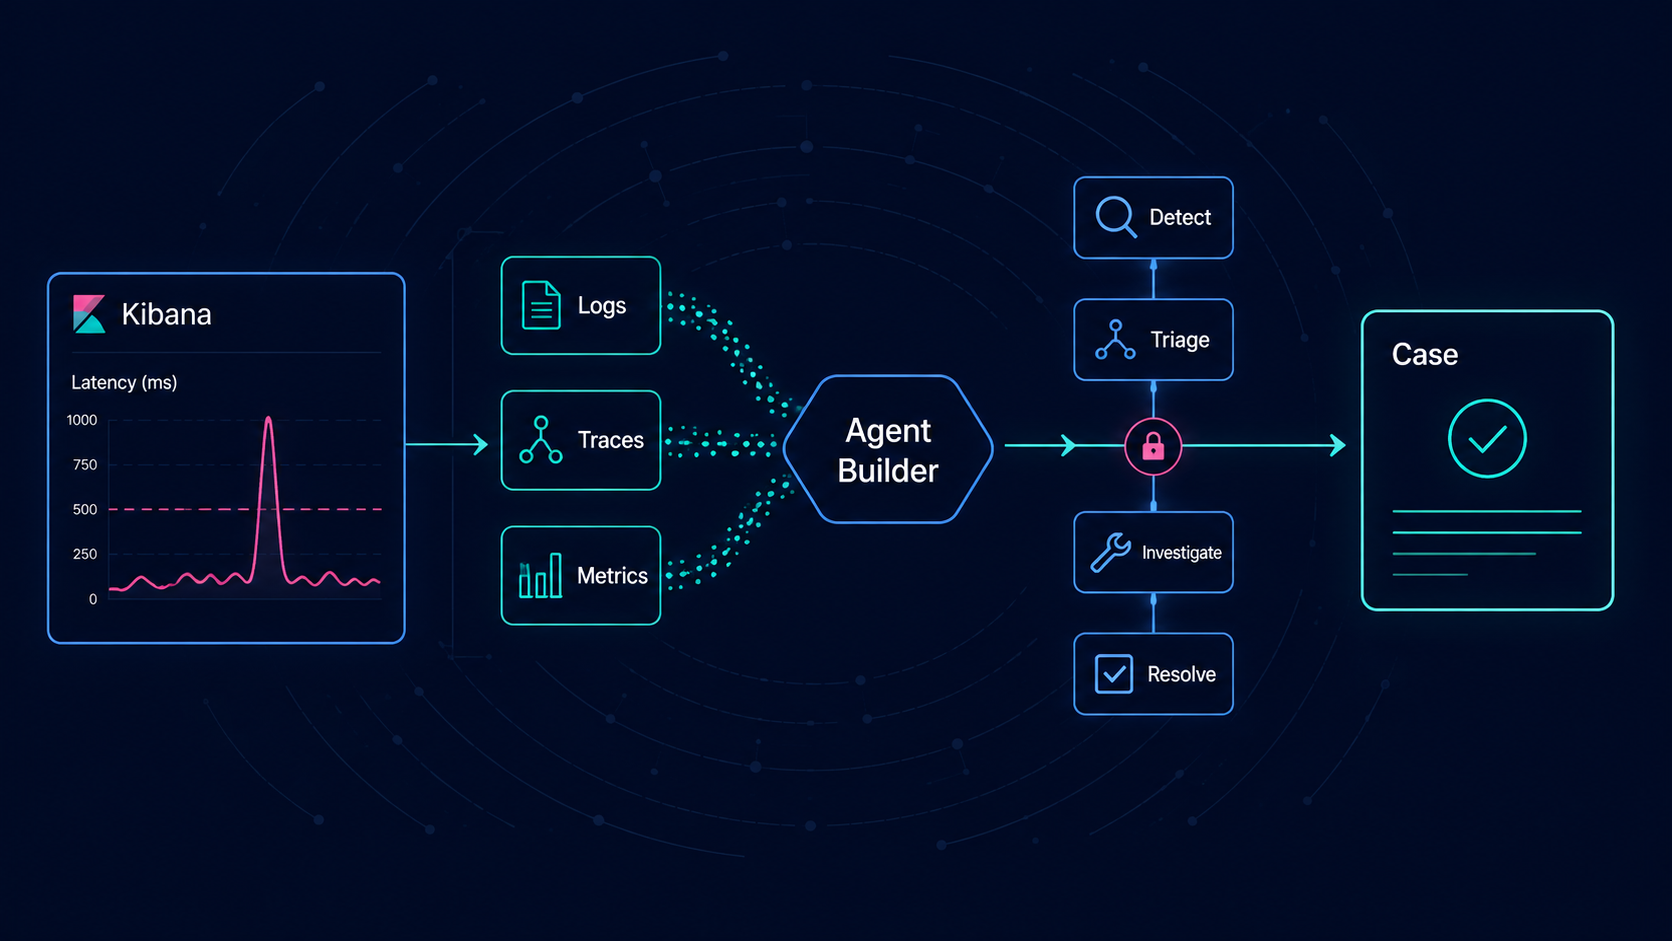
From alert to root cause in 3 minutes: automated root cause analysis with Elastic Agent Builder
Automated root cause analysis only works if the agent compares the incident window against the last healthy one. Skip that step and you get a summariser. The read-only skill, the scoped role and the Elastic Workflow are all here.
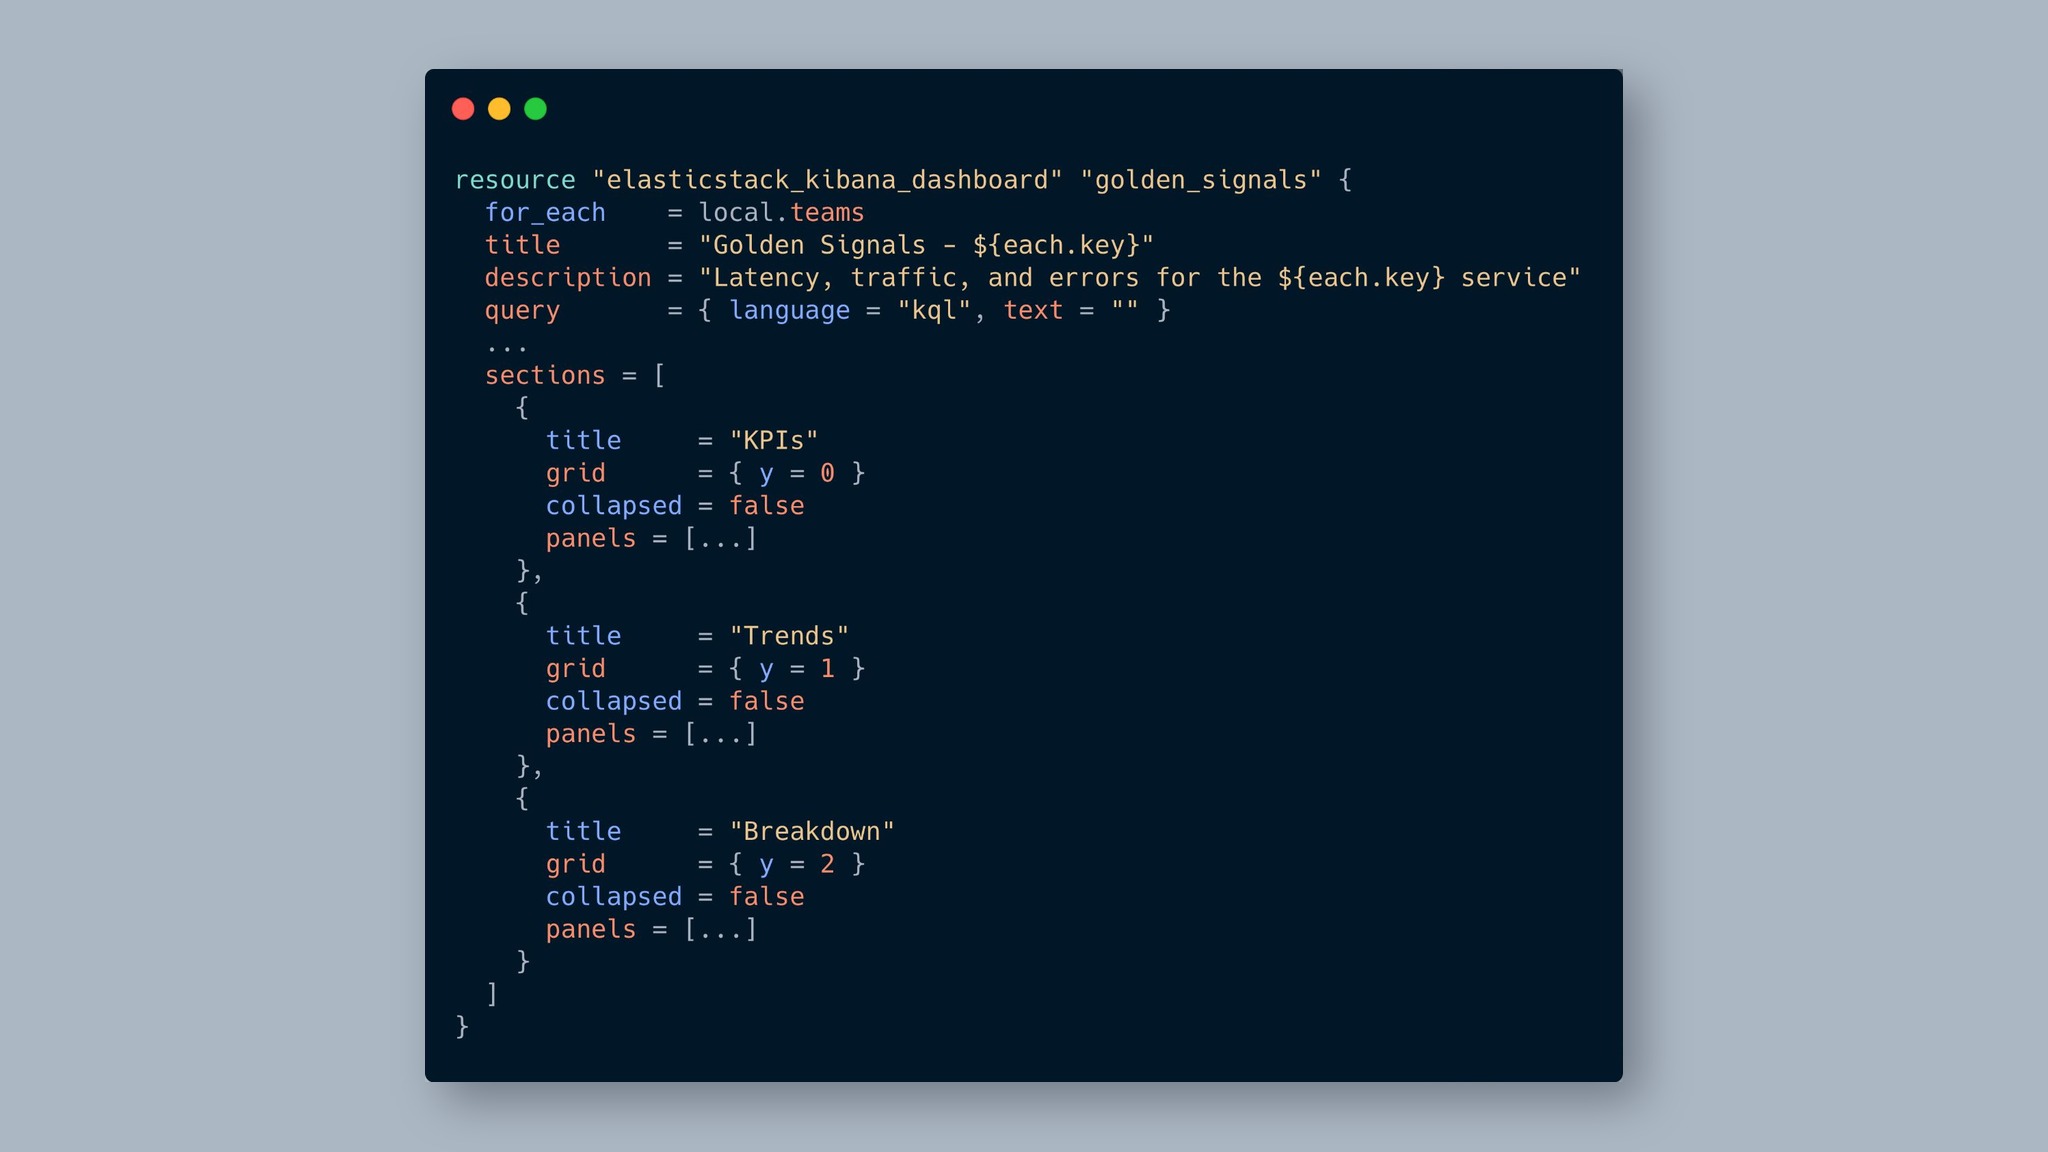
One edit, every dashboard updated: managing Kibana observability at scale with Terraform
Define your golden-signals panels once in a shared HCL library and use for_each to generate every team's dashboard, with drift detection and git rollback built in.

Skip writing alert rules: 6 ready-made ES|QL templates ship inside the NGINX OTel integration
Elastic integrations come with alerting rule templates, each one an ES|QL query with a threshold already set. Create Elasticsearch alert rules in minutes, tune them to your traffic, and catch silent data streams early.

Common ES|QL queries for Kubernetes monitoring
Copy-paste ES|QL queries for Elasticsearch that turn memory pressure and error spikes into a five-minute diagnosis.
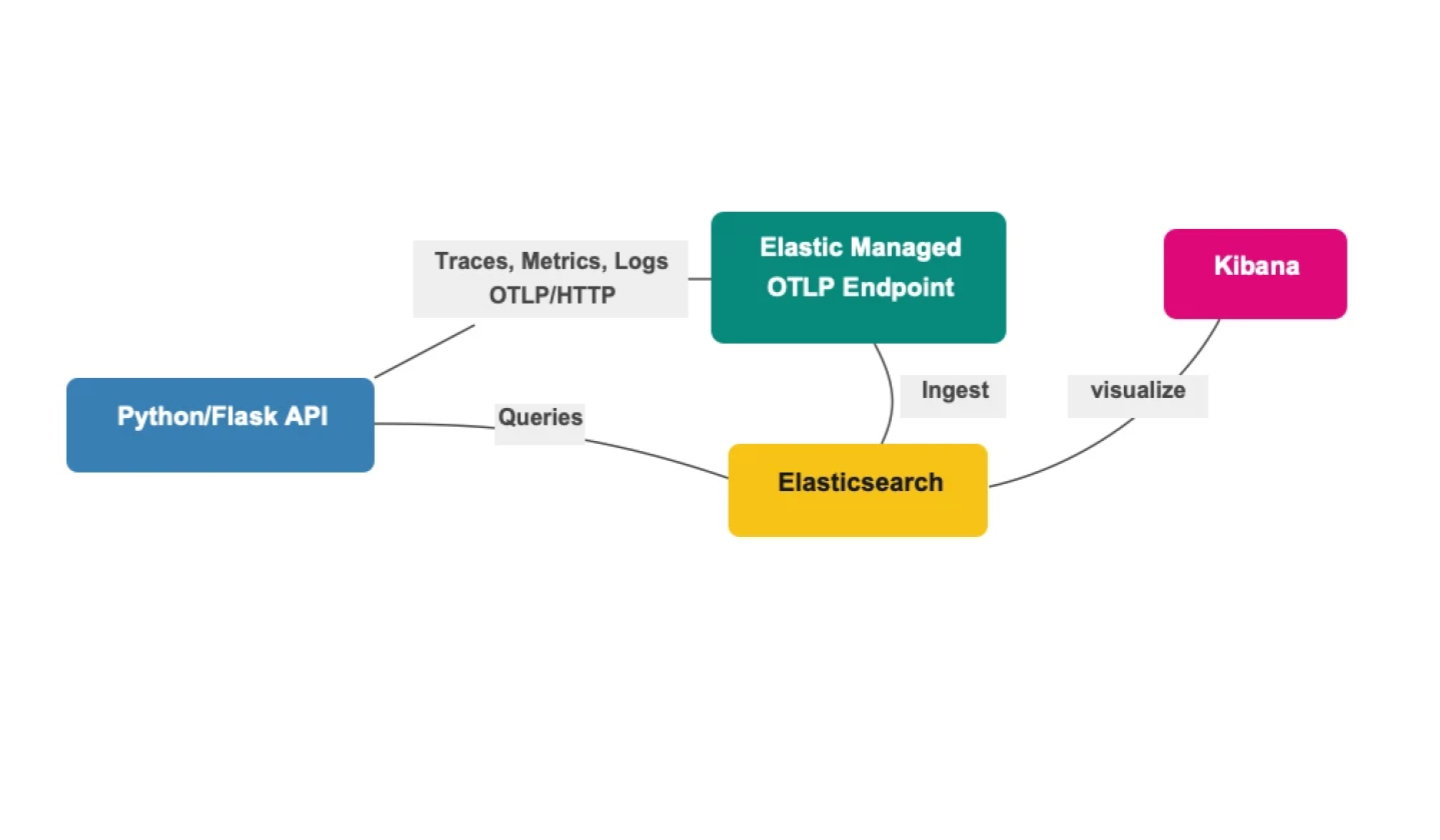
3 signals, 2 env vars, 0 collectors: OpenTelemetry with Python and Elastic's Managed OTLP Endpoint
Instrument a Flask API with OpenTelemetry and ship traces, metrics, and logs to Elastic Cloud using just 2 environment variables, no collector needed.
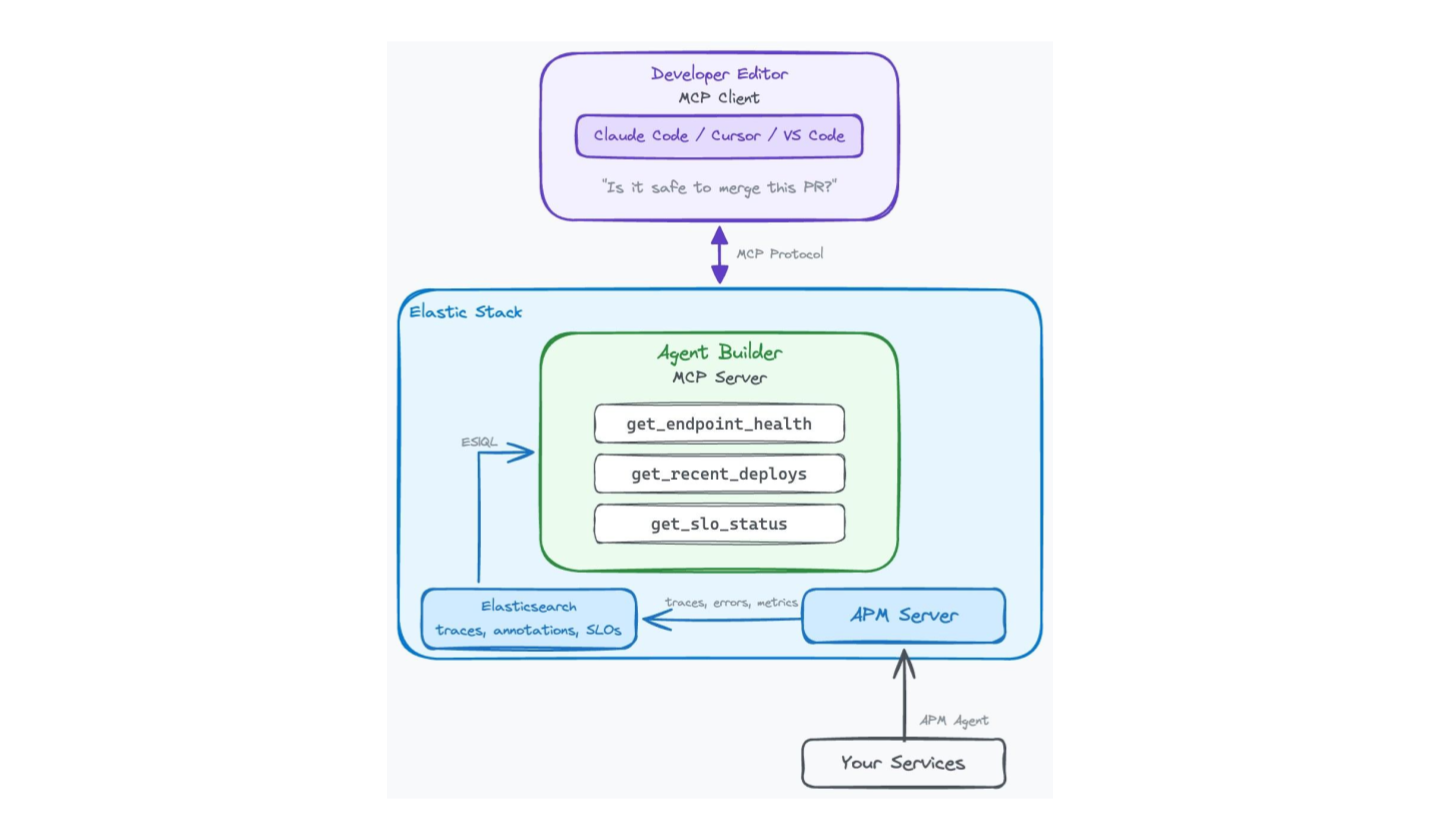
Contextual AI: Stop pinging the SRE: three MCP tools that turn Elastic Agent Builder into your team's runbook
Build three MCP tools in Elastic Agent Builder that read endpoint health, recent deploys and SLO burn rate directly in your editor. Encode your platform team's runbook once; every developer gets self-serve production context without pinging an SRE.
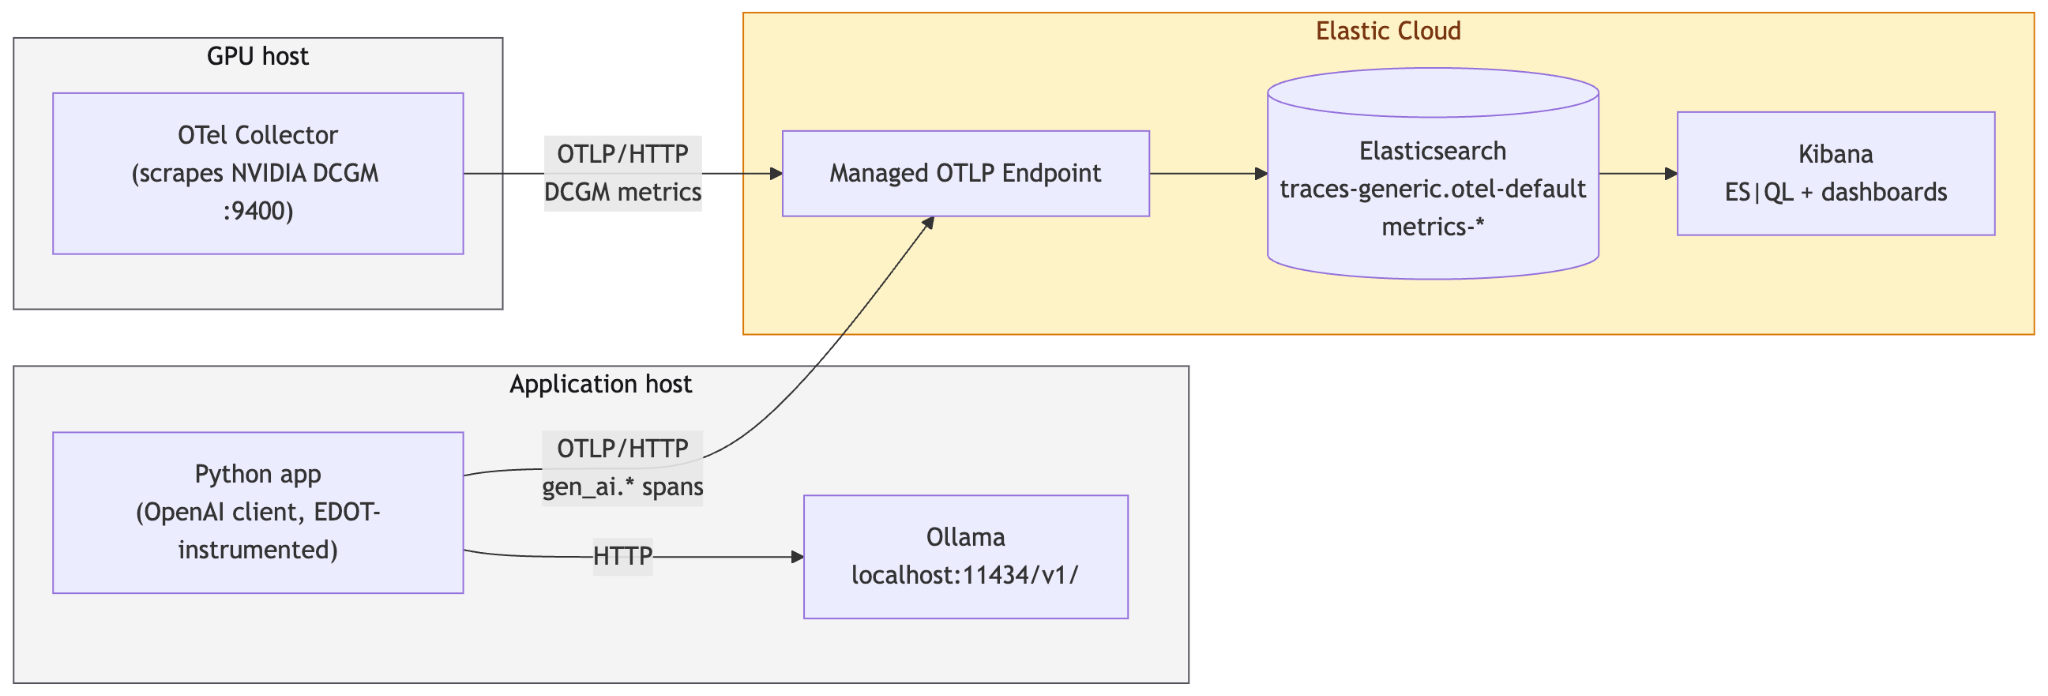
ES|QL queries for debugging LLM latency, cost and GPU saturation
Learn how to investigate LLM latency, token cost and GPU saturation using ES|QL against OpenTelemetry traces and get a root cause, not just a symptom.
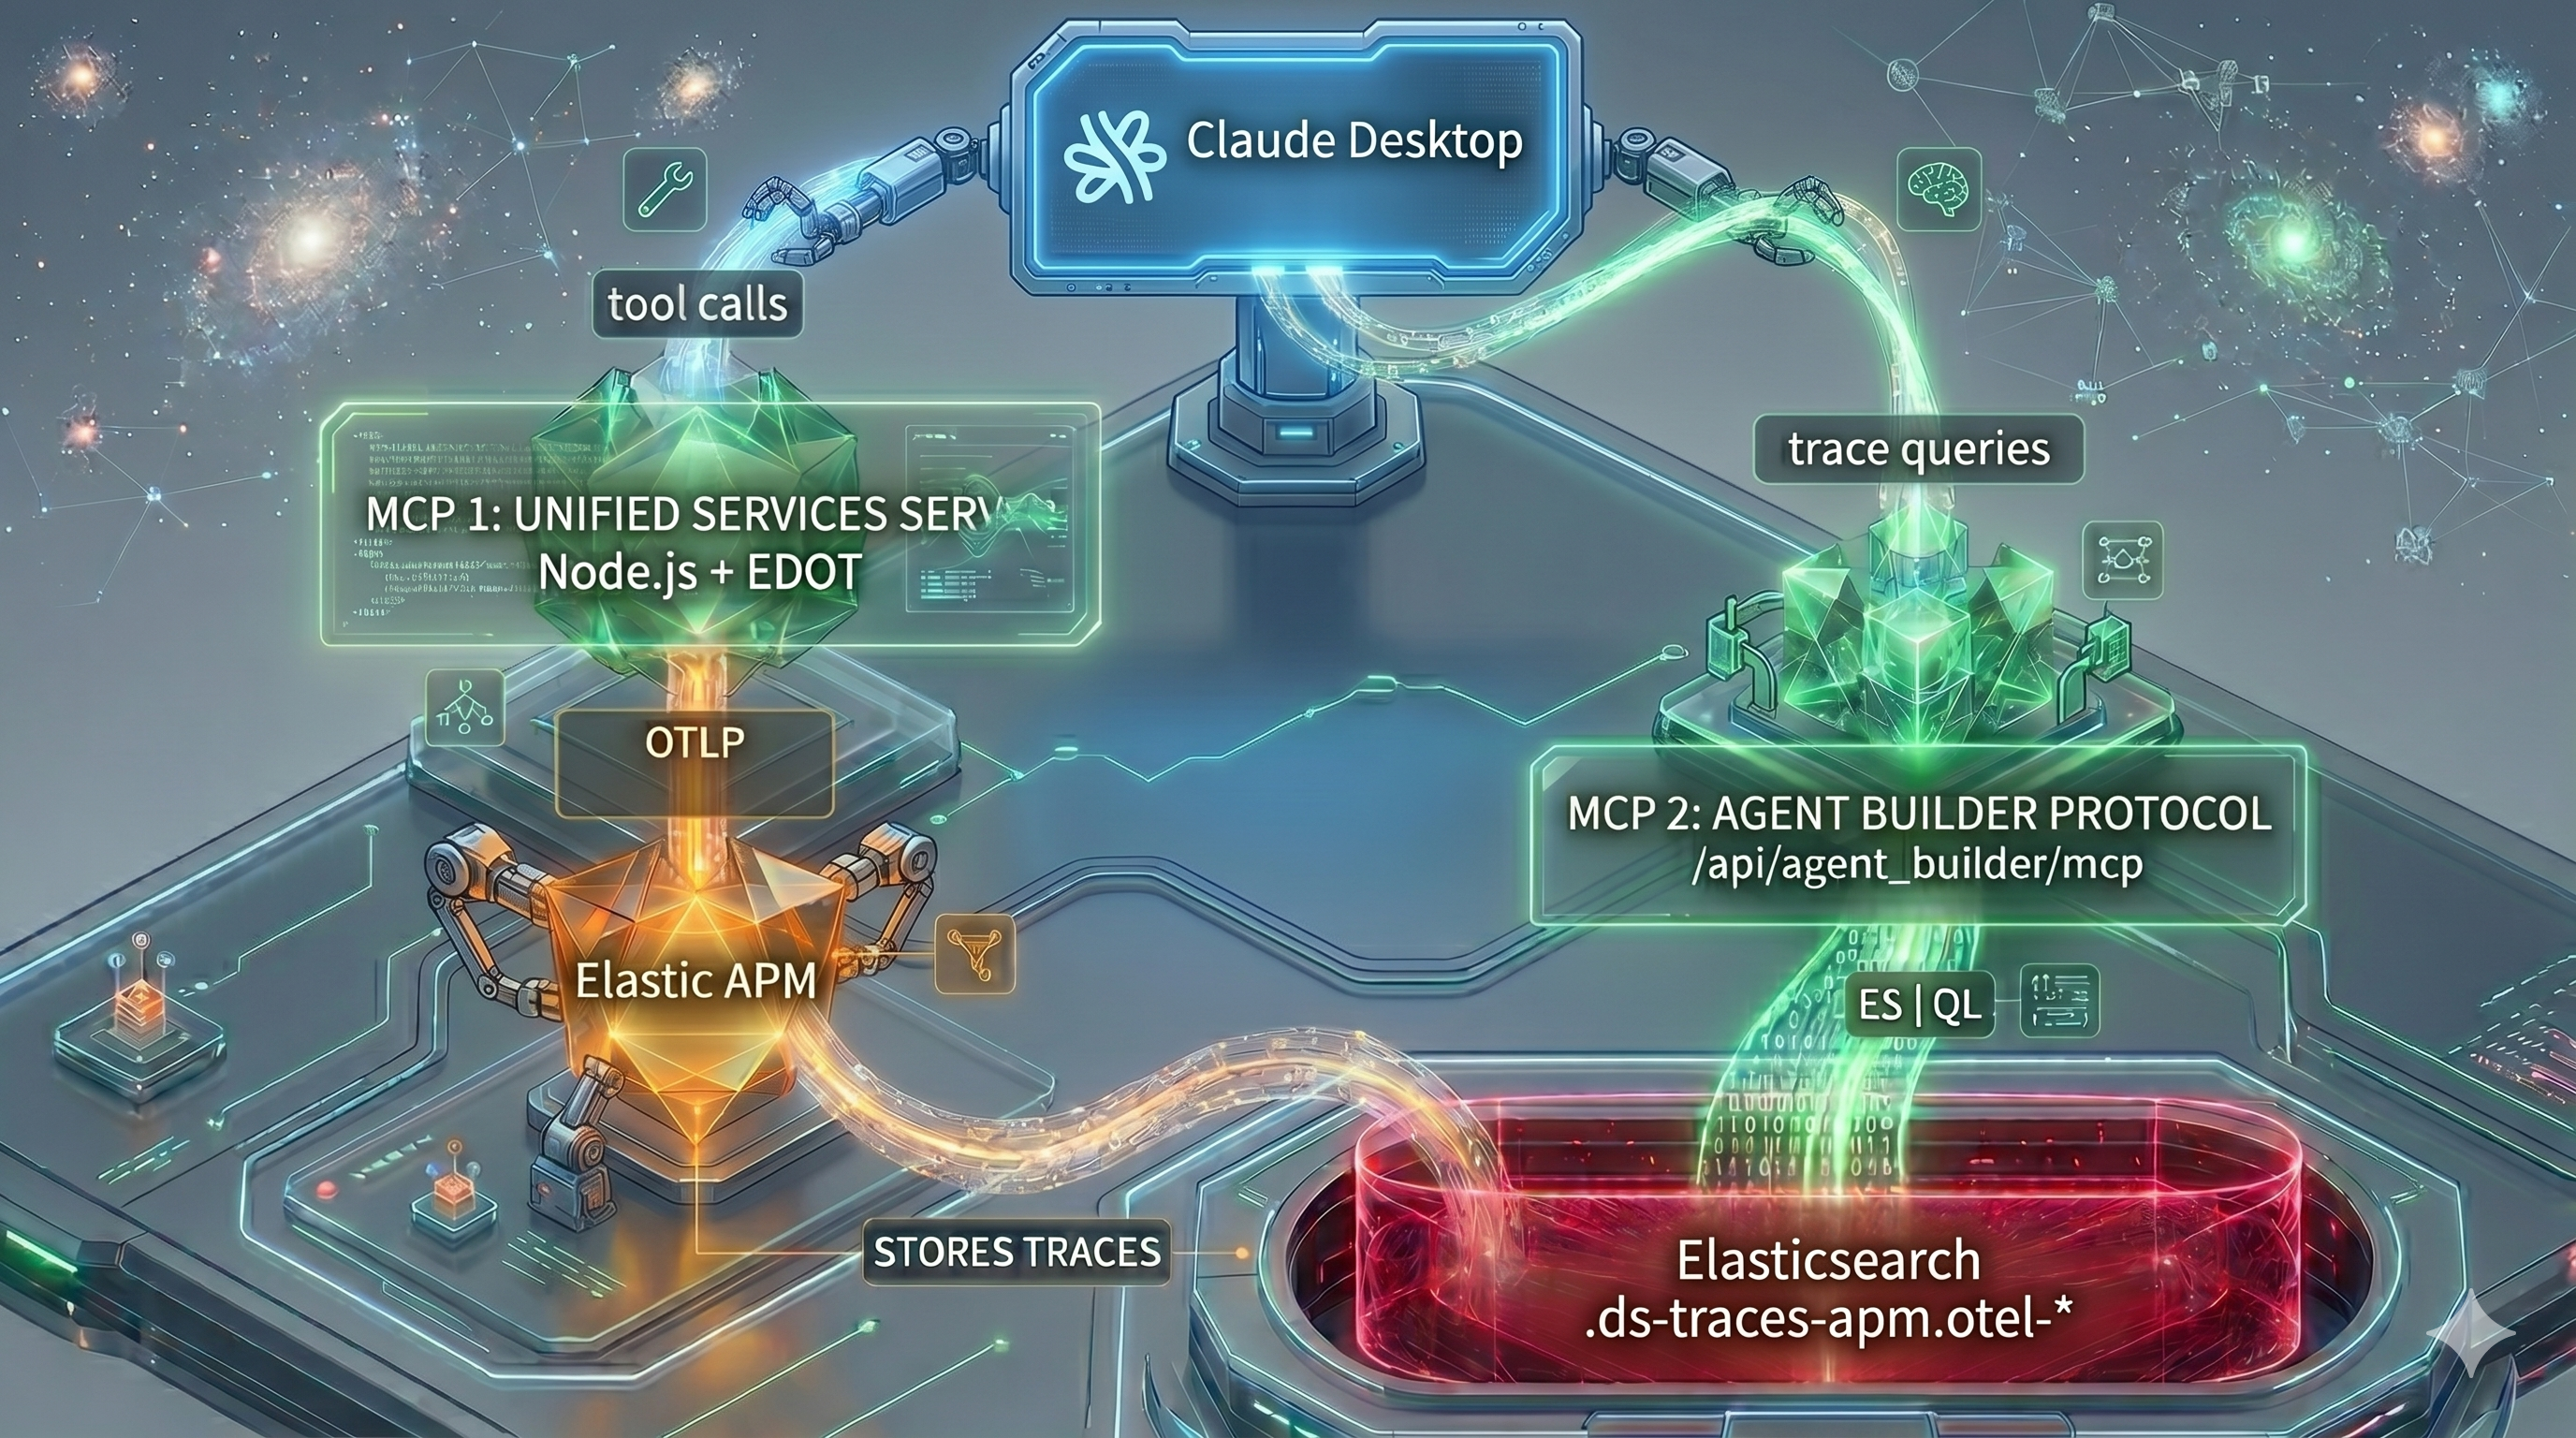
How to trace MCP server tool calls with OpenTelemetry and Elastic APM
Add OpenTelemetry tracing to an MCP server, visualize tool call performance in Elastic APM, and query the trace data from Claude Desktop using the Agent Builder MCP.

Connecting Cursor to Production Logs via the Elastic MCP Server
Learn how to connect Cursor to your Elastic APM data using the Elastic Agent Builder MCP server, so you can debug production errors and make UI decisions backed by real usage data without leaving your editor.
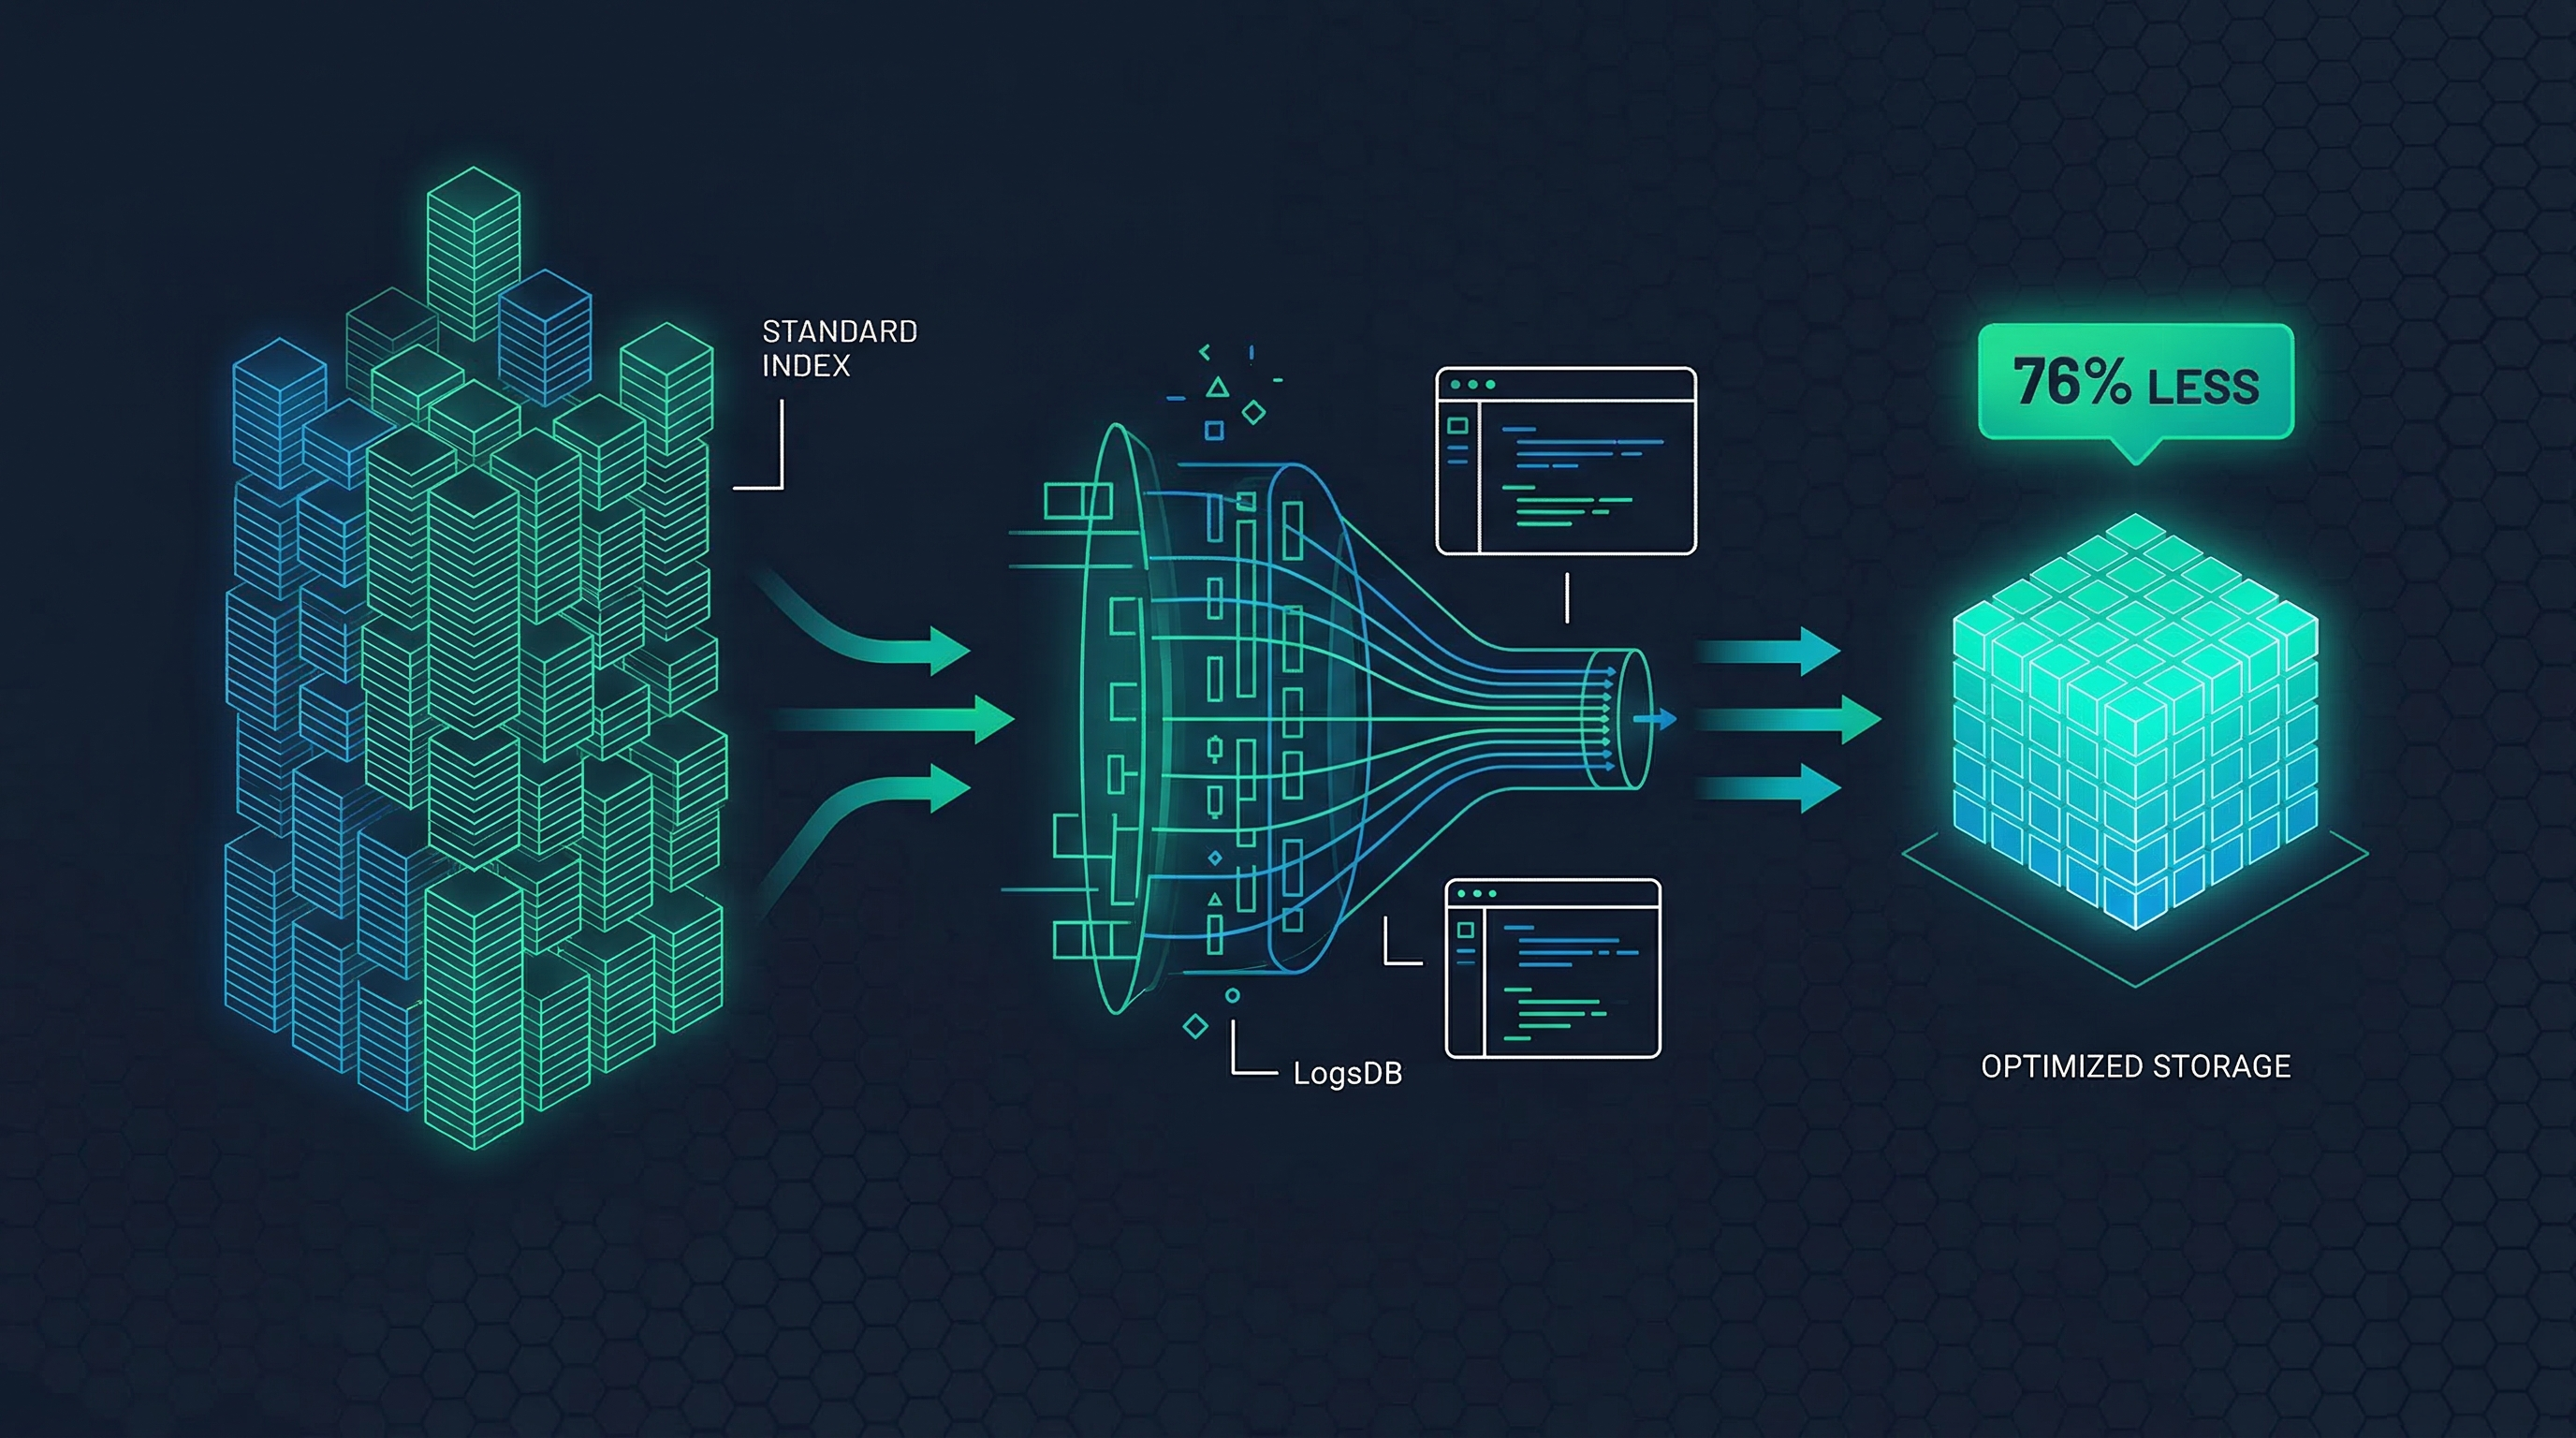
How to cut Elasticsearch log storage costs with LogsDB
Learn how to enable LogsDB index mode in Elasticsearch and measure real storage savings. We compare a standard index against a LogsDB index using Apache logs and show how much storage you can reclaim.