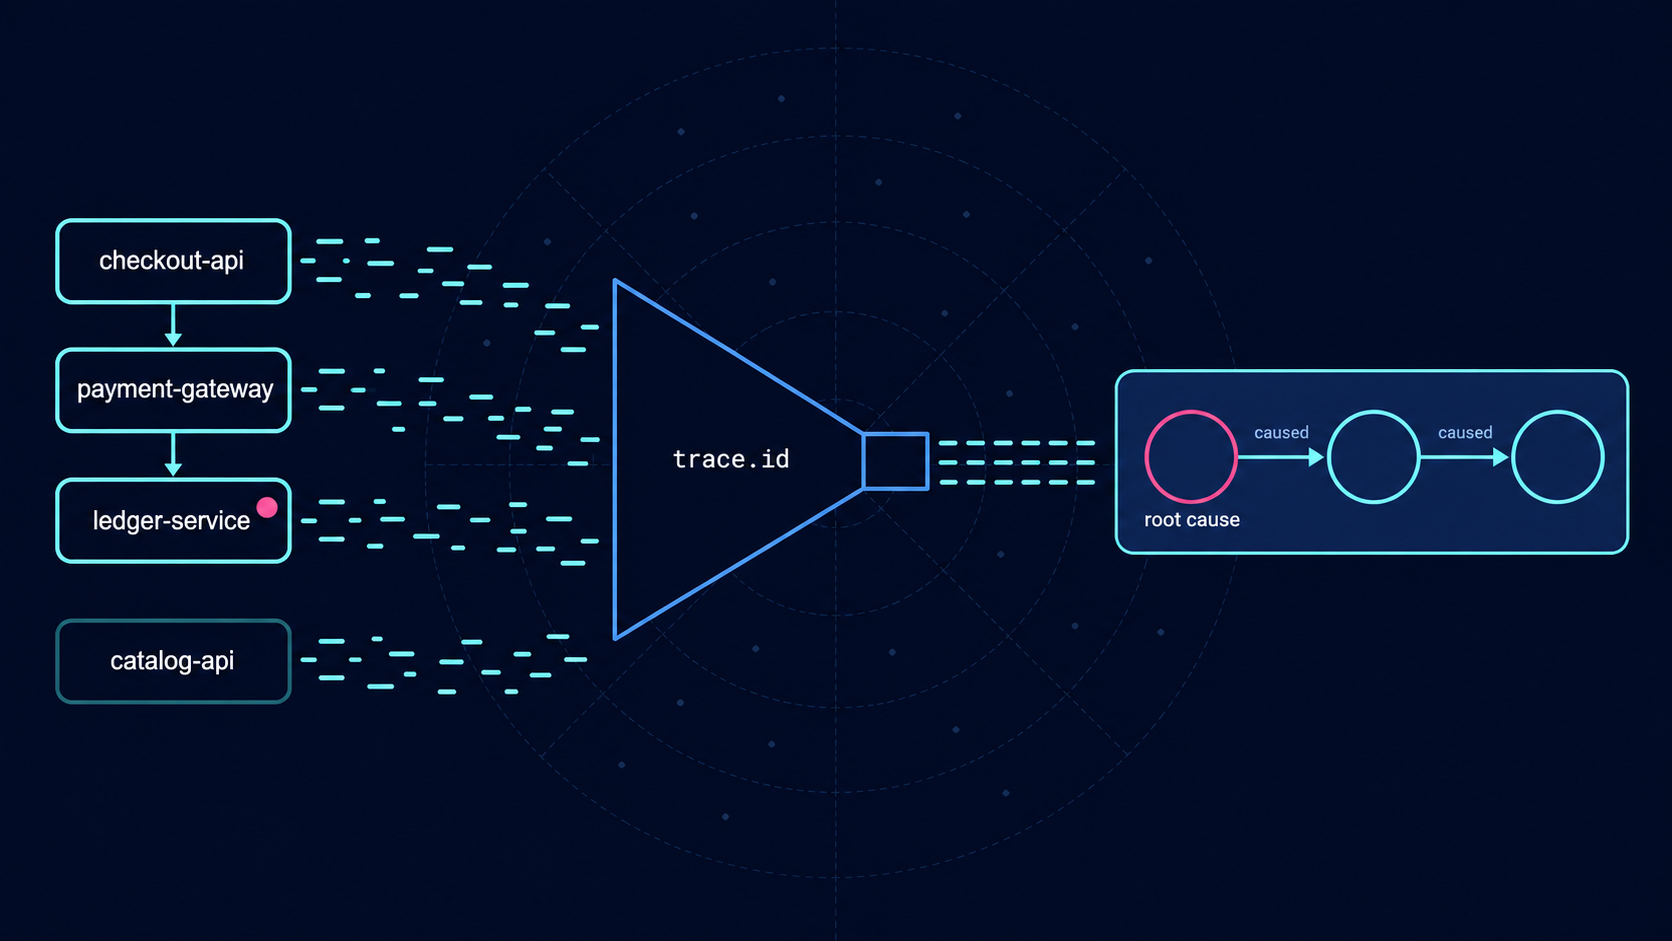
The service with the most errors was healthy: root cause analysis from logs with ES|QL
Metrics ranked three services identically at 19.1%. Four ES|QL queries over the same 4,688 OpenTelemetry log records traced 955 of 956 failure chains back to one of them, and needed no service dependency model to do it.

Telemetry Policy: change OpenTelemetry sampling and log levels at runtime, no restart
Telemetry Policy says what you want to happen and leaves each component to work out how. Change an OpenTelemetry Java agent's trace sampling to 1% and the JVM keeps serving traffic.
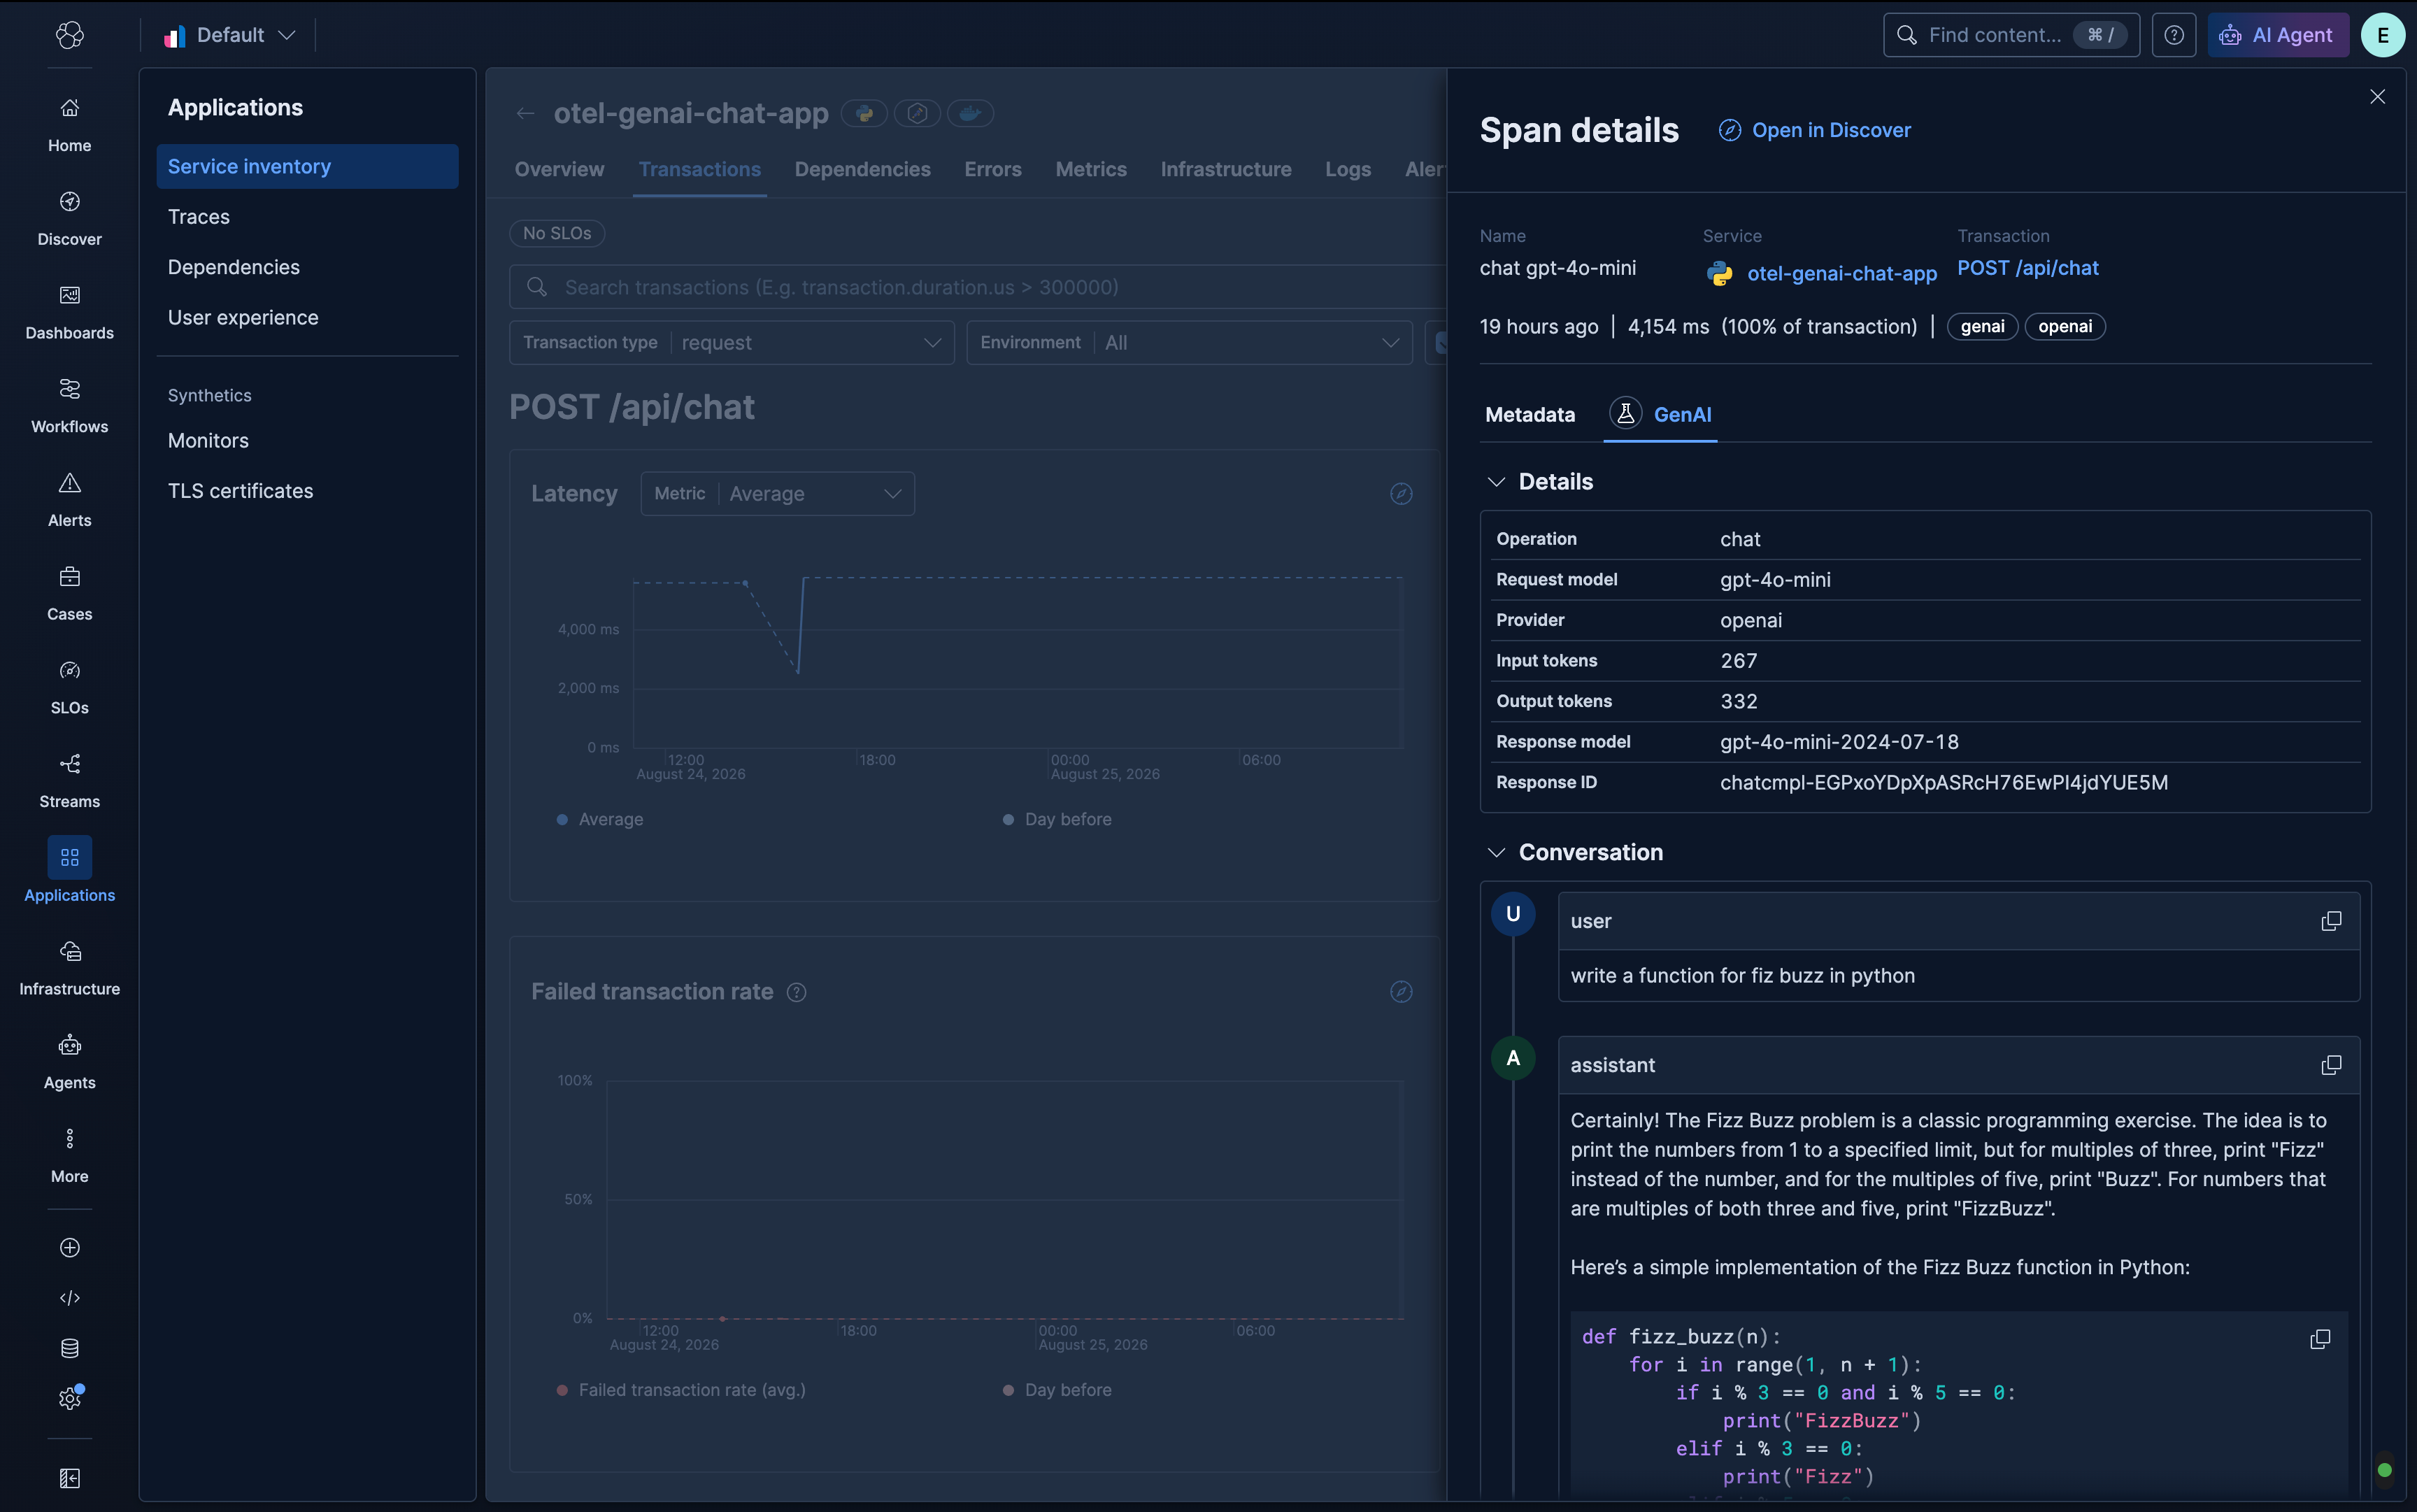
LLM tracing in Elastic APM: prompts, responses, and token counts in the span view
In a twenty-call agentic trace, you can see which span is using the most tokens and read the prompt that caused it. Both live in Elastic APM, so there is no second tool to run.

Android application monitoring with OpenTelemetry: distributed tracing from tap to backend
EDOT Android adds mobile APM to your Android app with one Gradle dependency: crash reporting, session tracking and distributed tracing visible in Kibana.
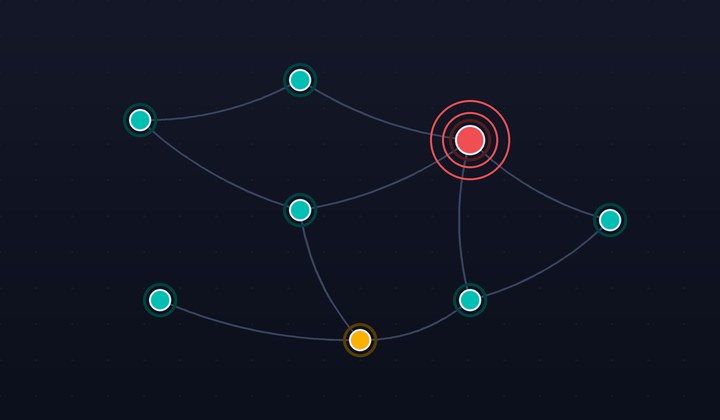
How we rebuilt the APM service map for incident time: the design story behind Observability 9.5
14 enterprise interviews, two prototype rounds, one rebuilt APM service map. The design story behind Elastic Observability 9.5.
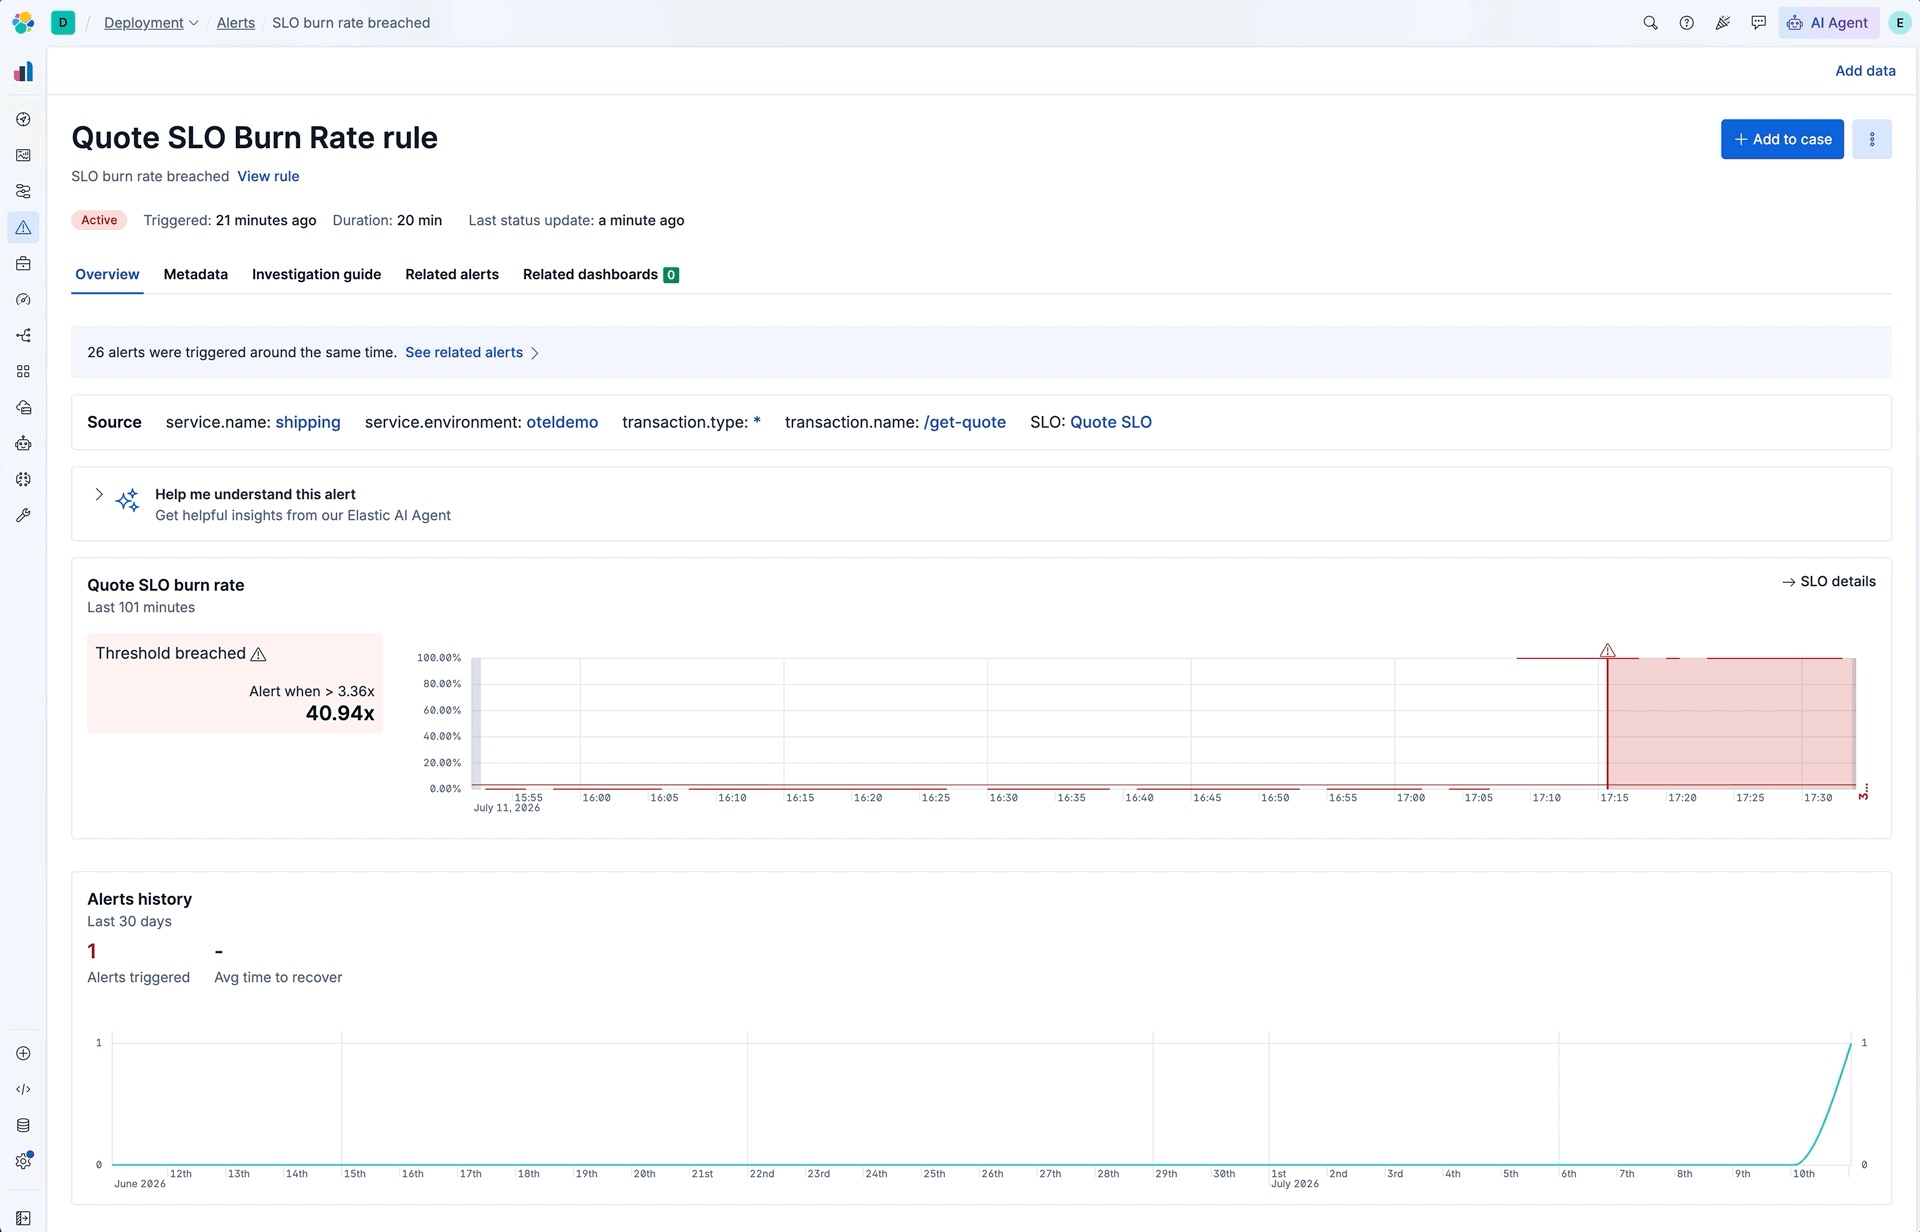
Your SLO is on fire; here's how to find the arsonist in Elastic Observability
When SLO alerting flags a burn rate spike, follow the SLI from the alert detail page through bad event spans and trace waterfalls to find the exact dependency burning your SLO error budget, all without leaving the investigation.
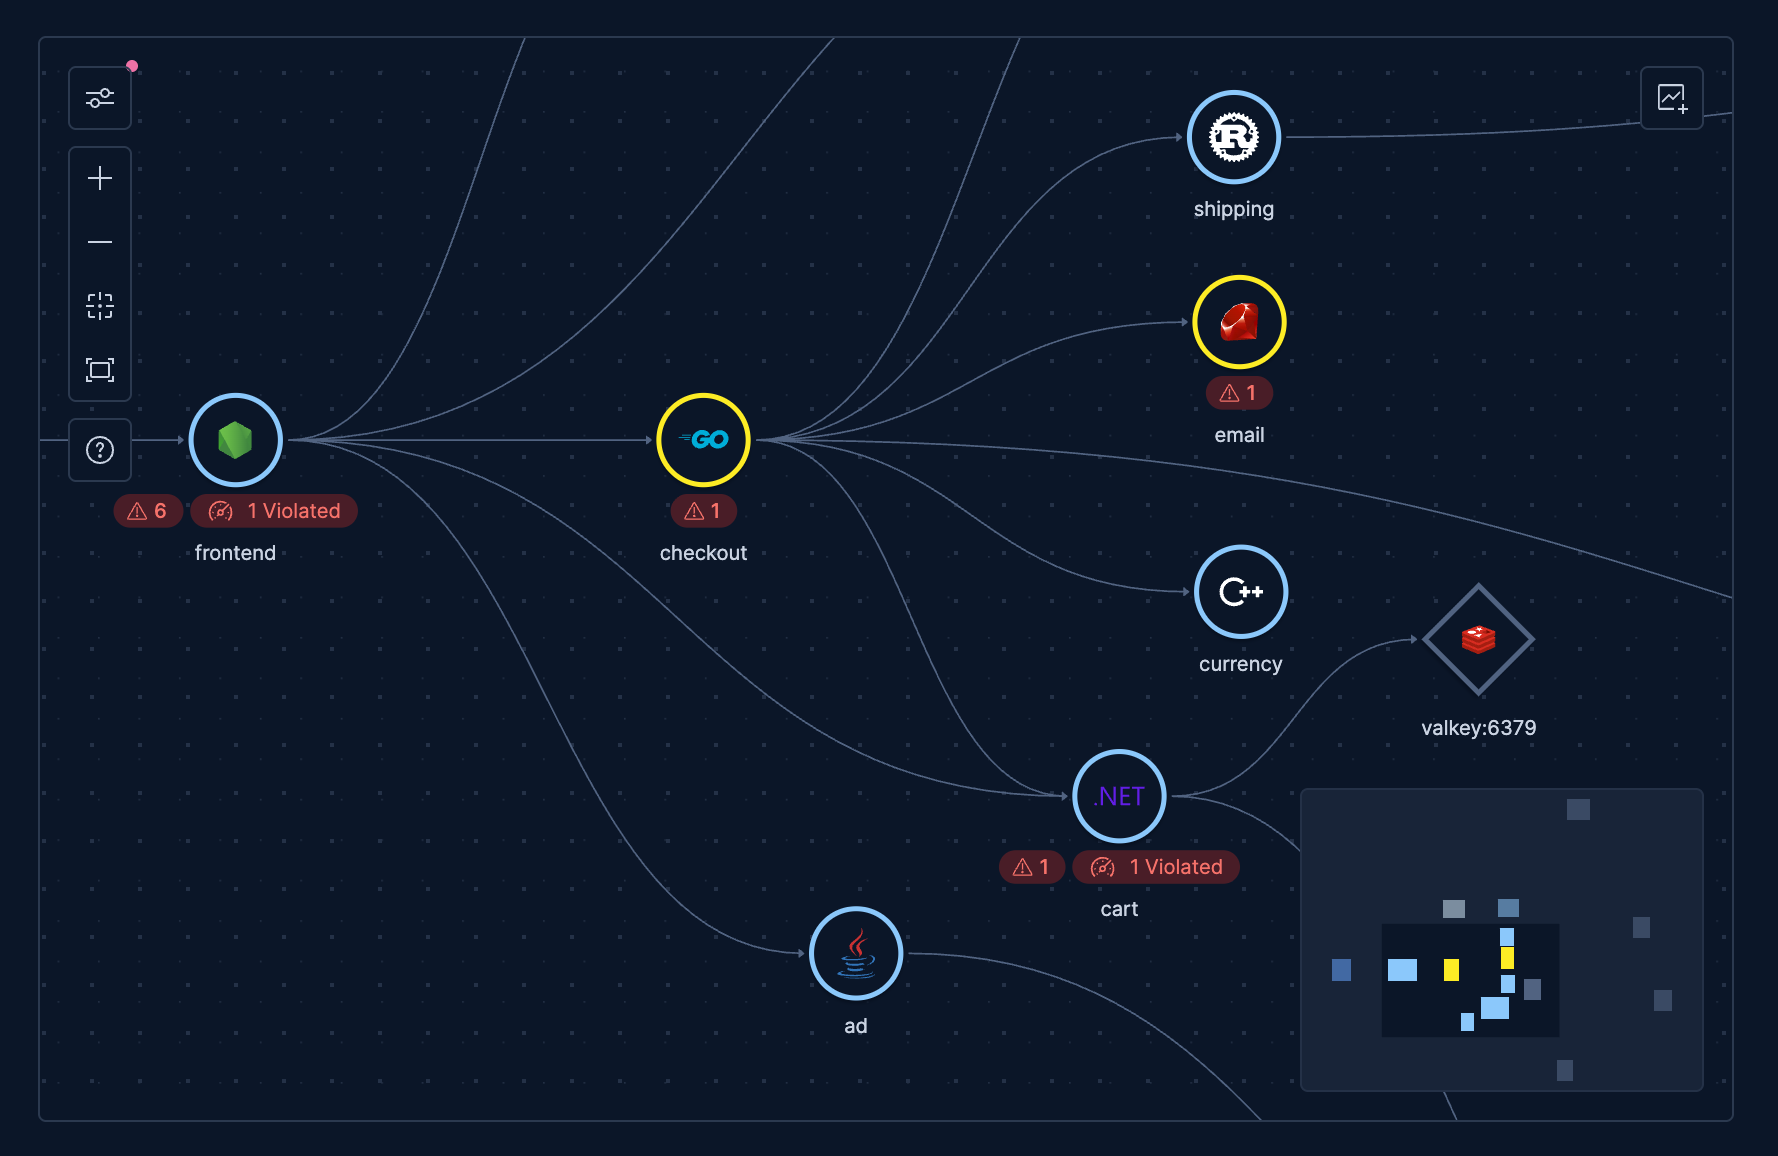
6x faster at 500 services: how we rebuilt the Kibana APM service map from canvas to React DOM
Each service node shows alert, SLO and anomaly health so you can filter to breaching services only and embed the result on any Kibana dashboard, with full keyboard navigation across the topology.
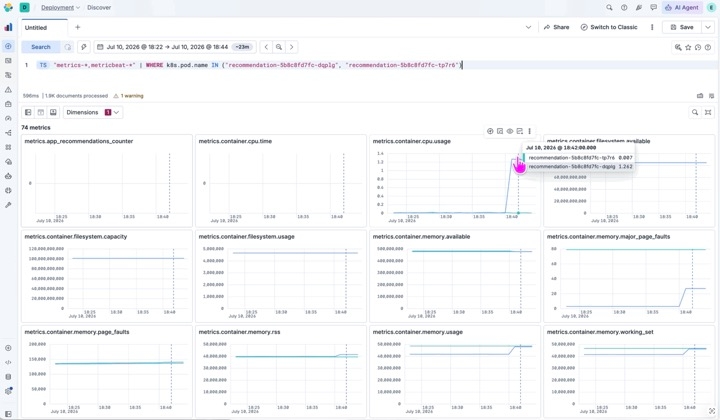
Four clicks from alert to root cause: how Elastic Observability links APM services to Kubernetes infrastructure
Check service dependencies and compare per-pod CPU, memory and network trends on the Infrastructure tab to find which instance is causing trouble, all without leaving the alert investigation.
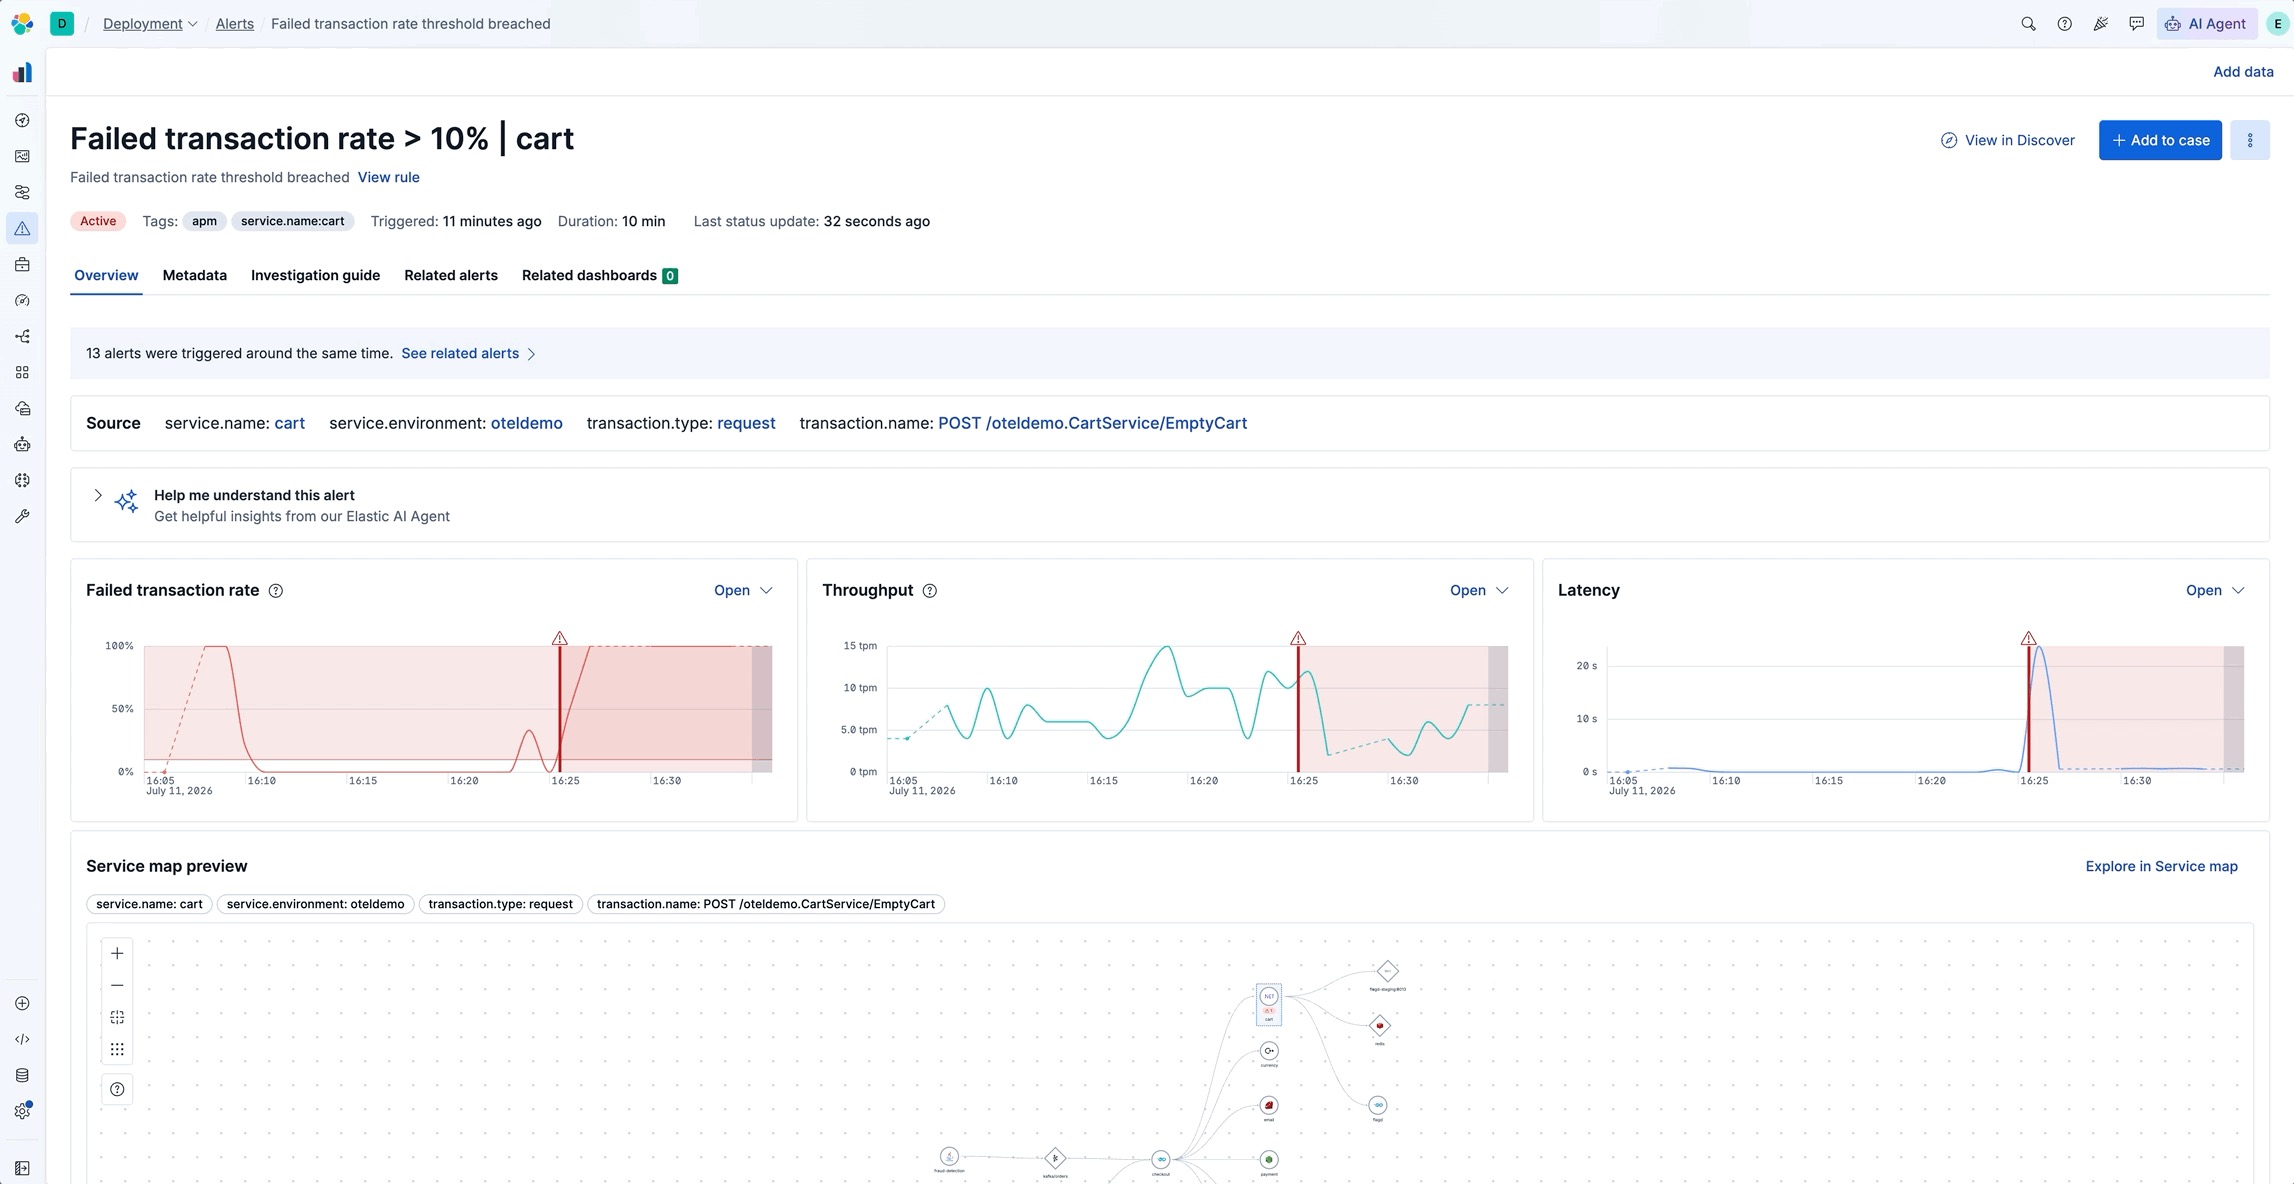
Three clicks from alert to error log: breaking down RED metrics by any span attribute in Elastic Observability
See which pod, deployment or version is driving a RED metrics change by breaking down span attributes in Discover, then trace a failing span to the error log behind it.
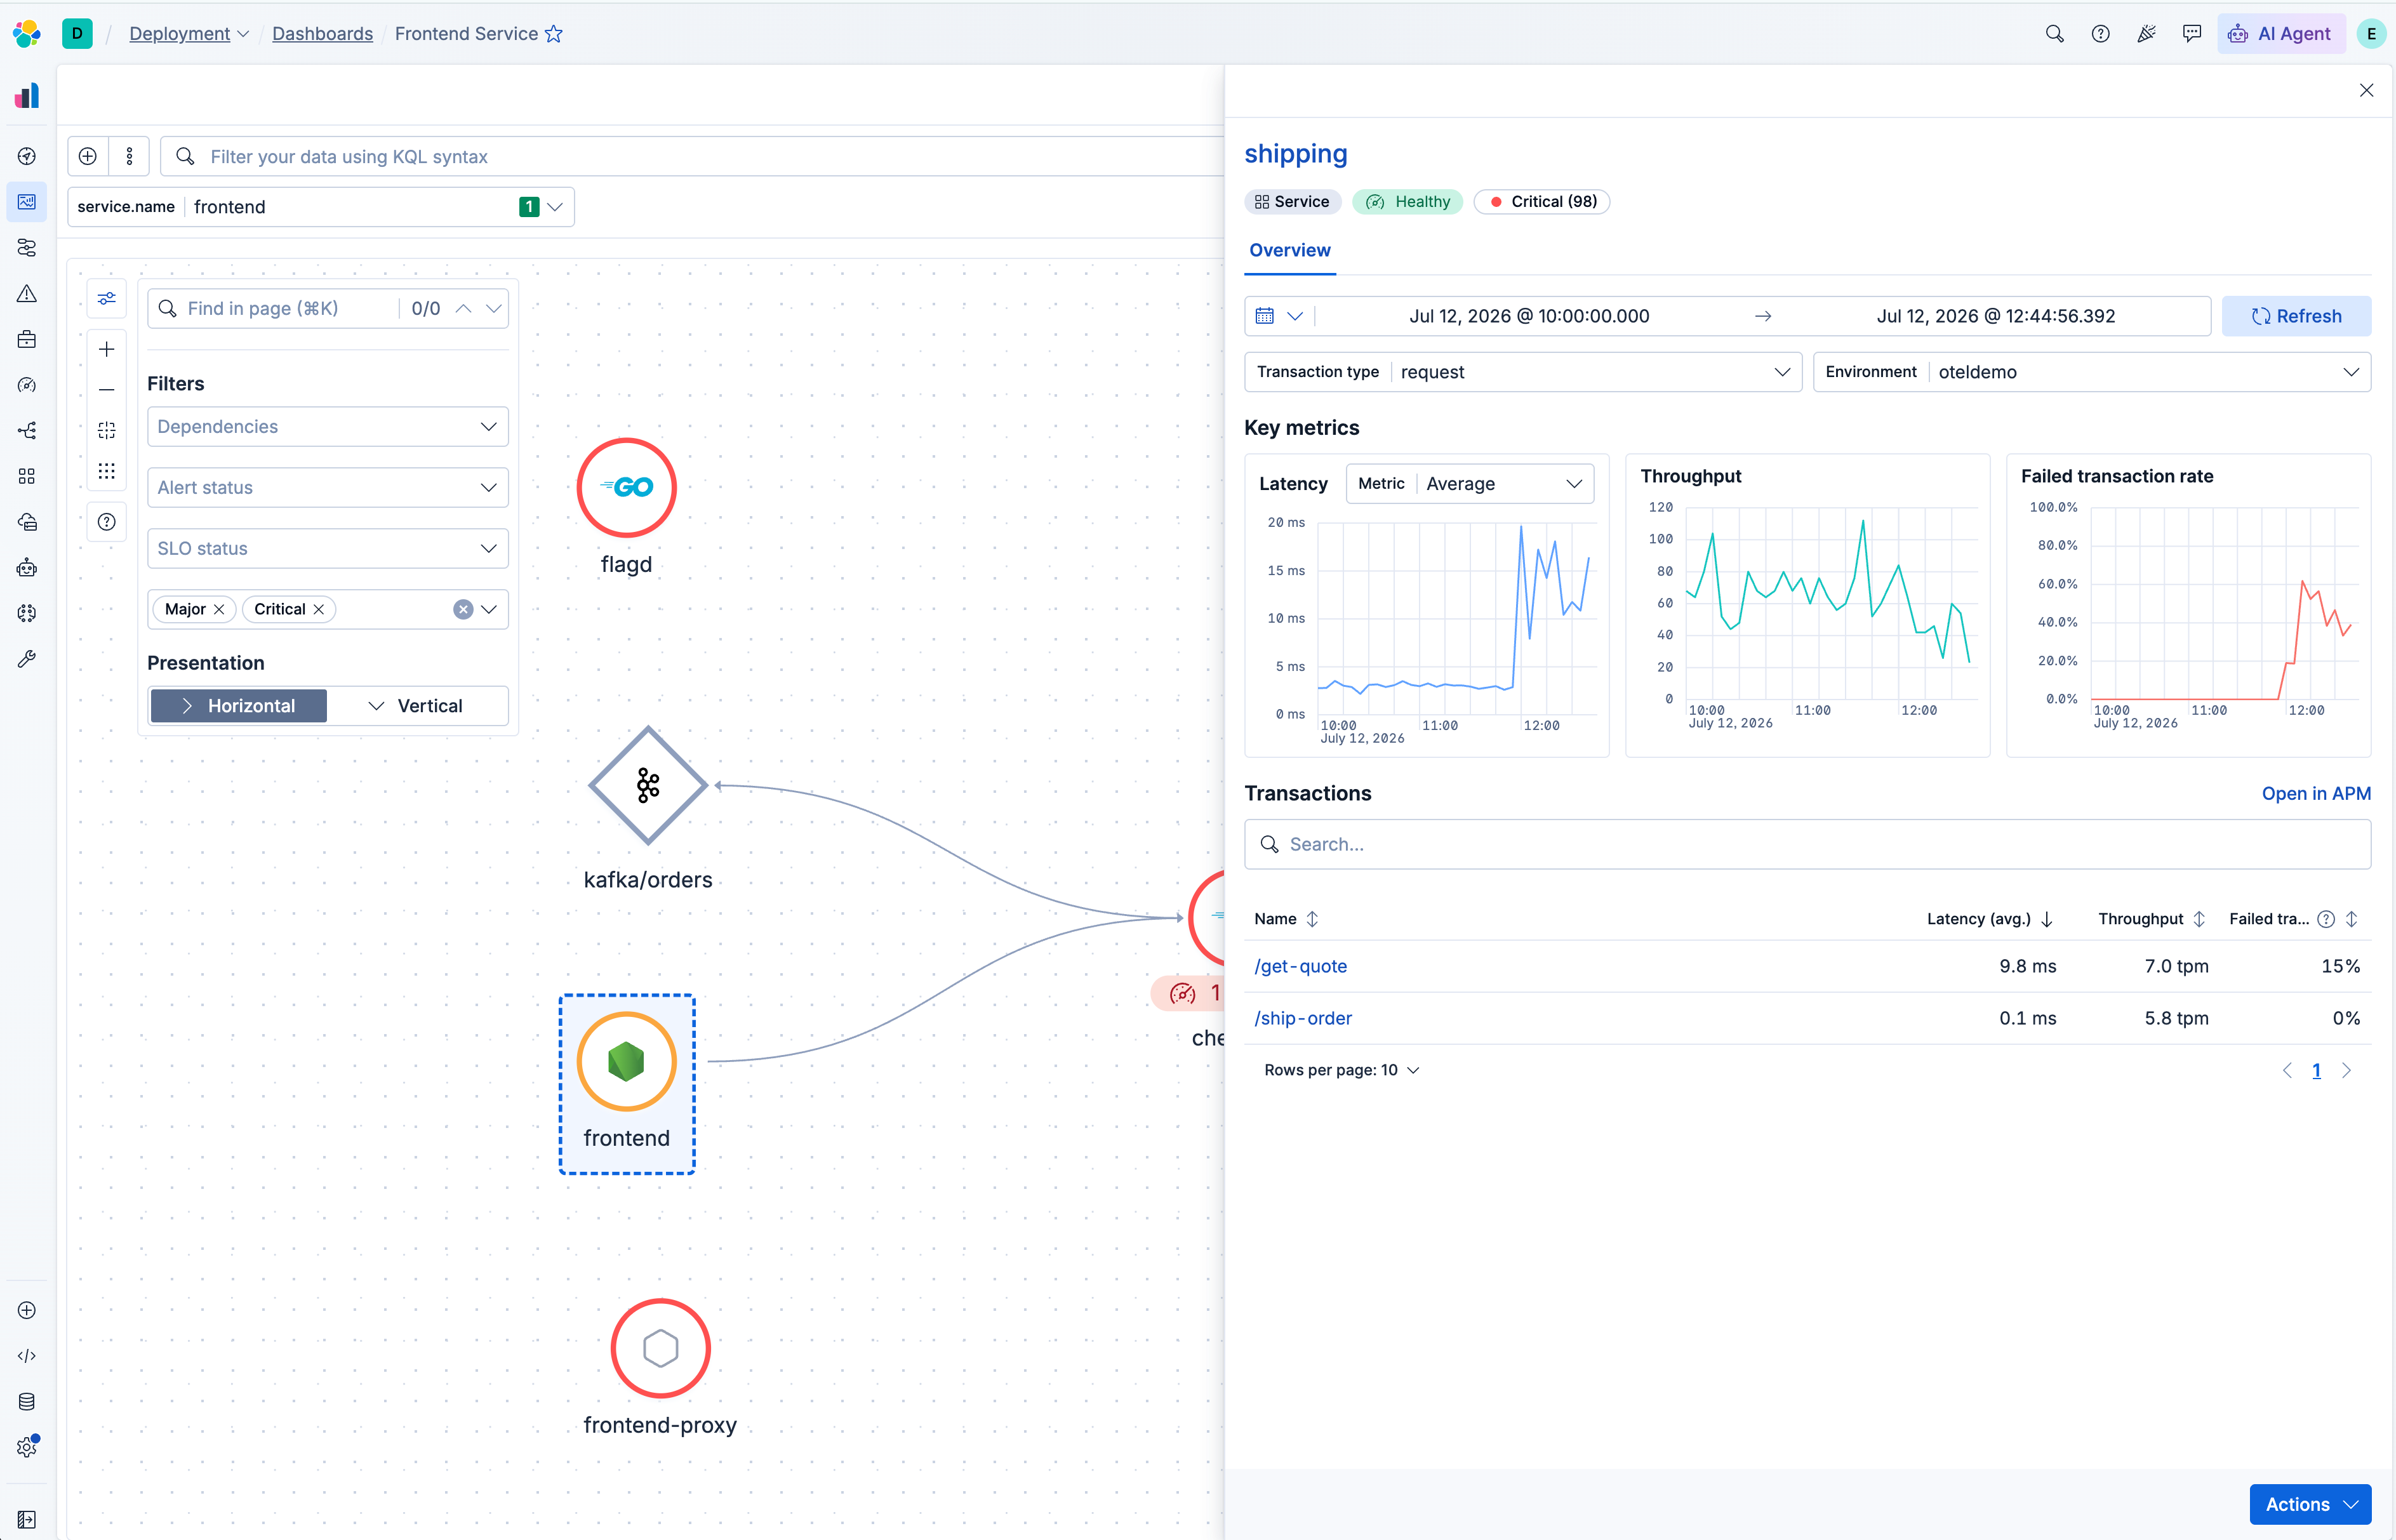
From alert to failing dependency in four clicks: Elastic APM's embedded service map
The APM service map is now embedded on alert pages with filters, connection metrics and a service fly-out so you can analyse dependencies and find the root cause without leaving the alert.
How Elastic cut OpenTelemetry tail sampling memory by 65% with disk-backed trace storage
Elastic contributed two features upstream to the OTel Collector's tail sampling processor. The span-ingest strategy lets sampling decisions happen earlier, and Pebble tail storage moves trace buffering to disk. It costs more CPU, but operators can raise decision_wait and num_traces without OOM kills.
From five dashboards to one prompt: how we built an APM health monitor with Elastic Agent Builder
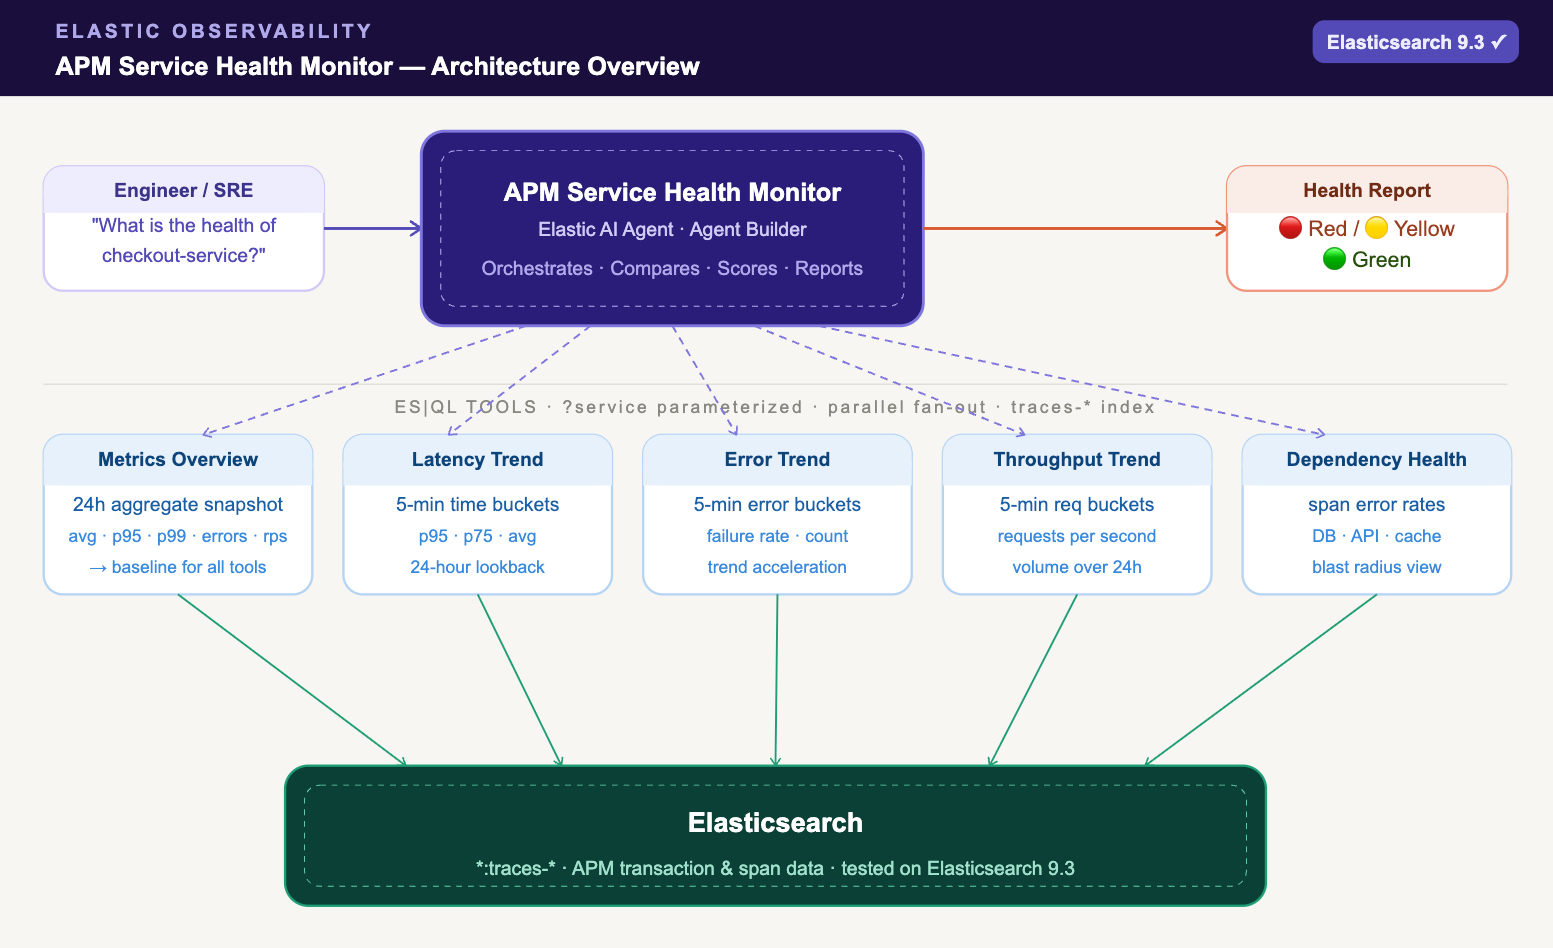
Five ES|QL tools score latency, errors, throughput and dependencies to find the root cause, so you don't dashboard-hop during an APM incident.