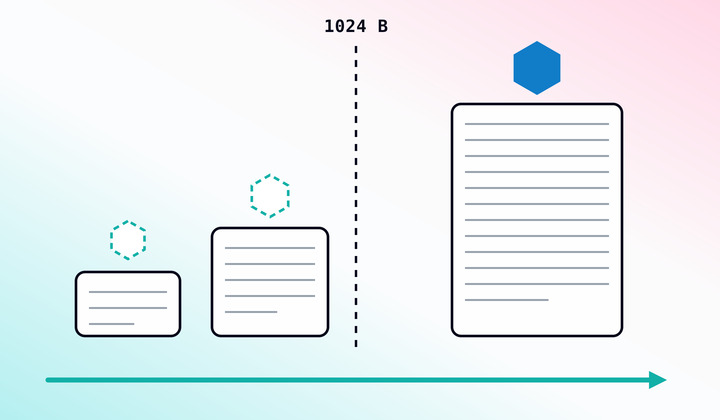
No log file too small: How Elastic Agent tracks files below the 1 KiB threshold
Elastic Agent 9.5 builds a small log file's identity out of the bytes it already has, then re-links it as it grows and crosses 1024 bytes, so it is never re-ingested.

Telemetry Policy: change OpenTelemetry sampling and log levels at runtime, no restart
Telemetry Policy says what you want to happen and leaves each component to work out how. Change an OpenTelemetry Java agent's trace sampling to 1% and the JVM keeps serving traffic.

Native OTLP metrics ingestion on Elastic Cloud Hosted
Send an exponential OpenTelemetry histogram and Elasticsearch keeps the scale and buckets you sent. All four type and temporality combinations work now, and your SDK and Collector config stay exactly as they are.
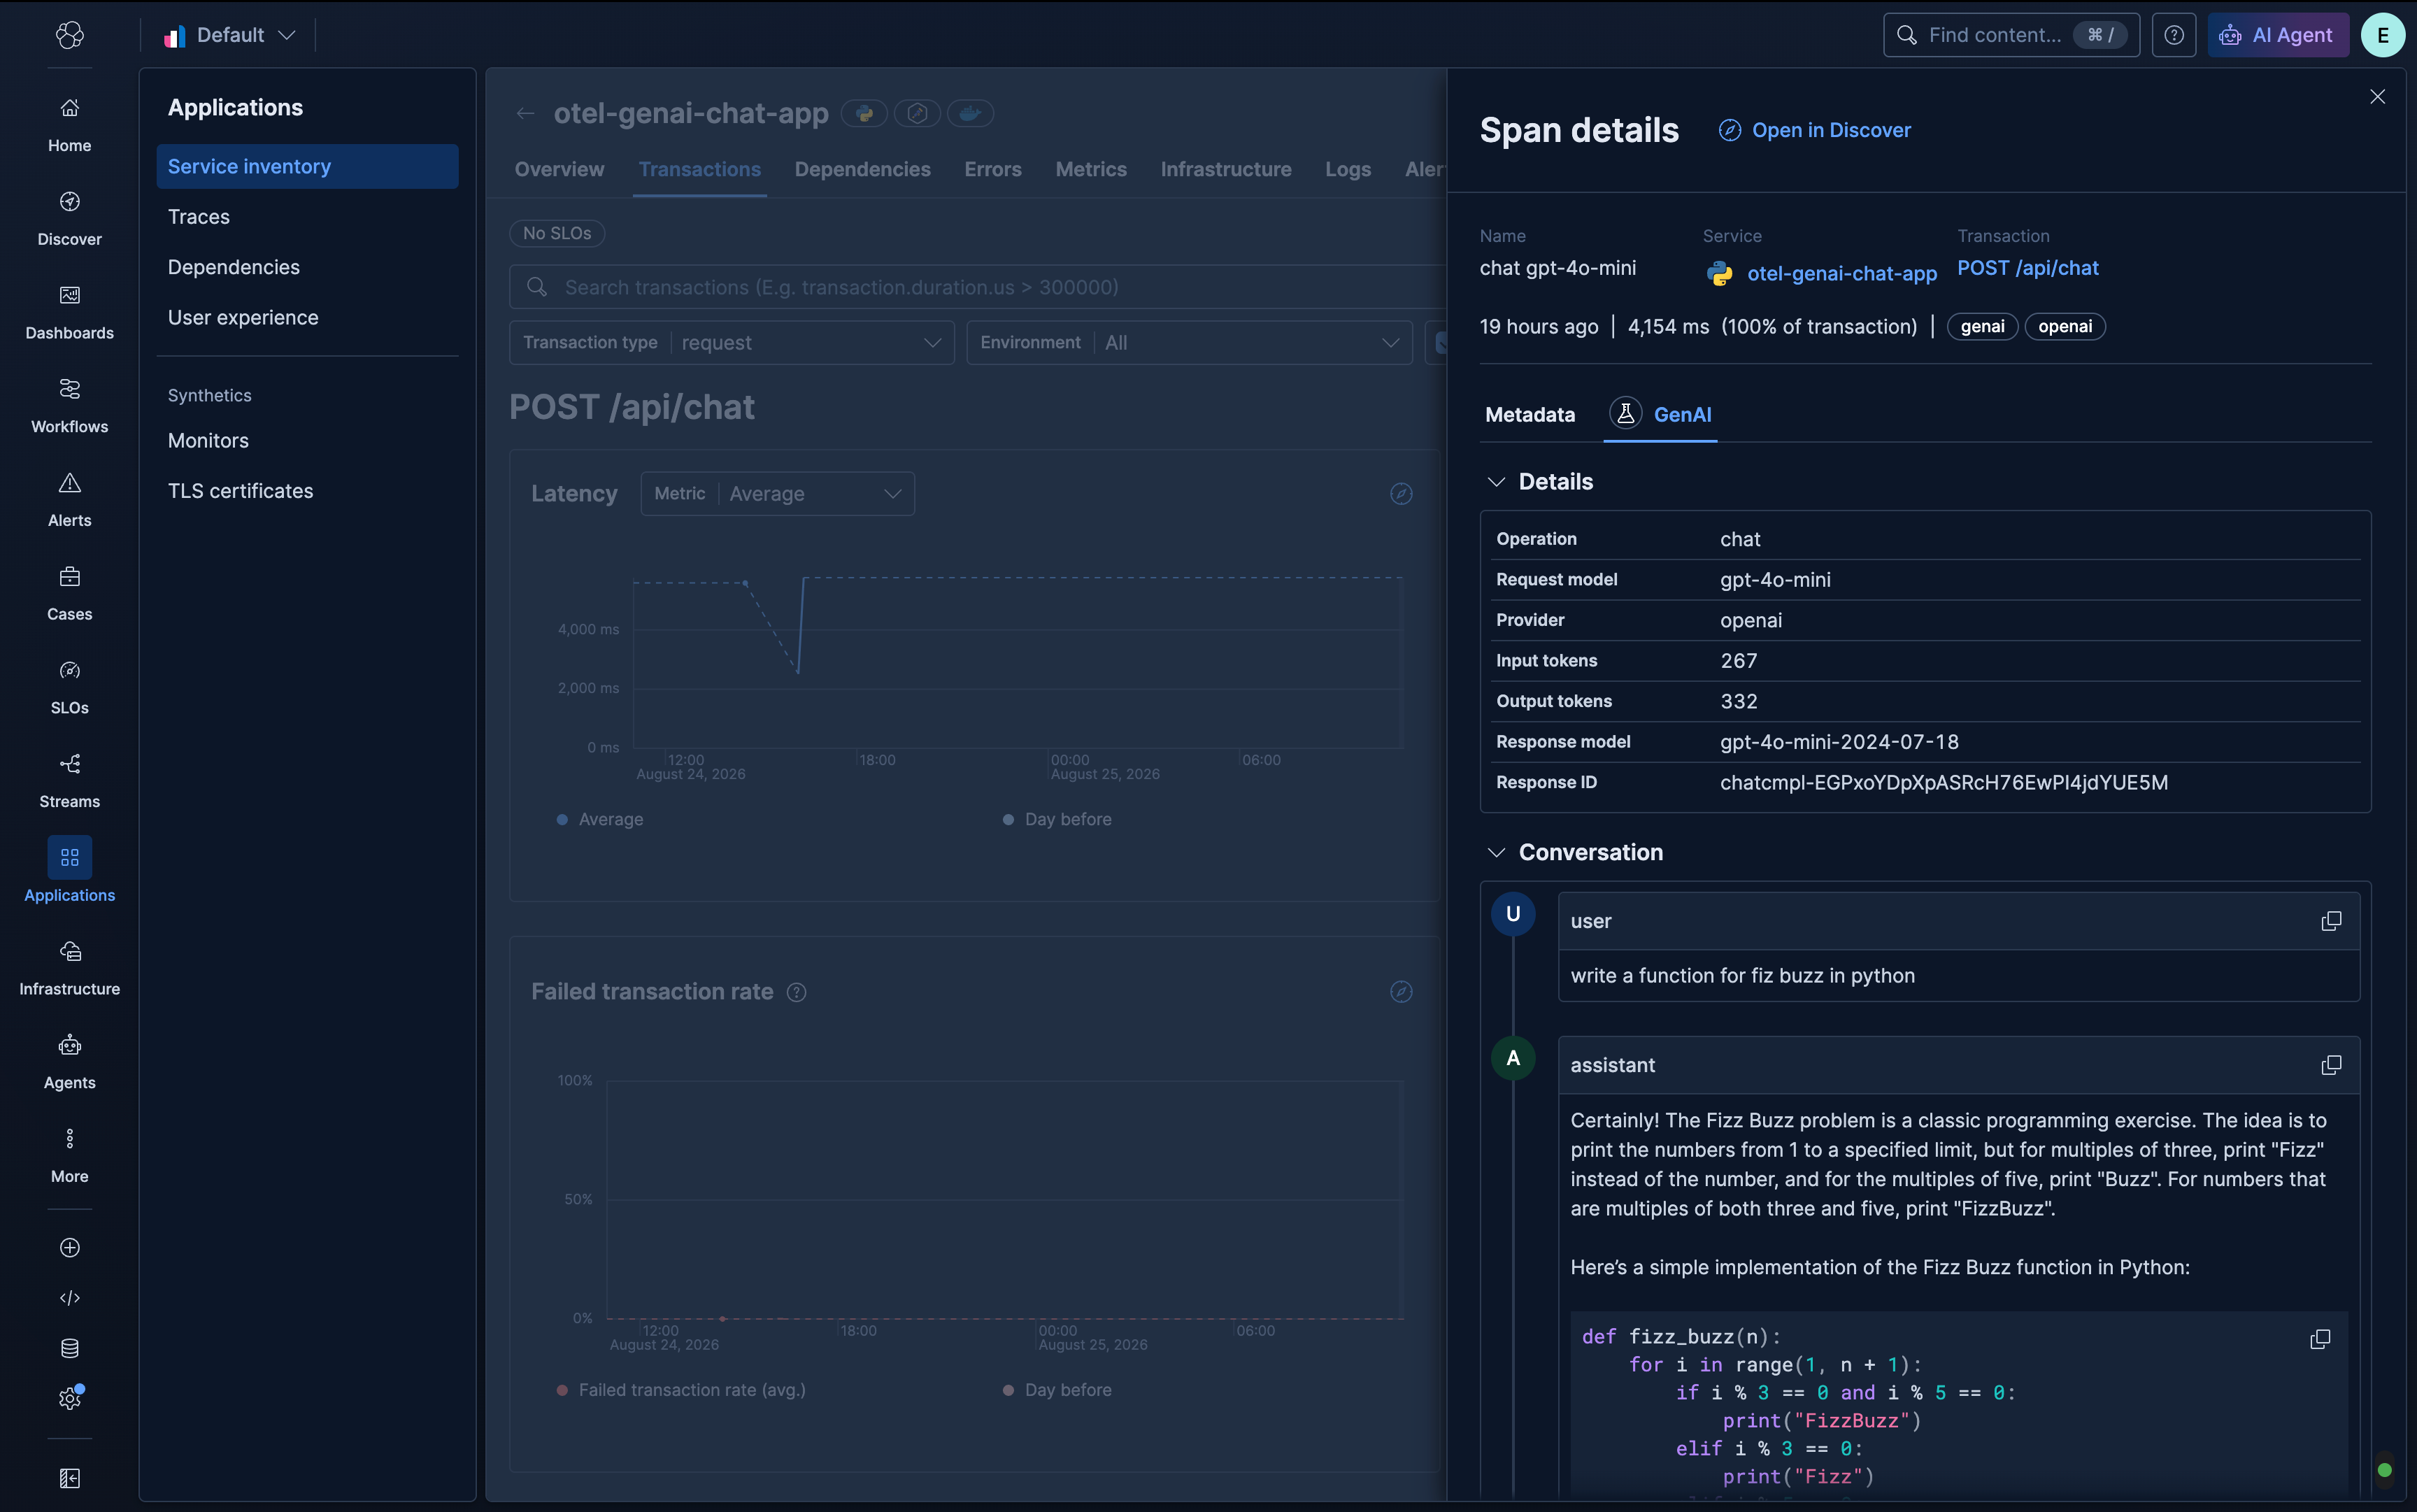
LLM tracing in Elastic APM: prompts, responses, and token counts in the span view
In a twenty-call agentic trace, you can see which span is using the most tokens and read the prompt that caused it. Both live in Elastic APM, so there is no second tool to run.
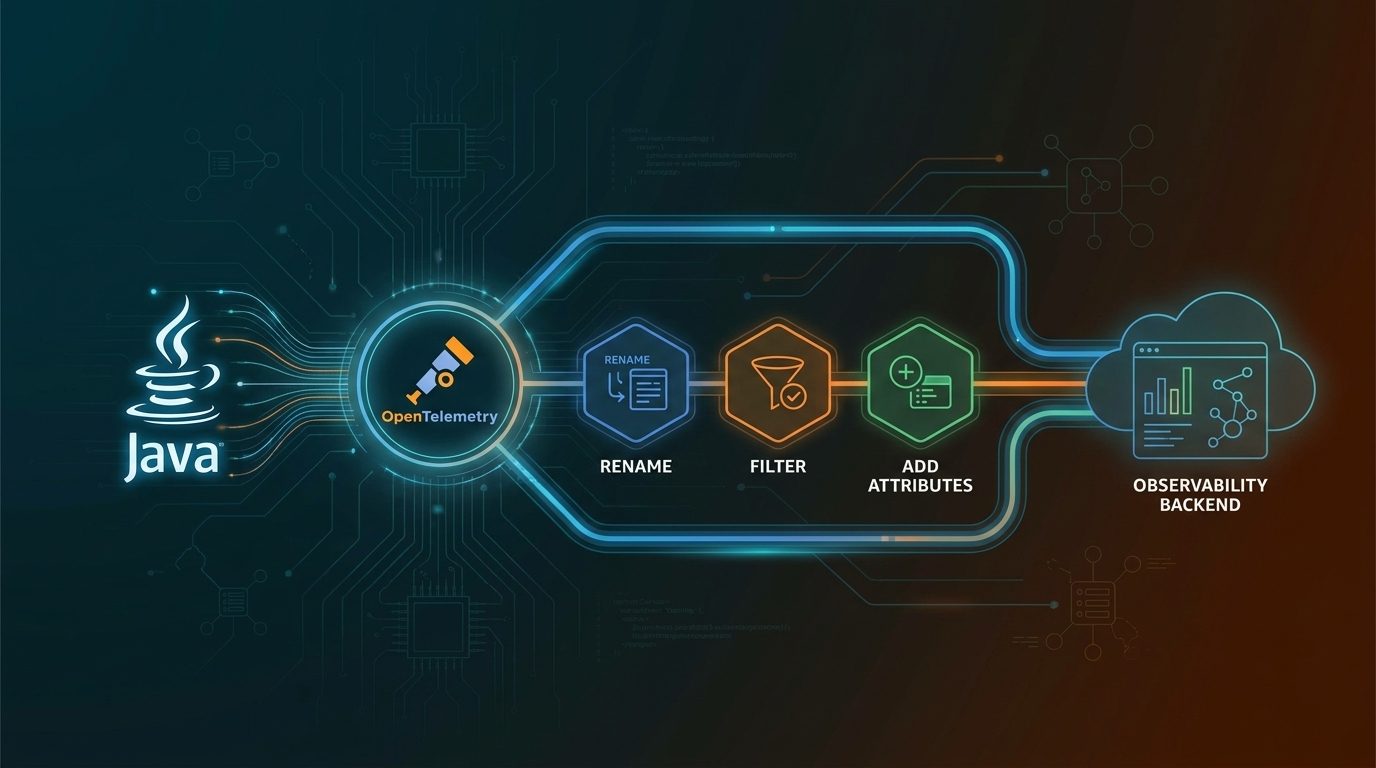
OpenTelemetry Java extensions: customize traces without forking the agent
One JAR, loaded at startup by the OpenTelemetry Java agent, lets you filter health checks, rename spans, add resource attributes, and control sampling with no application code changes.

Elastic Agent now runs as an OpenTelemetry Collector: Less memory overhead, zero config changes
Elastic Agent 9.3 sends logs, metrics and traces through one OTel Collector pipeline, running Beats integrations alongside native OTel sources in a single Fleet-managed agent.
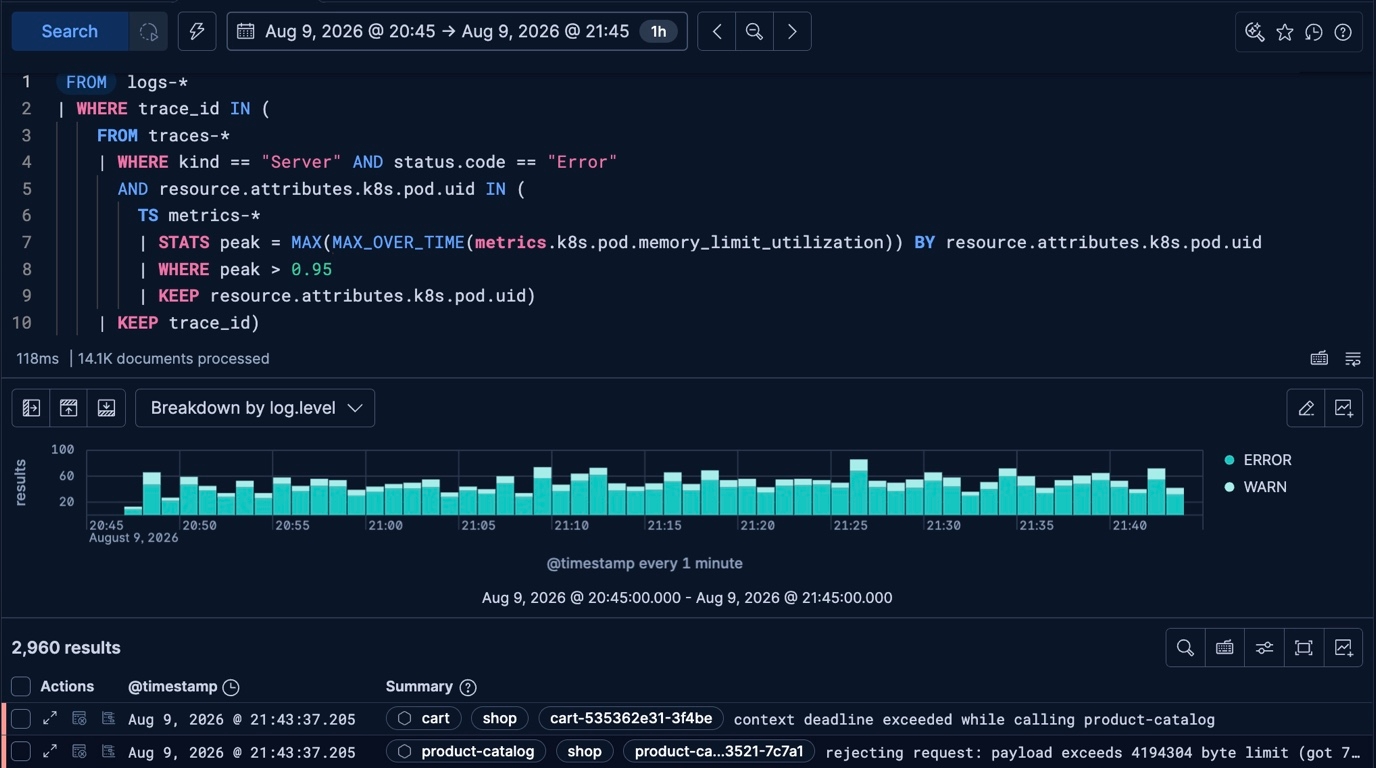
Correlate logs, metrics, and traces in one ES|QL query
Walk through four investigations, from CPU saturation to pod memory pressure, each answered by a single query across signal types.
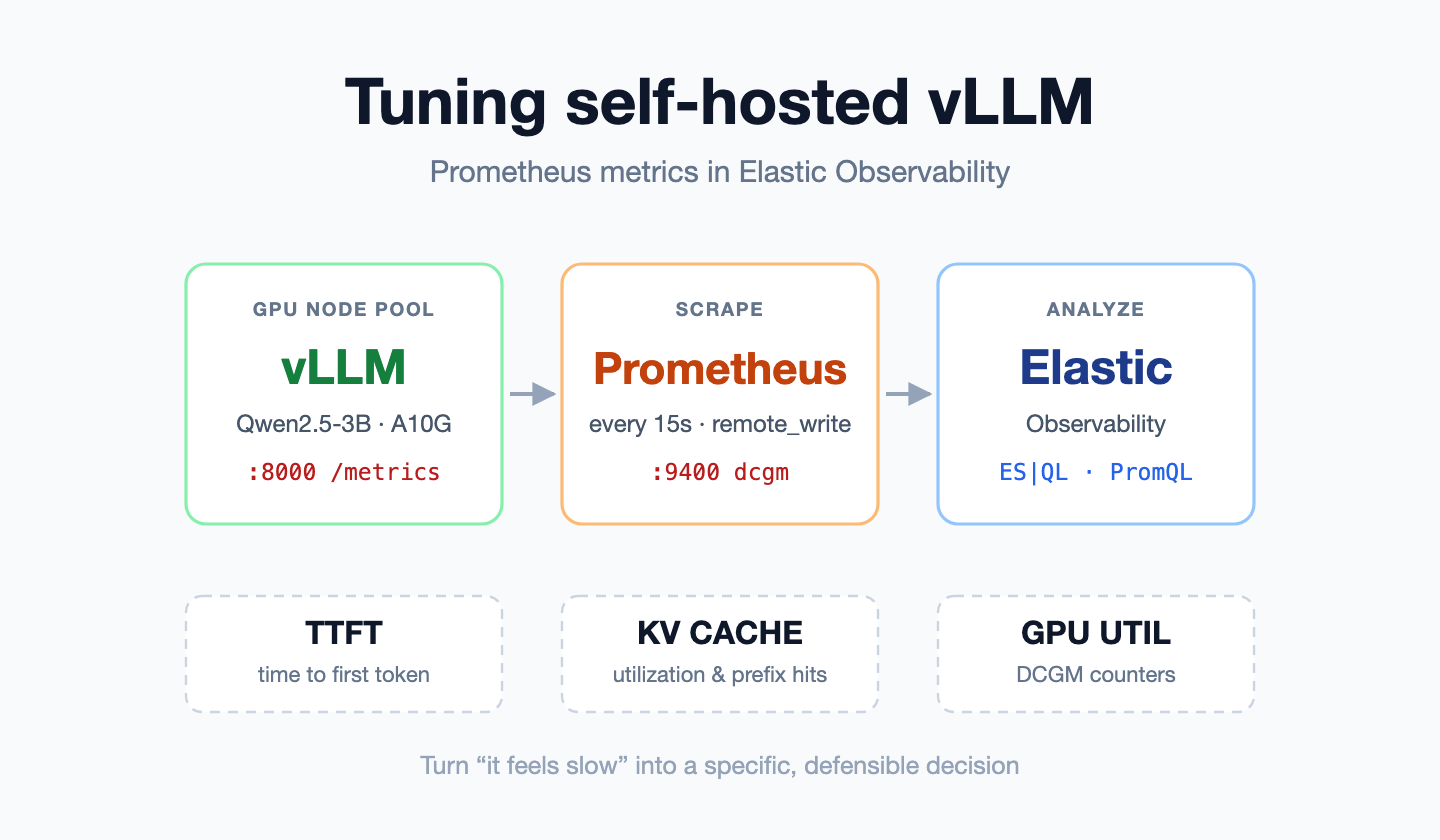
vLLM Prometheus metrics for self-hosted LLM tuning: TTFT, KV Cache, and GPU Utilization
Tuning a self-hosted vLLM inference using its Prometheus metrics in Elastic Observability — TTFT, KV cache, prefix caching and DCGM GPU counters

Android application monitoring with OpenTelemetry: distributed tracing from tap to backend
EDOT Android adds mobile APM to your Android app with one Gradle dependency: crash reporting, session tracking and distributed tracing visible in Kibana.
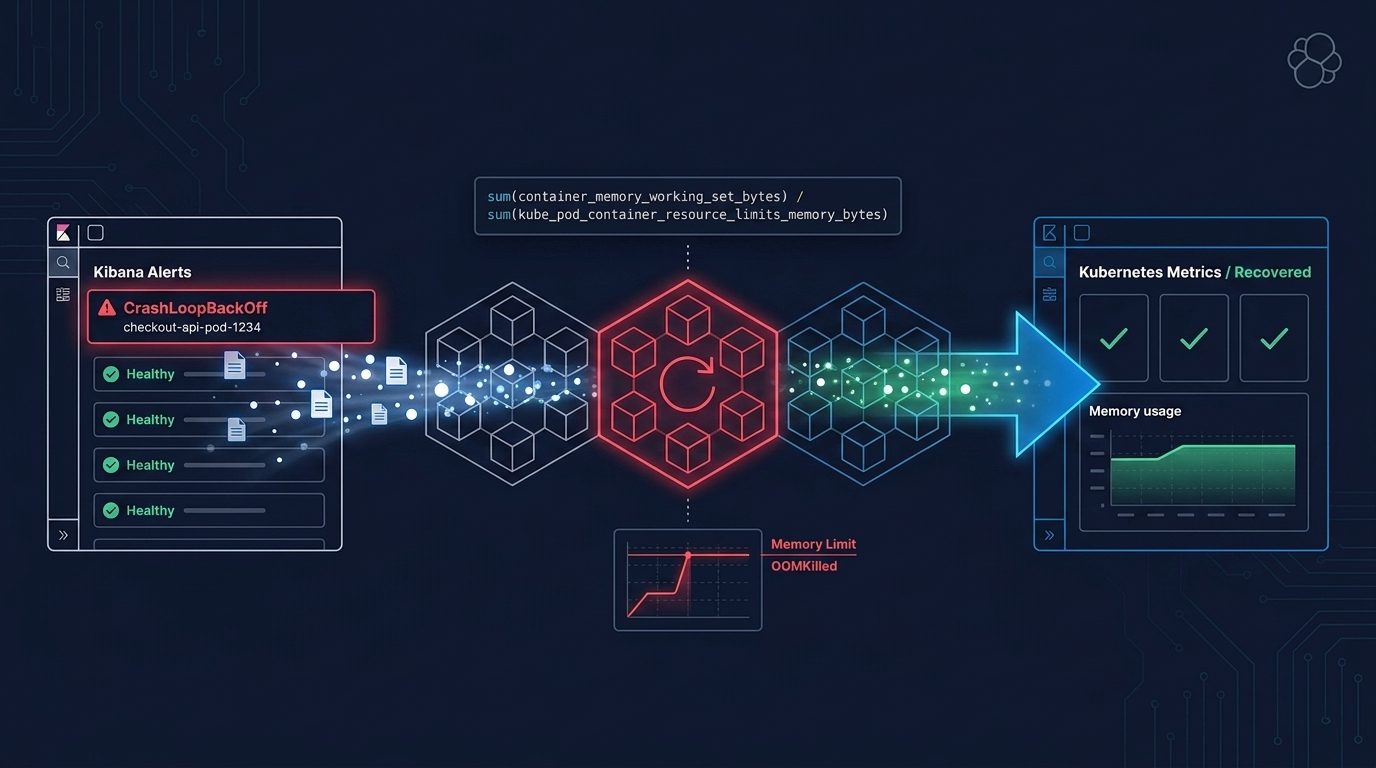
From CrashLoopBackOff to OOMKilled with PromQL in Elasticsearch and Kibana
Use PromQL in Elasticsearch and Kibana to move from a CrashLoopBackOff alert to OOMKilled, memory versus the limit, and a verified fix.
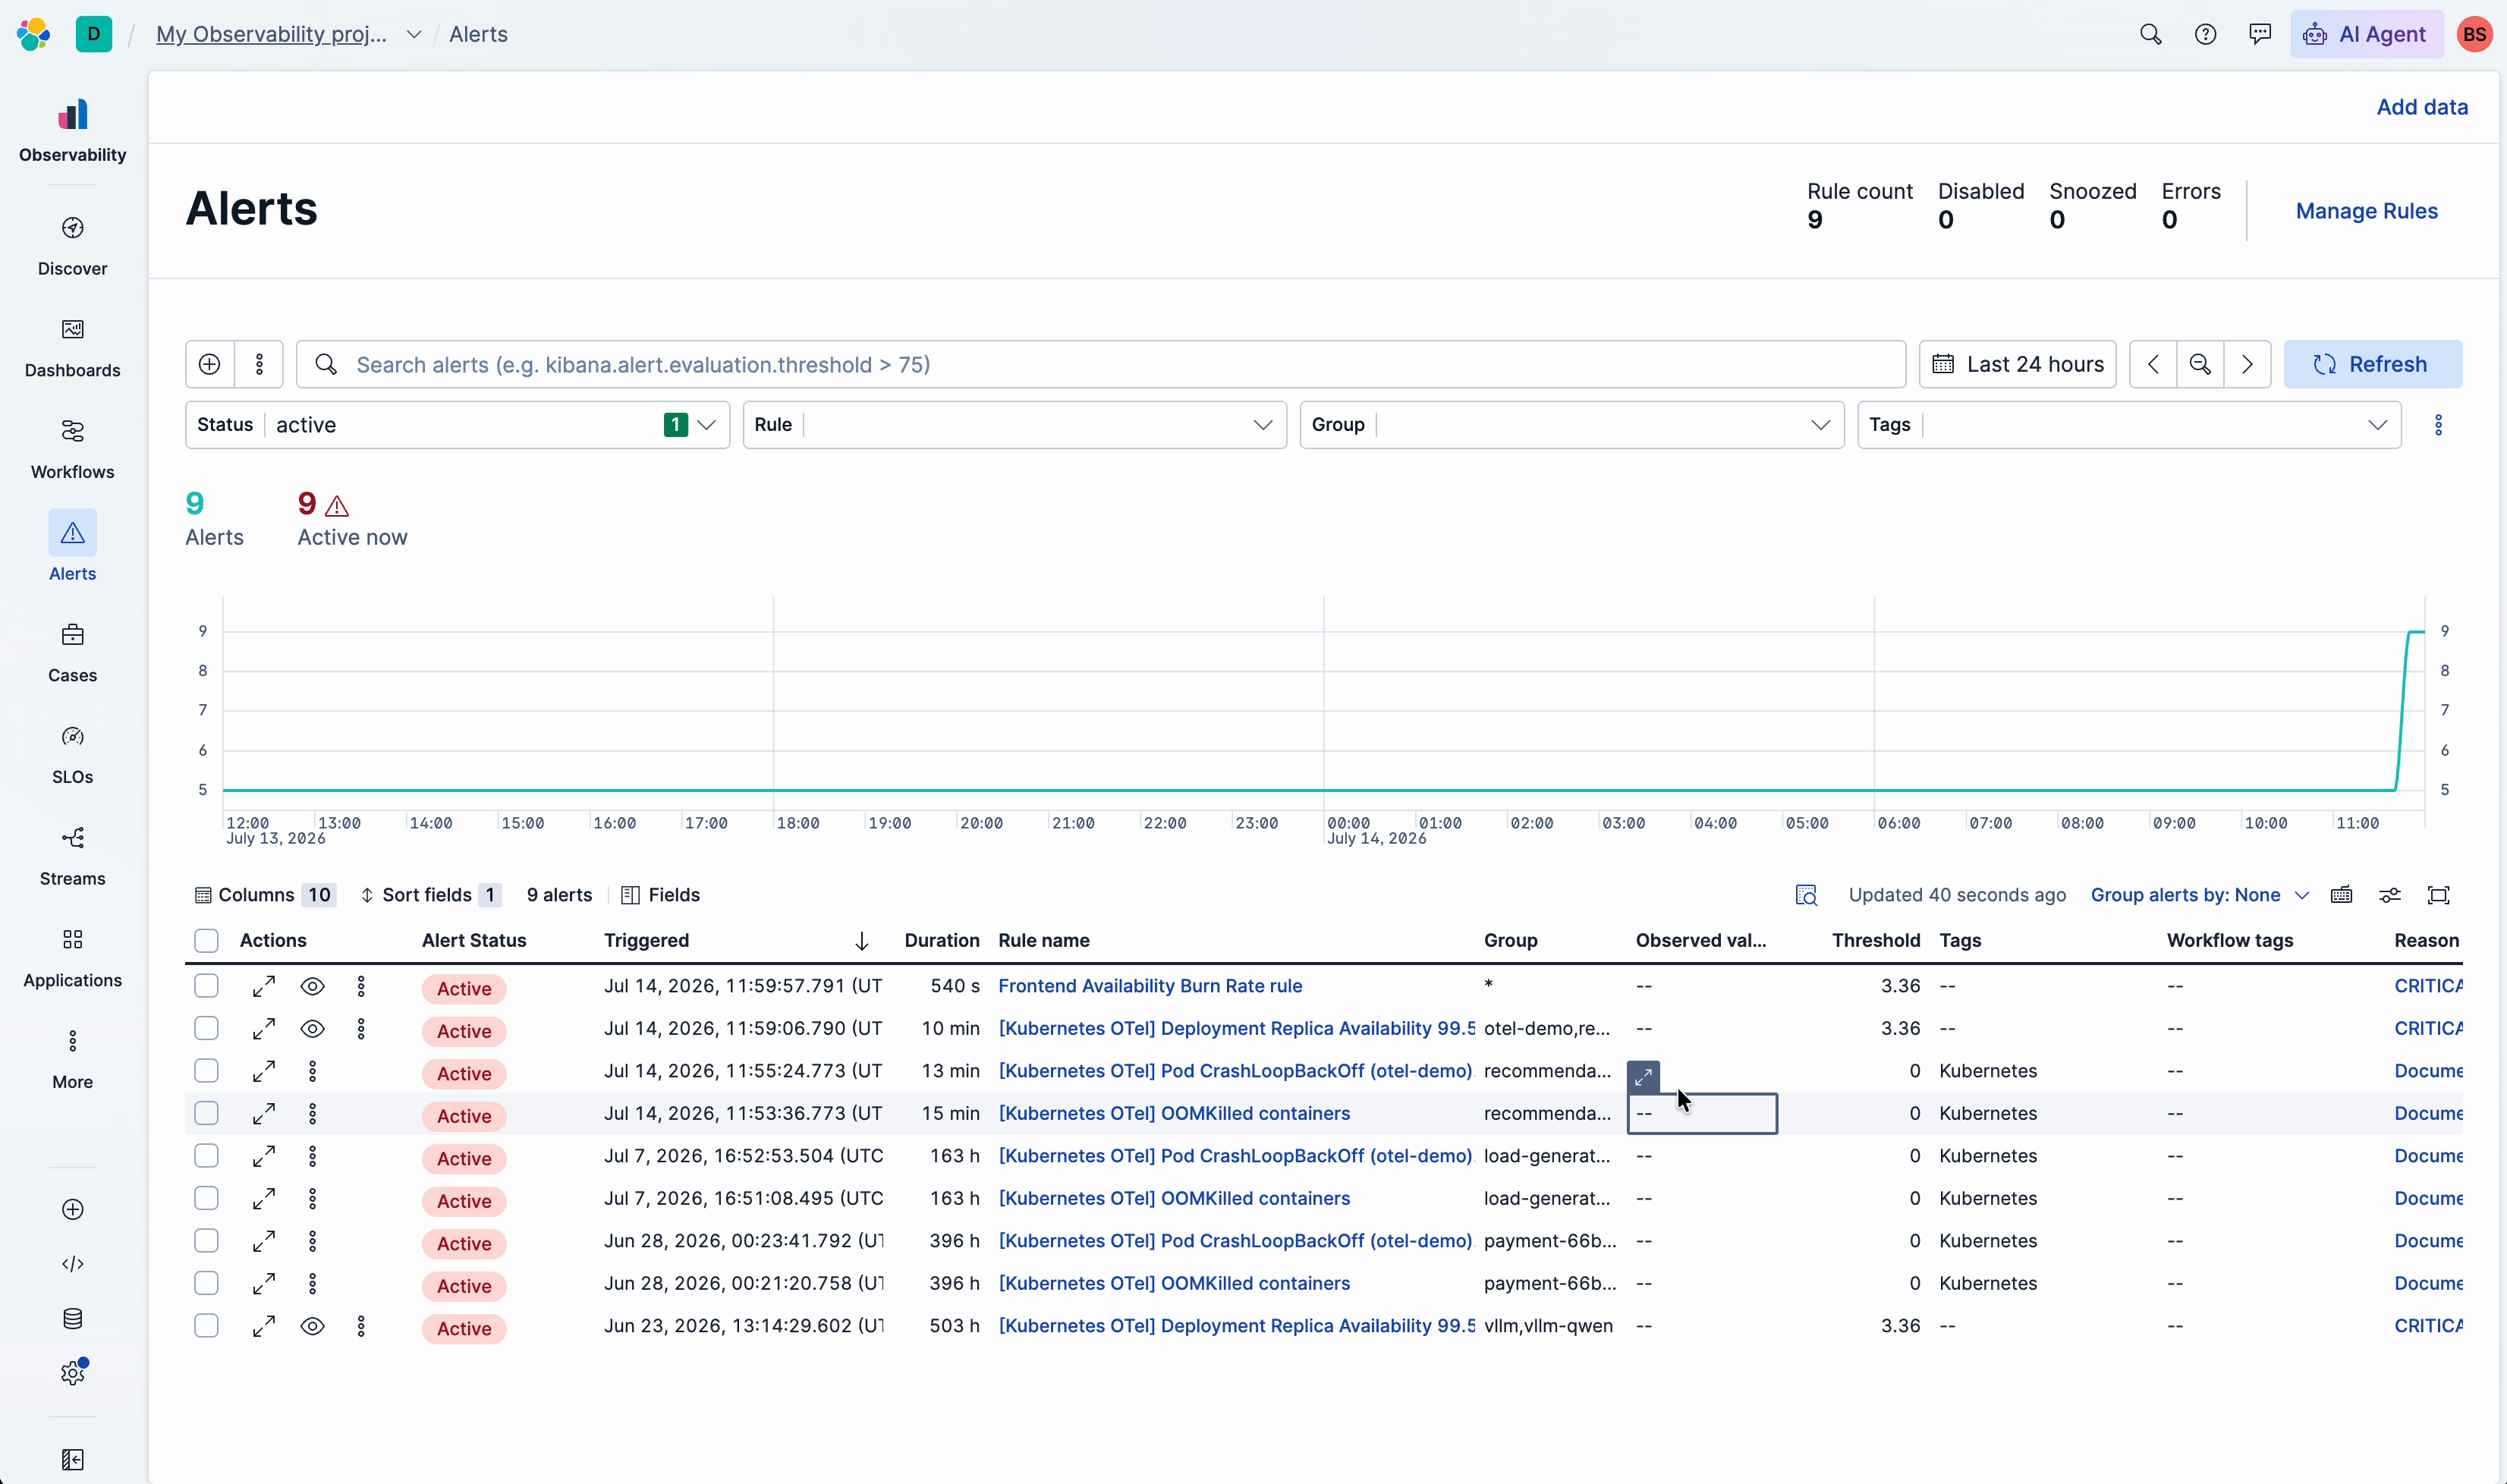
CrashLoopBackOff to root cause in seconds: automating the 20-minute Kubernetes investigation with Elastic Observability
Elastic's Kubernetes Experience fires alongside the CrashLoopBackOff alert and delivers a root-cause hypothesis with evidence before you even open it.
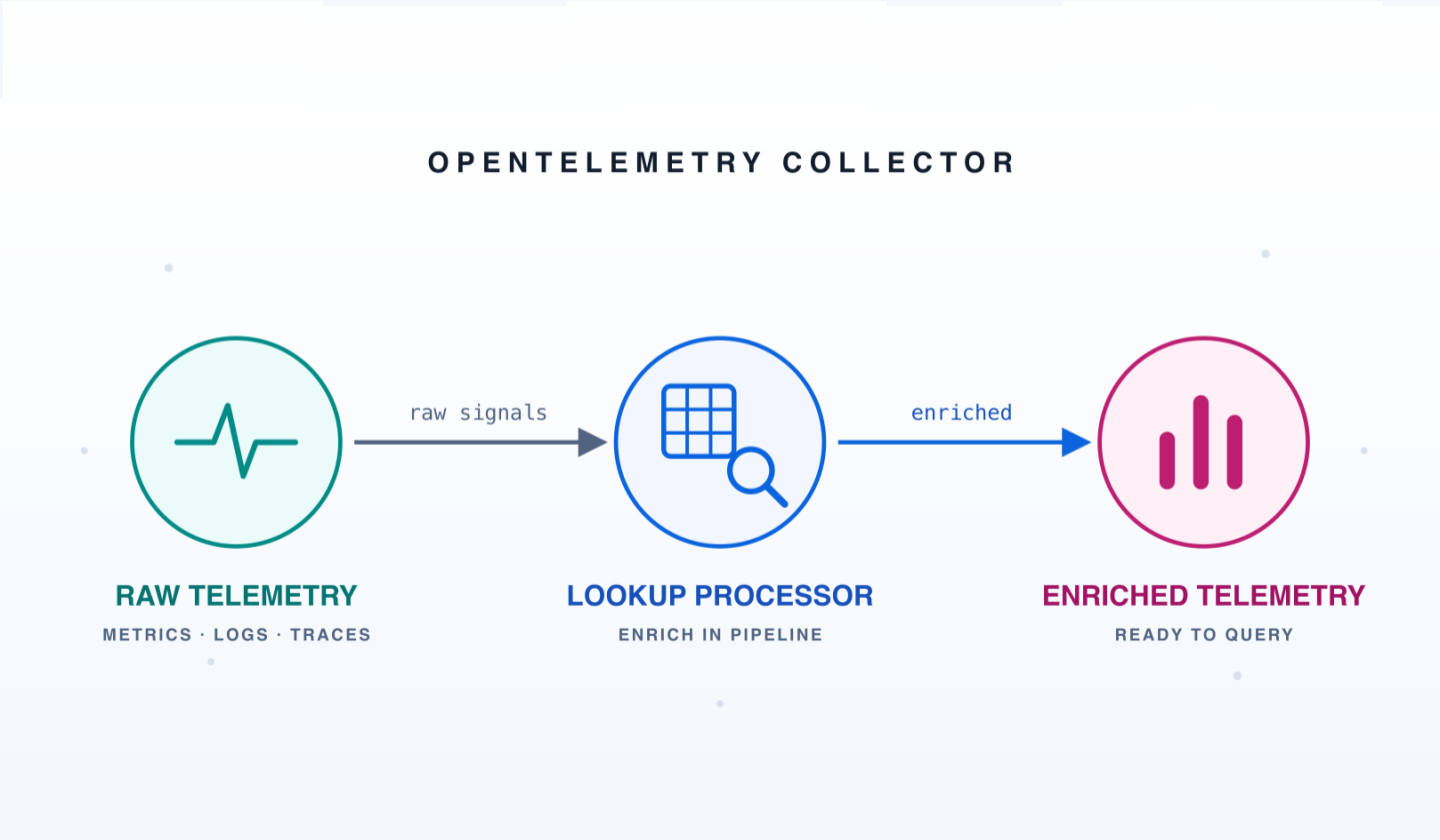
You have the IP, you want the hostname: building a lookup processor for OpenTelemetry
Look up any value from YAML, CSV or DNS inside the OpenTelemetry Collector or wire in your own source through a processor Elastic built and shipped to Collector Contrib.