
Kubernetes node pressure: Catching the memory drop 7 minutes before the first pod eviction
The pod you lose is rarely the pod that grew. This walkthrough follows a per-node anomaly detection alert all the way to the pod whose working set moved.
.jpg)
Kubernetes attributes processor v1: What it means for EDOT Collector
Default EDOT Collector setups are fine. Anything custom that queries labels, annotations or container.image.tag quietly stops returning data after EDOT 9.6.

AI agent observability for Microsoft Foundry: two env vars, no collector
Set up LLM tracing once and every model call, tool execution and handoff from your Foundry agent arrives in Kibana as one queryable trace, with token counts on each span and code for Agent Framework, LangGraph and Node.js.
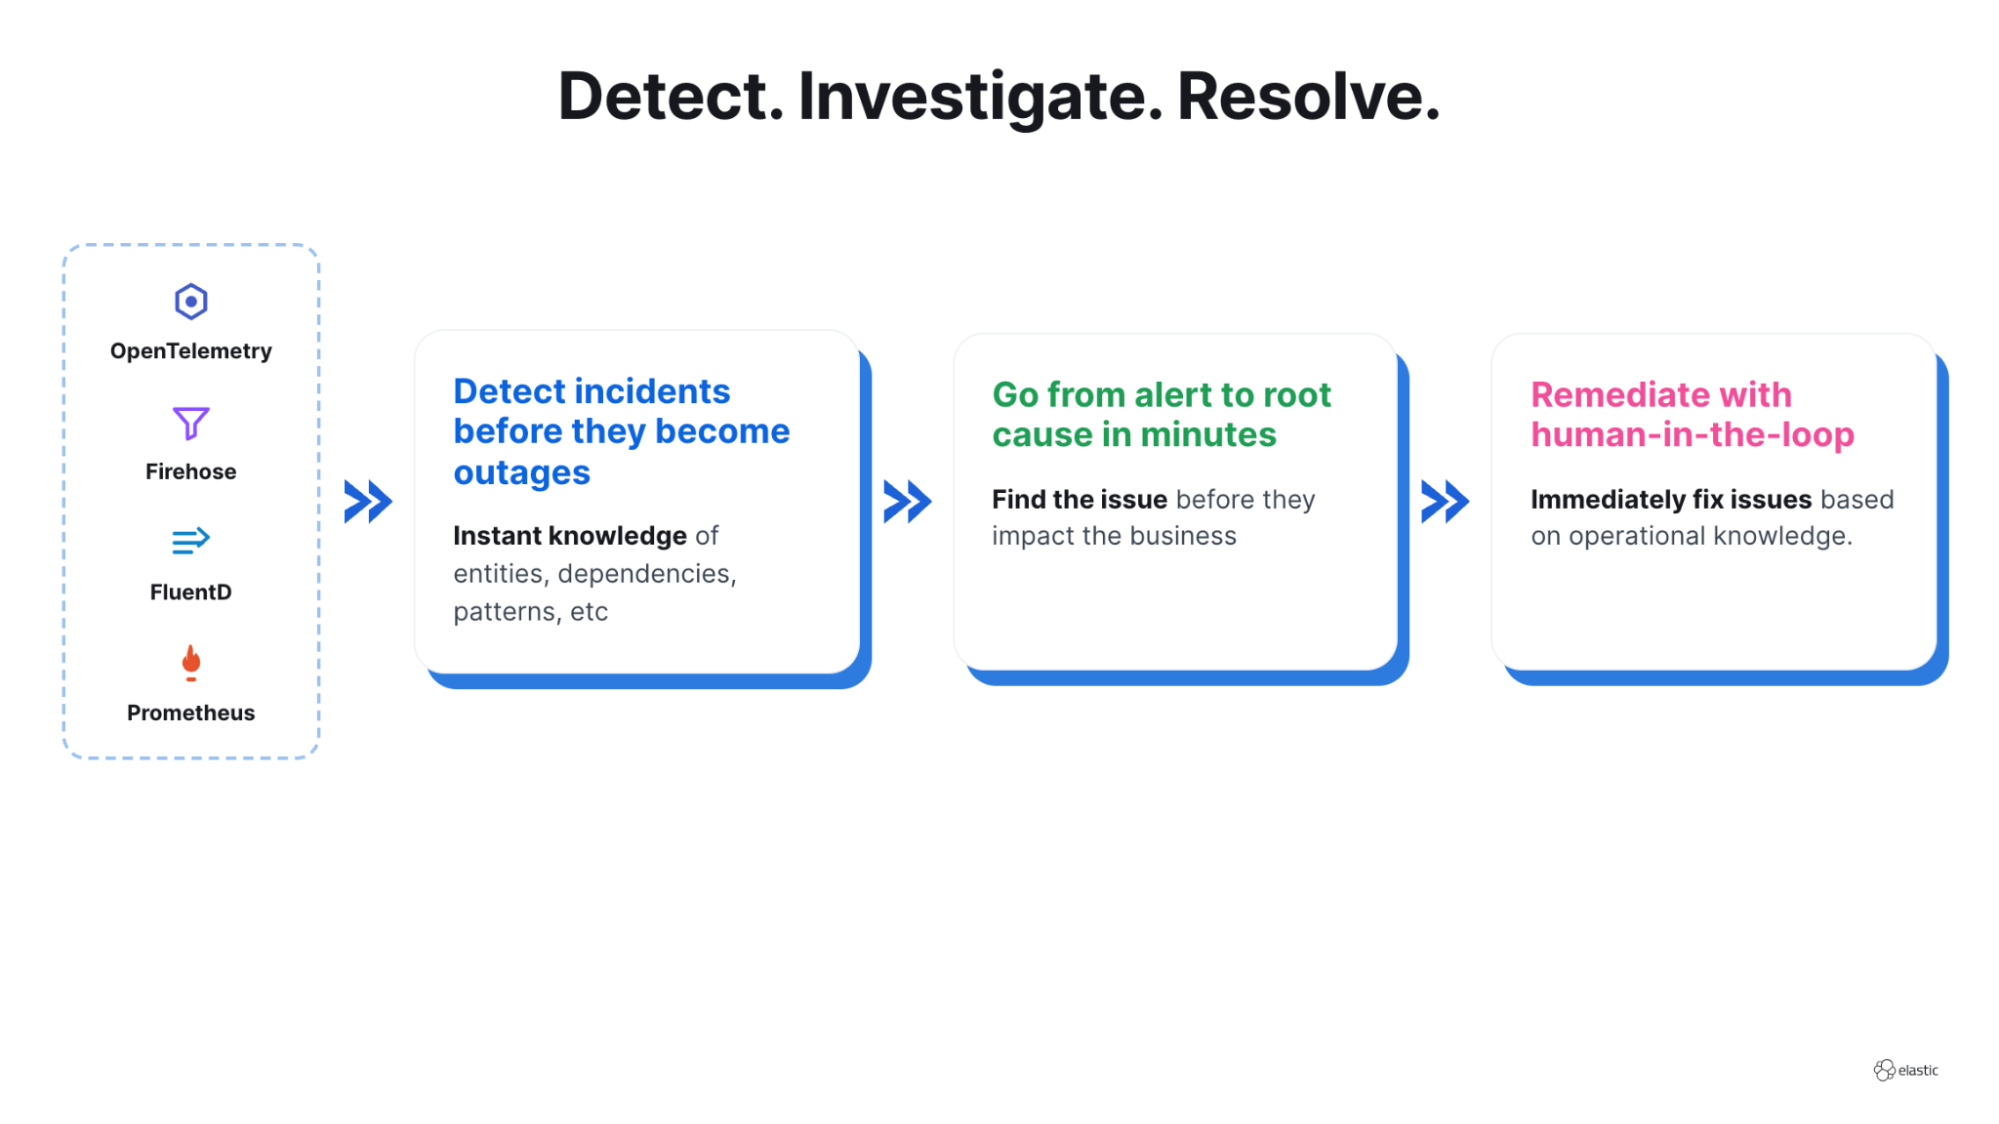
Sleep through the 3am page: automated incident response with Elastic on Red Hat OpenShift
Elastic Observability handles three routine incidents on its own: it scales, restarts or rolls back the workload, then confirms the service recovered, all with the reasoning model inside your own cluster.
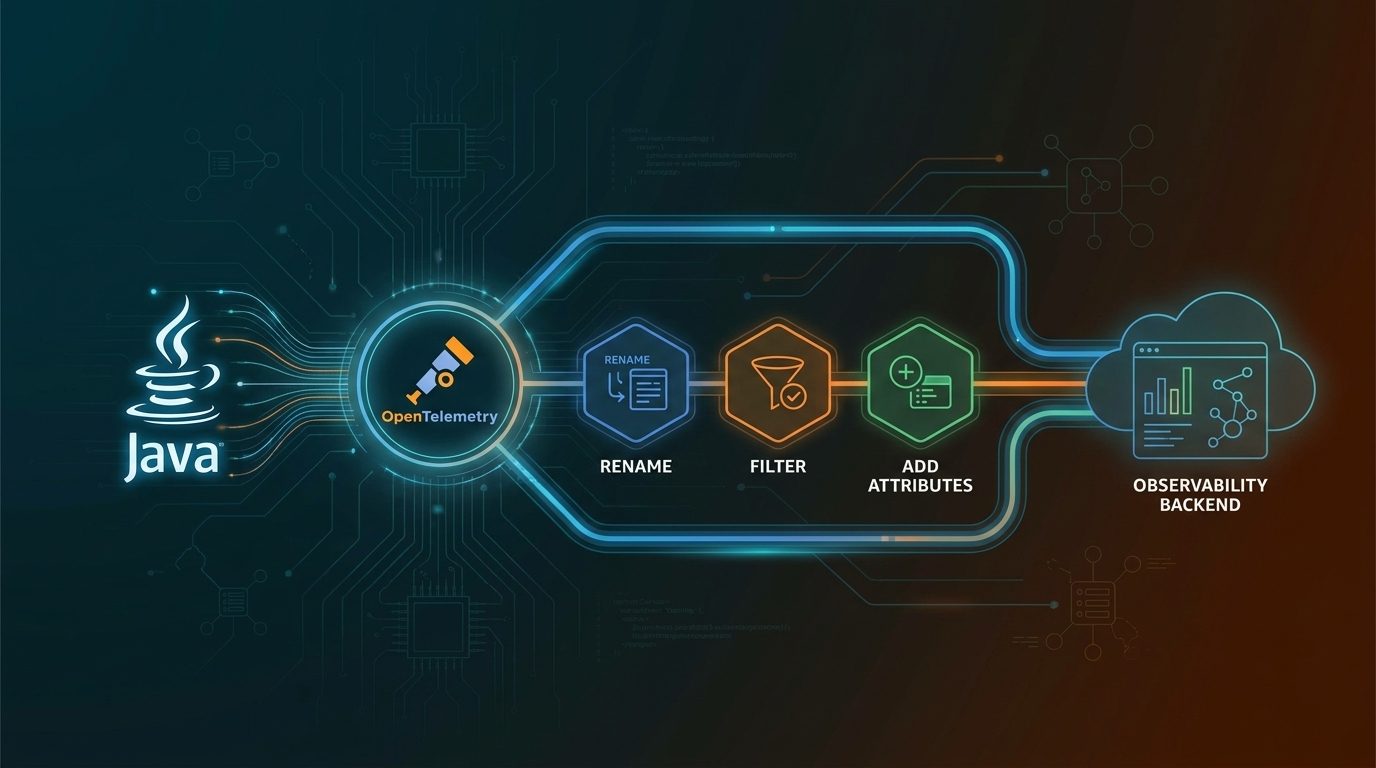
OpenTelemetry Java extensions: customize traces without forking the agent
One JAR, loaded at startup by the OpenTelemetry Java agent, lets you filter health checks, rename spans, add resource attributes, and control sampling with no application code changes.
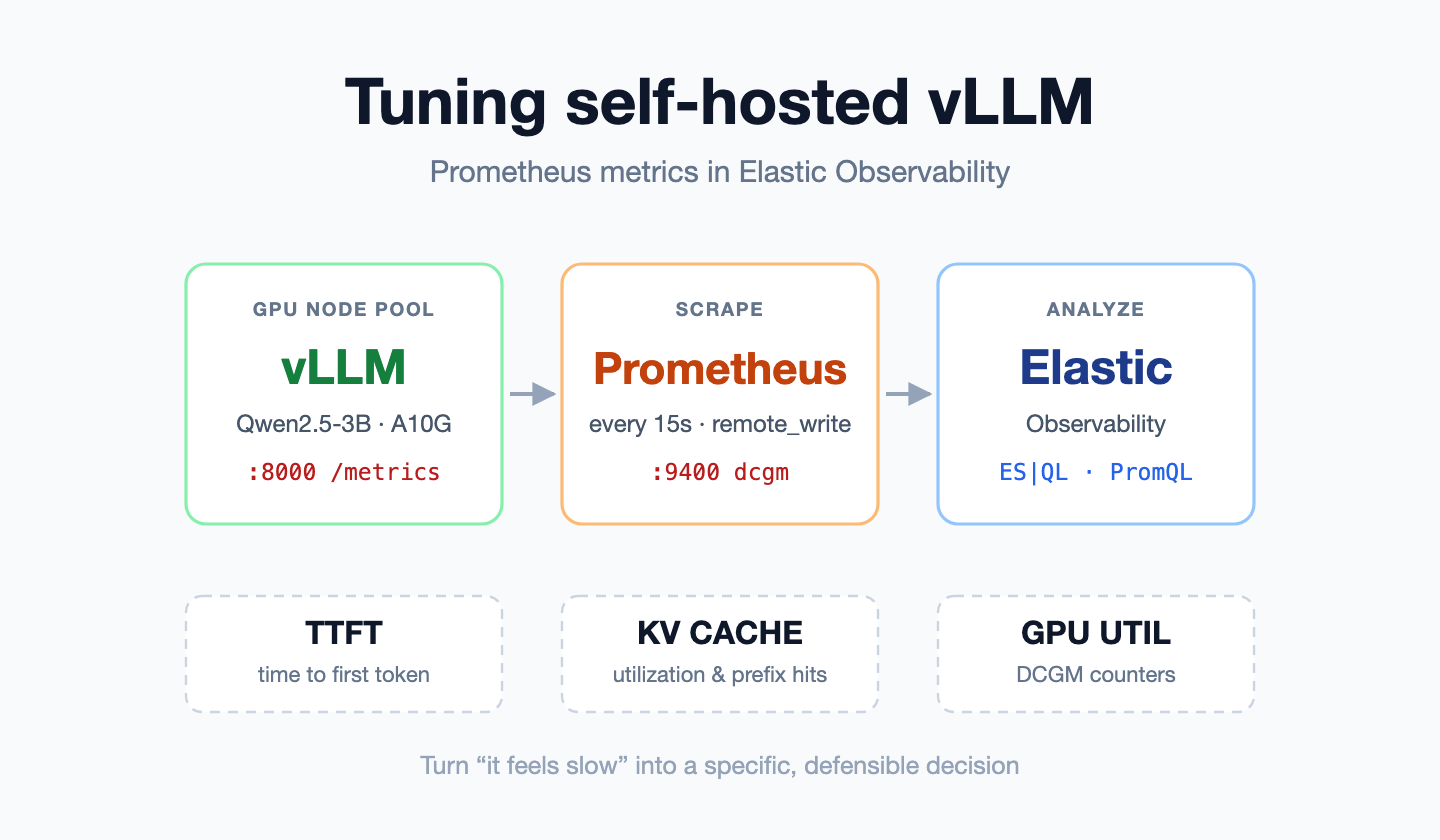
vLLM Prometheus metrics for self-hosted LLM tuning: TTFT, KV Cache, and GPU Utilization
Tuning a self-hosted vLLM inference using its Prometheus metrics in Elastic Observability — TTFT, KV cache, prefix caching and DCGM GPU counters
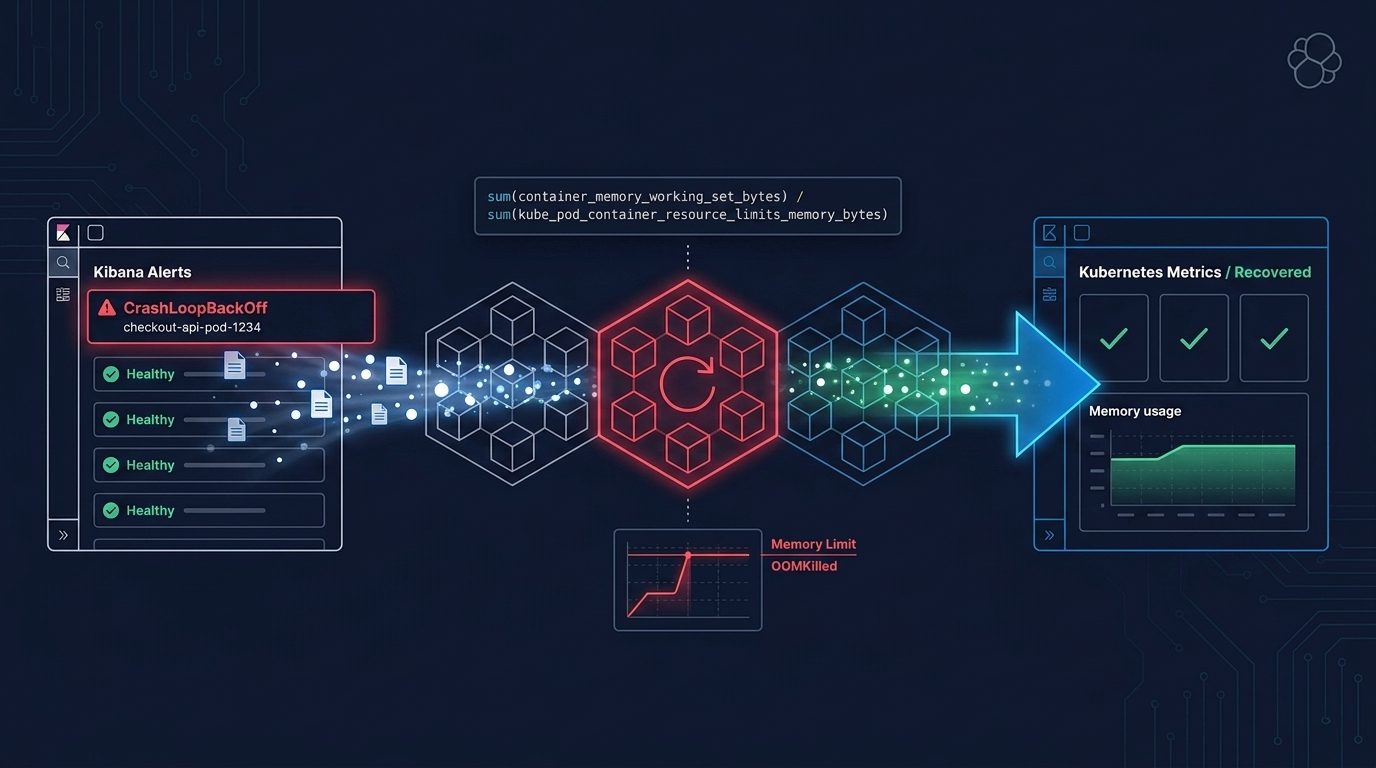
From CrashLoopBackOff to OOMKilled with PromQL in Elasticsearch and Kibana
Use PromQL in Elasticsearch and Kibana to move from a CrashLoopBackOff alert to OOMKilled, memory versus the limit, and a verified fix.
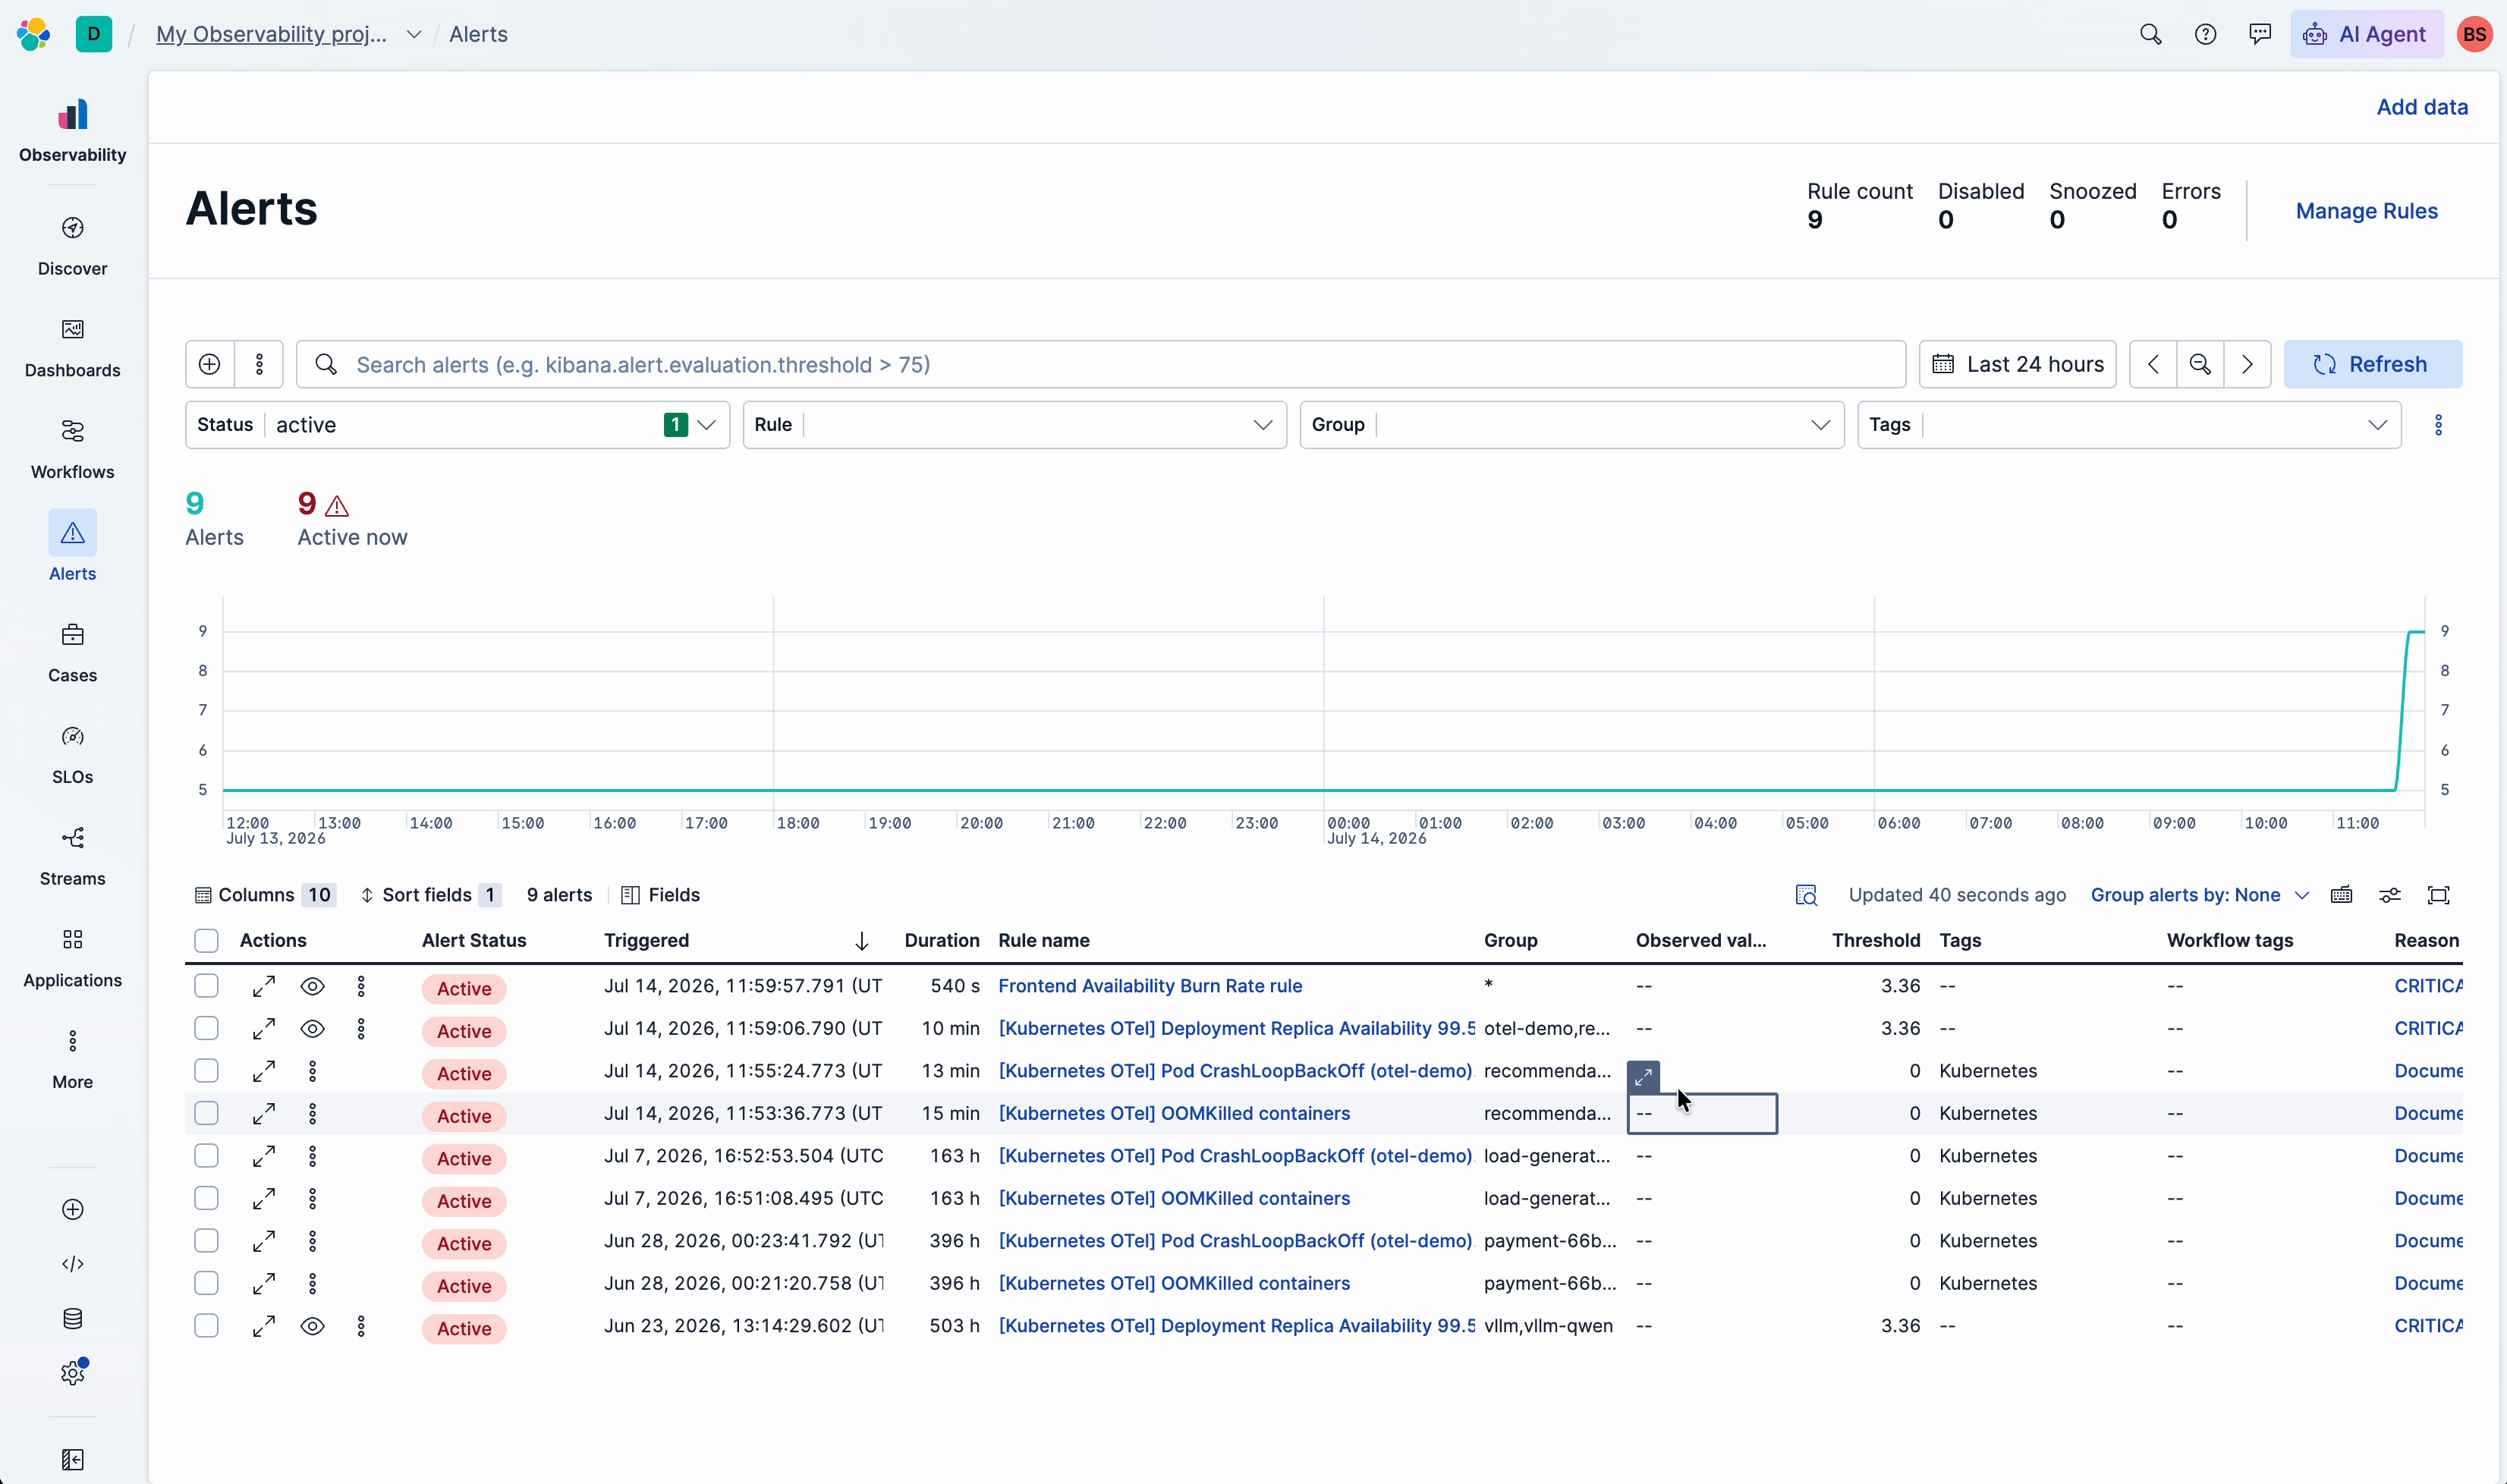
CrashLoopBackOff to root cause in seconds: automating the 20-minute Kubernetes investigation with Elastic Observability
Elastic's Kubernetes Experience fires alongside the CrashLoopBackOff alert and delivers a root-cause hypothesis with evidence before you even open it.
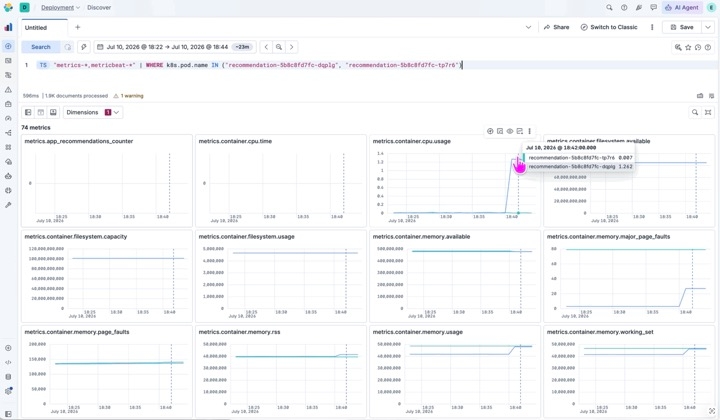
Four clicks from alert to root cause: how Elastic Observability links APM services to Kubernetes infrastructure
Check service dependencies and compare per-pod CPU, memory and network trends on the Infrastructure tab to find which instance is causing trouble, all without leaving the alert investigation.

Migrate Datadog Kubernetes dashboards to Elastic Observability in under an hour
See how the migration CLI translates a real Datadog Kubernetes dashboard into validated Kibana panels and uploads it to your cluster in under an hour, no manual widget rebuilds required.
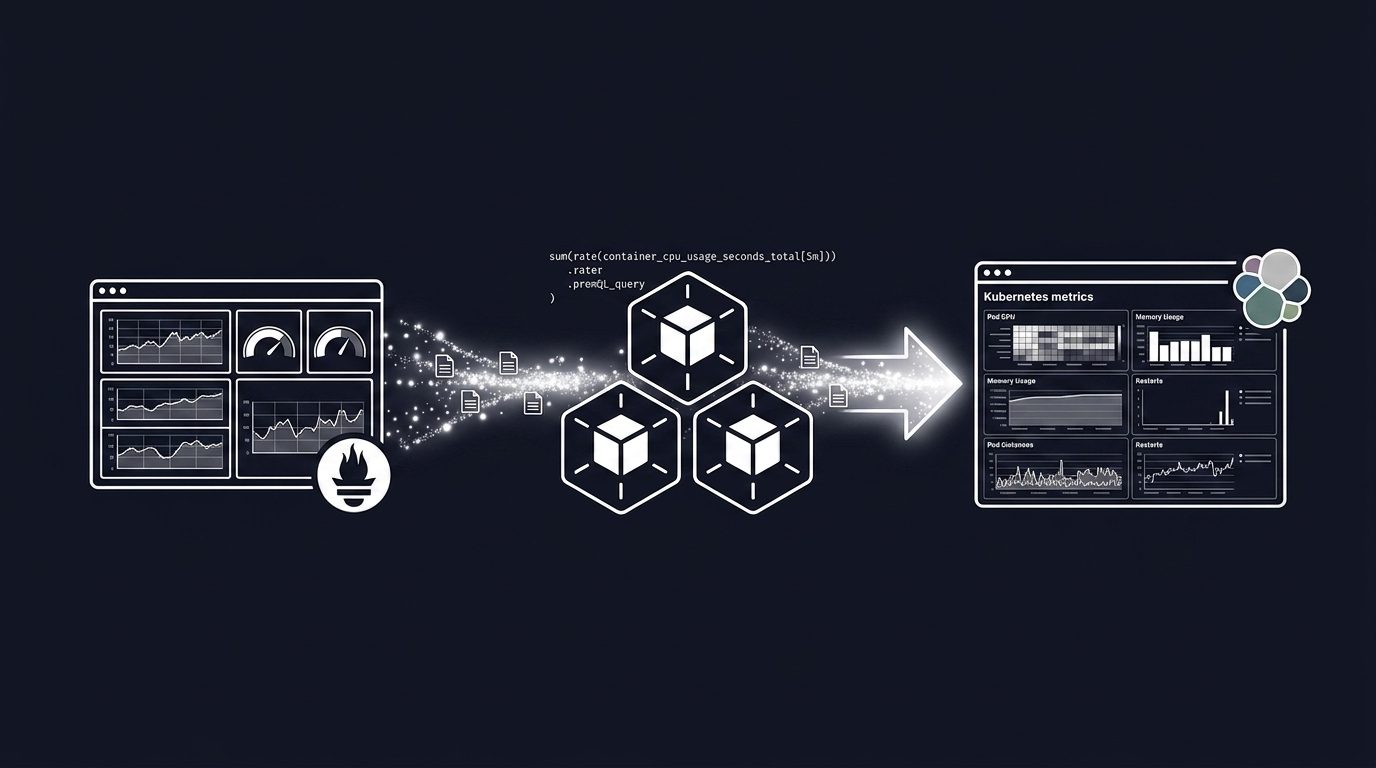
Migrate your Grafana Kubernetes dashboard to Elastic Observability: same PromQL, 30x faster queries
Take a real Grafana Kubernetes dashboard covering pod CPU, memory, node pressure, and restart counts, then migrate it into Elastic Observability with native PromQL in under an hour.
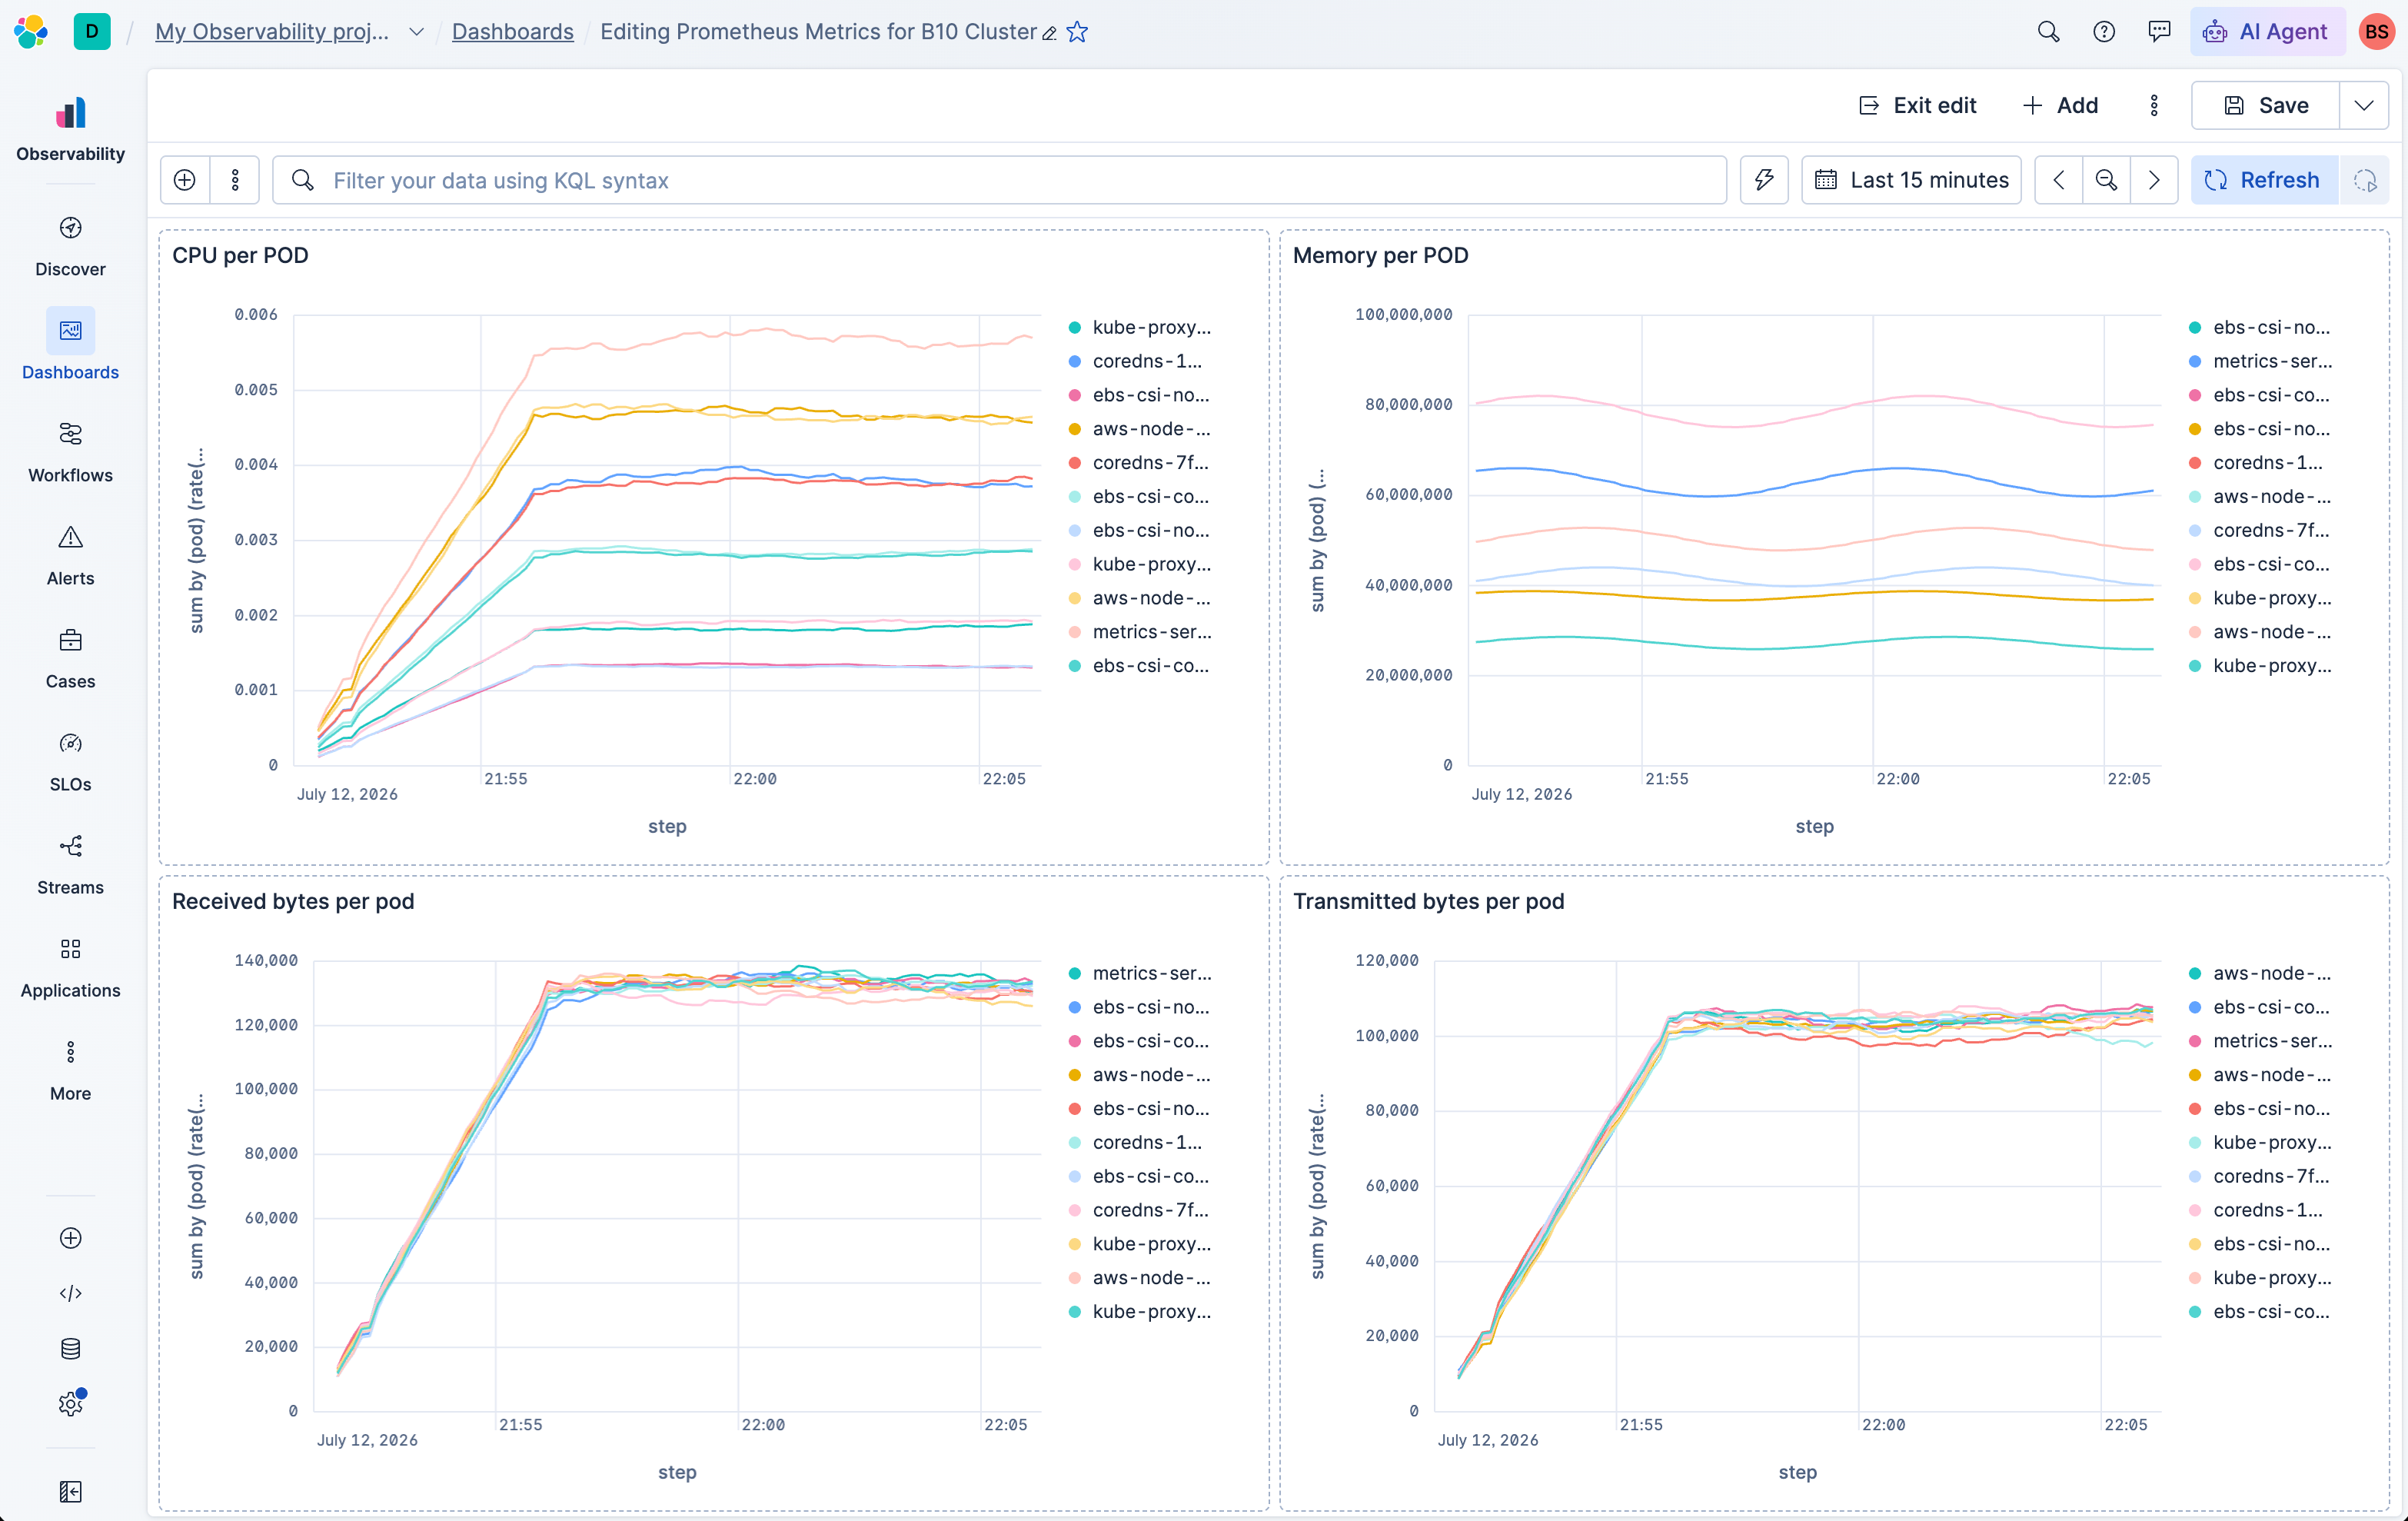
Prometheus metrics in Elastic Observability: your PromQL runs unchanged
Point Prometheus from your Kubernetes cluster at Elastic Observability with one config block. PromQL runs unchanged, keep your PromQL no cardinality billing.