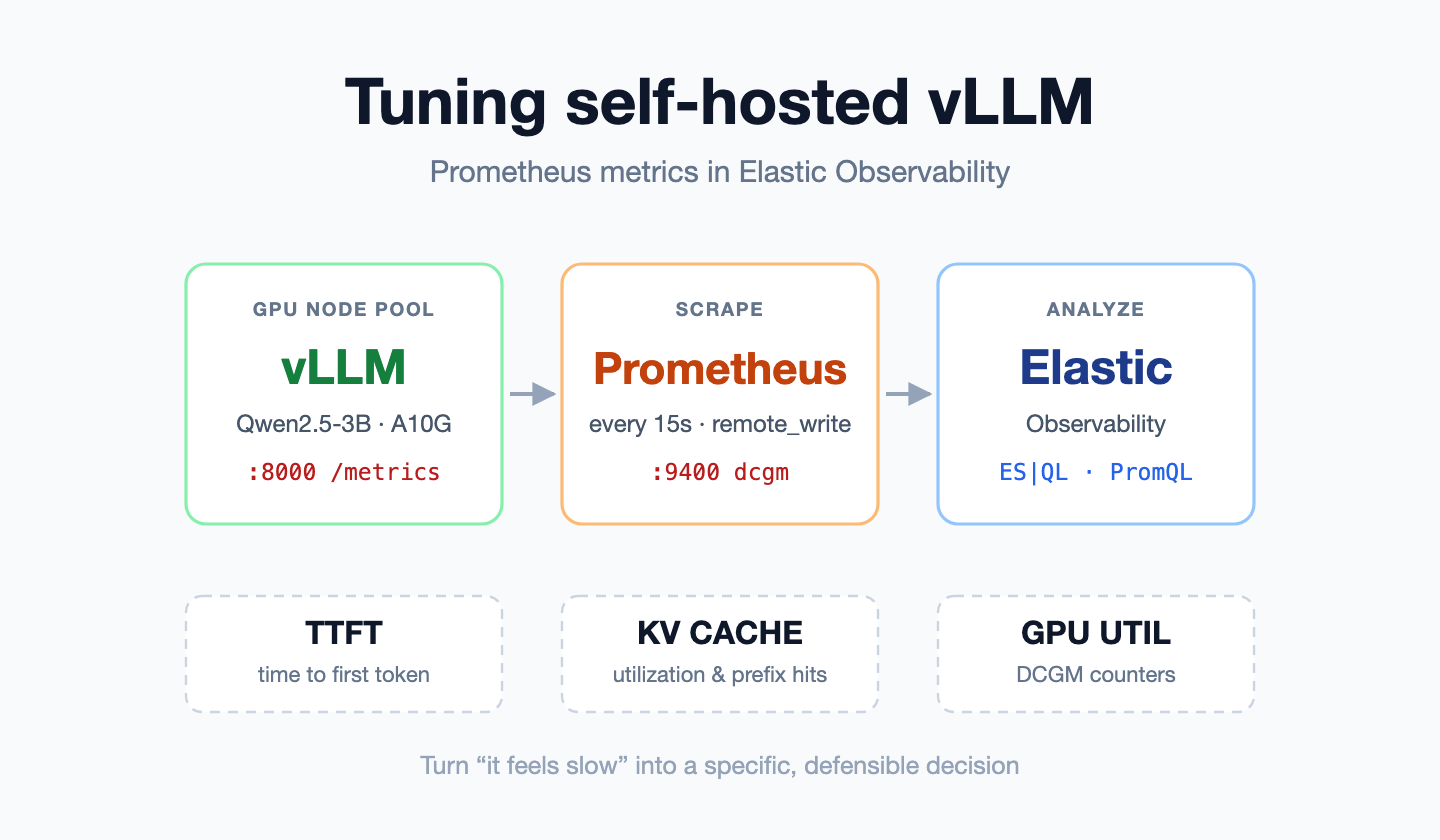
Migrate your Grafana Kubernetes dashboard to Elastic Observability: same PromQL, 30x faster queries
Take a real Grafana Kubernetes dashboard covering pod CPU, memory, node pressure, and restart counts, then migrate it into Elastic Observability with native PromQL in under an hour.
Monitor clusters, pods, and nodes with full application context across EKS, GKE, AKS, and OpenShift.
Join our on-demand webinar: Kubernetes management with Elastic & agentic AI to level up your skills. You can also start a free cloud trial, or run Elasticsearch locally.
Elasticsearch now runs PromQL natively. Migrate a Grafana Kubernetes / Views / Global dashboard into Elastic Observability with the Observability Migration Platform. The sample board covers pod CPU, working set memory, throttling signals, and container restart counts. With Kubernetes metrics already in Elasticsearch, the translation, validation, and upload steps typically fit in under an hour.
The migration tool keeps panel queries in PromQL instead of rewriting them into a new dialect, validates them when you pass --validate, and uploads compiled dashboards to Kibana. You still review the migration report and enable alerts on your schedule.
Sample Grafana Kubernetes dashboard used in this migration
The walkthrough uses Kubernetes / Views / Global, a community-style Grafana dashboard in the migration repository. It includes the signals operators check during an incident: namespace CPU and memory, throttling pressure, and restart counts.
Below are representative PromQL queries from the source dashboard:
# Pod / container CPU by namespace
sum(rate(container_cpu_usage_seconds_total{image!="", cluster="$cluster"}[$__rate_interval])) by (namespace)
# Memory working set by namespace
sum(container_memory_working_set_bytes{image!="", cluster="$cluster"}) by (namespace)
# Node / CPU pressure style signal: throttled seconds
sum(rate(container_cpu_cfs_throttled_seconds_total{image!="", cluster="$cluster"}[$__rate_interval])) by (namespace) > 0
# Container restart counts
sum(increase(kube_pod_container_status_restarts_total{cluster="$cluster"}[$__rate_interval])) by (namespace) > 0
If this board translates cleanly, most production Grafana Kubernetes folders are worth testing with the same workflow.
Why Grafana-to-Elastic migration is faster now
The migration platform automates the query translation and panel rebuilds that used to dominate Grafana moves. Native Prometheus Remote Write and PromQL in Kibana let you keep the dialect your on-call team already uses. The --native-promql flag passes PromQL through unchanged. See Elasticsearch as a metrics engine for storage and query context.
Prerequisites
You need an Elastic Observability Serverless project, a project API key, and the migration CLI installed from the observability-migration-platform repository.
Export your endpoints and API key:
export ELASTICSEARCH_ENDPOINT="https://YOUR_ES_ENDPOINT"
export KIBANA_ENDPOINT="https://YOUR_KIBANA_ENDPOINT"
export KEY="YOUR_API_KEY"
Install the CLI and confirm the toolchain:
python3 -m venv .venv
.venv/bin/pip install ".[all]"
.venv/bin/obs-migrate doctor
The doctor command checks compile and lint dependencies. Resolve any errors before you migrate production dashboards. Pin a release tag if you plan to run this in CI.
How do you get Kubernetes metrics into Elasticsearch?
Empty panels after upload usually mean Elasticsearch does not yet have the series the PromQL references. Make sure to confirm ingest before you run the migration.
There are two common paths to do so:
- Prometheus Remote Write into Elasticsearch from kube-state-metrics, cAdvisor or kubelet metrics, and node exporters.
- OpenTelemetry into managed OTLP for Kubernetes receivers, then explore in Discover.
Test with a query such as sum(rate(container_cpu_usage_seconds_total[5m])) by (namespace) against Elastic. If that returns data, continue. If it does not, fix ingest first.
Run the Grafana dashboard migration CLI
Export your Grafana dashboard JSON, or copy the sample k8s-views-global.json from infra/grafana/dashboards/ in the migration repo. Place files in a directory such as ./grafana_k8s_exports/.
Run the migration from that directory:
grafana-migrate \
  --source files \
  --input-dir ./grafana_k8s_exports \
  --output-dir ./migration_output \
  --assets all \
  --native-promql \
  --data-view "metrics-*" \
  --esql-index "metrics-*" \
  --upload \
  --kibana-url "$KIBANA_ENDPOINT" \
  --kibana-api-key "$KEY" \
  --ensure-data-views \
  --create-alert-rules \
  --validate \
  --es-url "$ELASTICSEARCH_ENDPOINT" \
  --es-api-key "$KEY"
These flags matter for Kubernetes boards:
--native-promqlkeeps pod CPU, memory, throttling, and restart queries in PromQL--assets allincludes dashboards and Grafana PromQL alert definitions when present--validateruns emitted queries against Elasticsearch before upload--create-alert-rulescreates Kibana rules in a disabled state
The unified CLI performs the same work:
obs-migrate migrate \
  --source grafana \
  --input-mode files \
  --input-dir ./grafana_k8s_exports \
  --output-dir ./migration_output \
  --assets all \
  --native-promql \
  --data-view "metrics-*" \
  --validate \
  --es-url "$ELASTICSEARCH_ENDPOINT" \
  --es-api-key "$KEY" \
  --kibana-url "$KIBANA_ENDPOINT" \
  --kibana-api-key "$KEY" \
  --upload \
  --create-alert-rules
Validate the migrated Grafana dashboard in Kibana
Open Kibana → Dashboards and locate Kubernetes / Views / Global. Confirm that namespace or pod CPU utilization, memory working set panels, throttling or pressure widgets, and restart charts return data for your selected time range.
If you migrated alerts, open Observability → Rules. Imported rules remain disabled until you enable them after reviewing thresholds.
The CLI also writes local artifacts under ./migration_output/:
dashboards/yaml/contains the translated dashboard definition.dashboards/migration_report.jsonlists panels that translated automatically and panels flagged for manual review.alerts/contains alert translations when alert definitions were included in the export.
What do you do when Grafana panels don't migrate automatically?
The Observability Migration Platform flags PromQL expressions that do not translate automatically. Hard joins, unusual arithmetic, and a few Alertmanager-era edge cases appear as manual-review entries in the migration report rather than as silently broken charts.
| Result | Recommended action |
|---|---|
| Panel returns data | Accept the translation and continue |
| Panel is empty | Confirm metric names exist in metrics-*, then widen or shift the time range |
| Manual-review marker | Open the original PromQL and simplify or redesign the panel |
| Alert never fires | Confirm the rule is enabled and thresholds match your environment |
This path migrates Grafana PromQL dashboards and Grafana unified PromQL alert definitions into Kibana. It does not ingest a raw alertmanager.yml. The goal is to keep the PromQL your pager already trusts instead of rebuilding the Kubernetes board from zero.
Related guides
For platform-level context, see Migrating Datadog and Grafana dashboards and alerts to Kibana. Review known limitations before you migrate every production folder.
How helpful was this content?
Related Content
.jpg)
Kubernetes attributes processor v1: What it means for EDOT Collector

AI agent observability for Microsoft Foundry: two env vars, no collector
Sleep through the 3am page: automated incident response with Elastic on Red Hat OpenShift
OpenTelemetry Java extensions: customize traces without forking the agent