
Automated root cause analysis for AWS: From a CloudWatch alert to a diagnosed incident in 36 seconds
We broke a live RDS instance with a connection leak, and the workflow came back with the Postgres refusals, the downstream 5xx and a root cause nobody had to write by hand.
.jpg)
Kubernetes attributes processor v1: What it means for EDOT Collector
Default EDOT Collector setups are fine. Anything custom that queries labels, annotations or container.image.tag quietly stops returning data after EDOT 9.6.

Two dependencies and one config block: Spring Boot metrics to Elasticsearch over Prometheus remote write
Prometheus remote write forwards Micrometer's Actuator metrics into an Elasticsearch time series data stream. JVM heap, request latency, GC pauses and HikariCP activity all become queryable with ES|QL, and nothing new has to run alongside it.
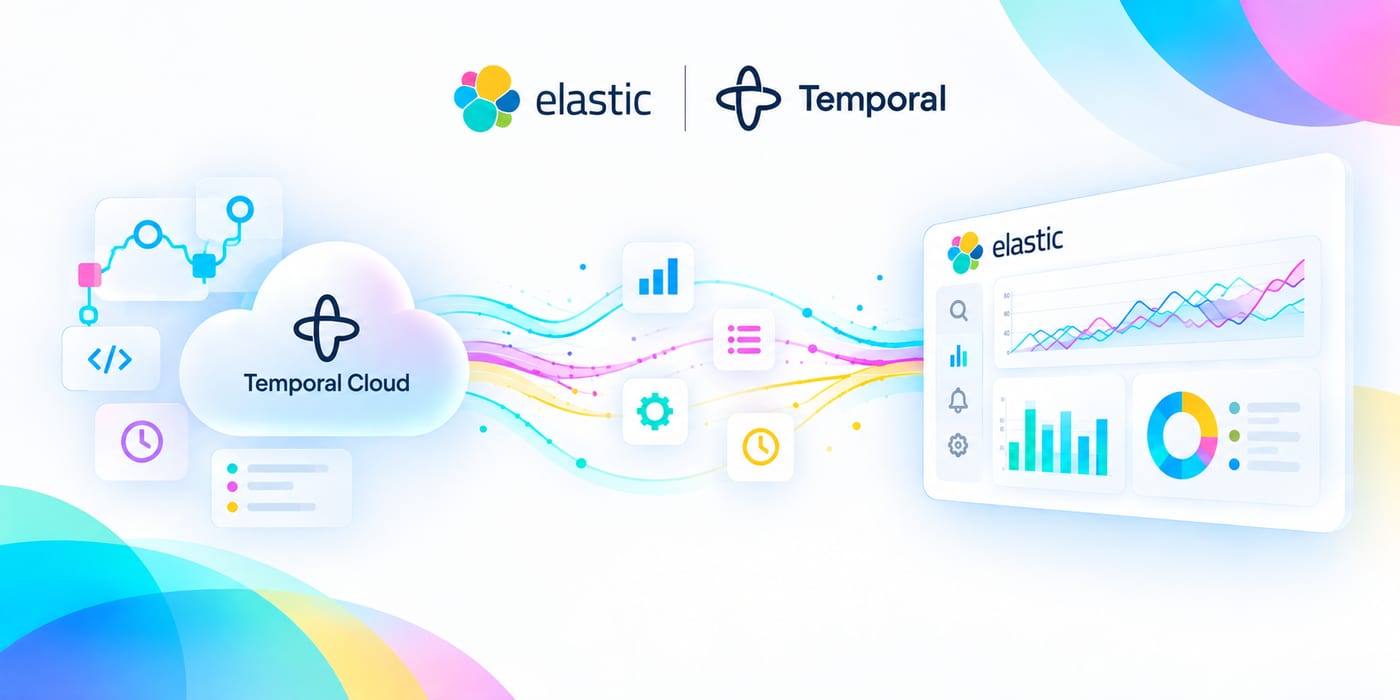
Temporal Cloud observability in Elastic: 50+ metrics, zero collectors
Elastic scrapes metrics.temporal.io, so the workflow that has been stuck in Running for an hour turns out to be a task queue nobody is polling, and you find that out before you open a single worker log.
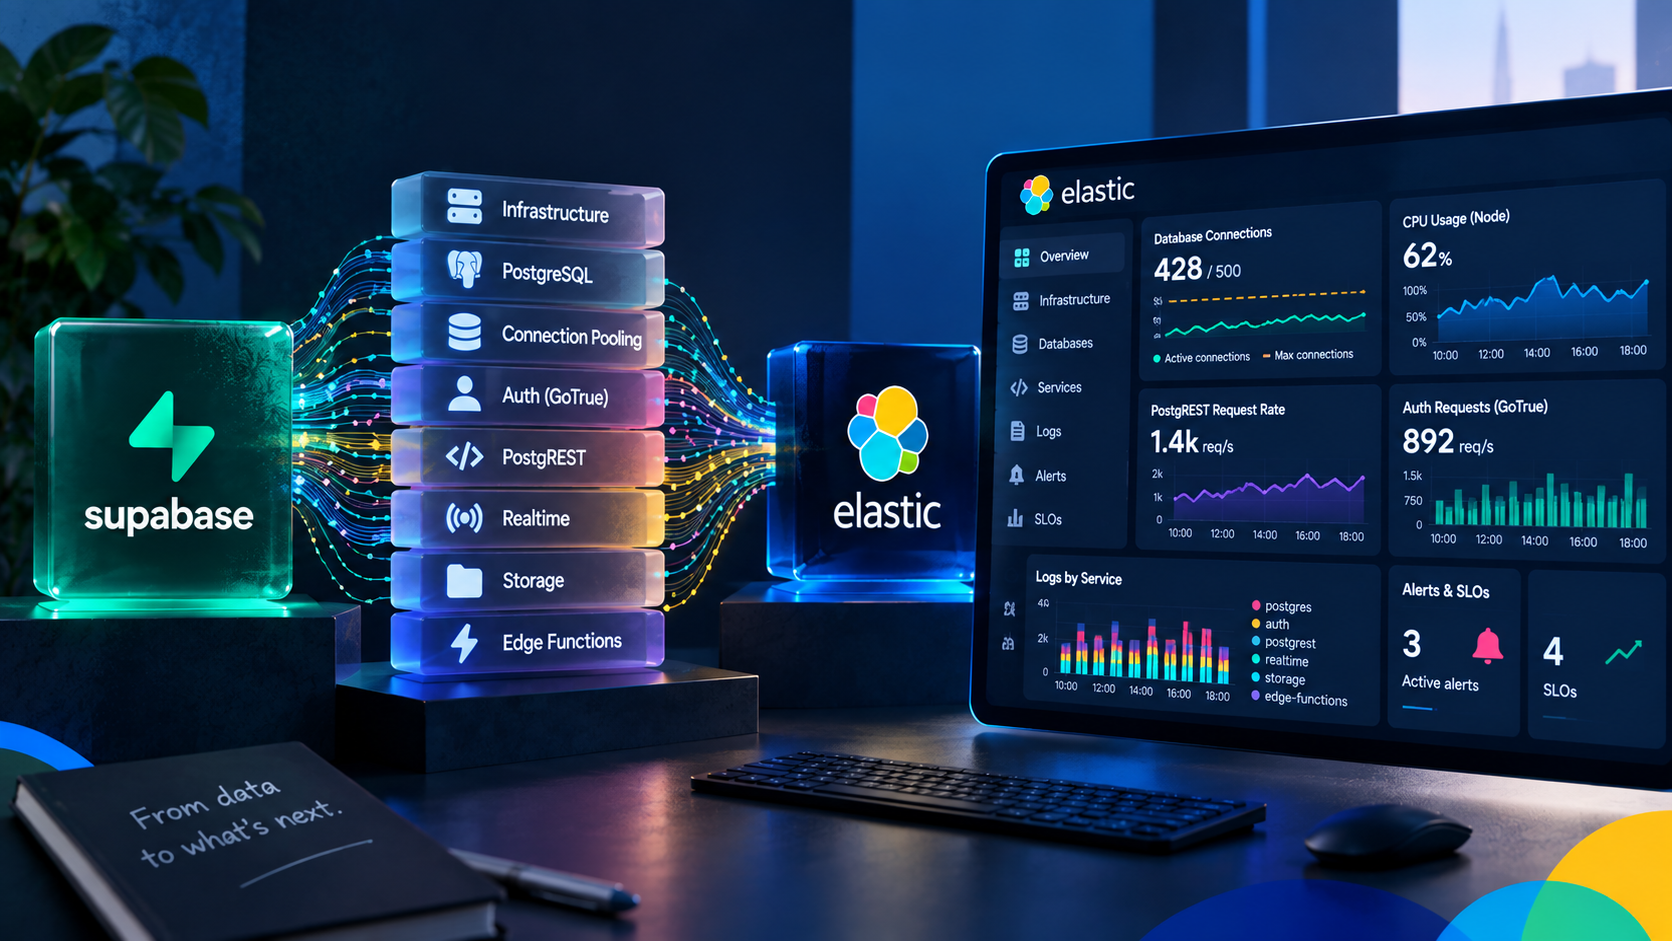
Monitor Supabase in Elastic: dashboards, alert templates, SLO templates, and zero agents
When your Supabase API goes slow, it could be the node, Postgres, the pooler or PostgREST. Elastic tells you which one and shows you the logs from whichever it was.
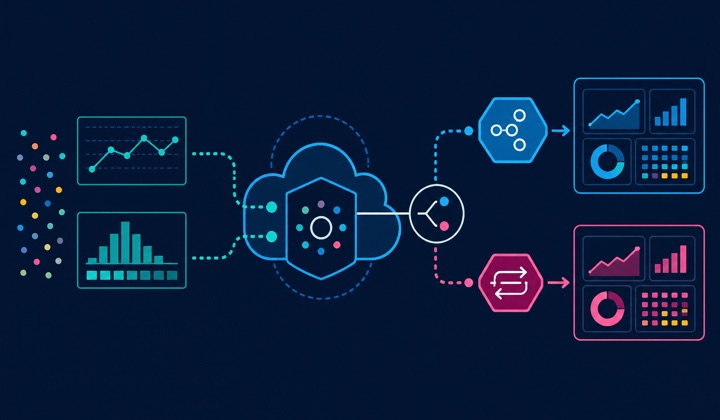
Native OTLP metrics ingestion on Elastic Cloud Hosted
Send an exponential OpenTelemetry histogram and Elasticsearch keeps the scale and buckets you sent. All four type and temporality combinations work now, and your SDK and Collector config stay exactly as they are.
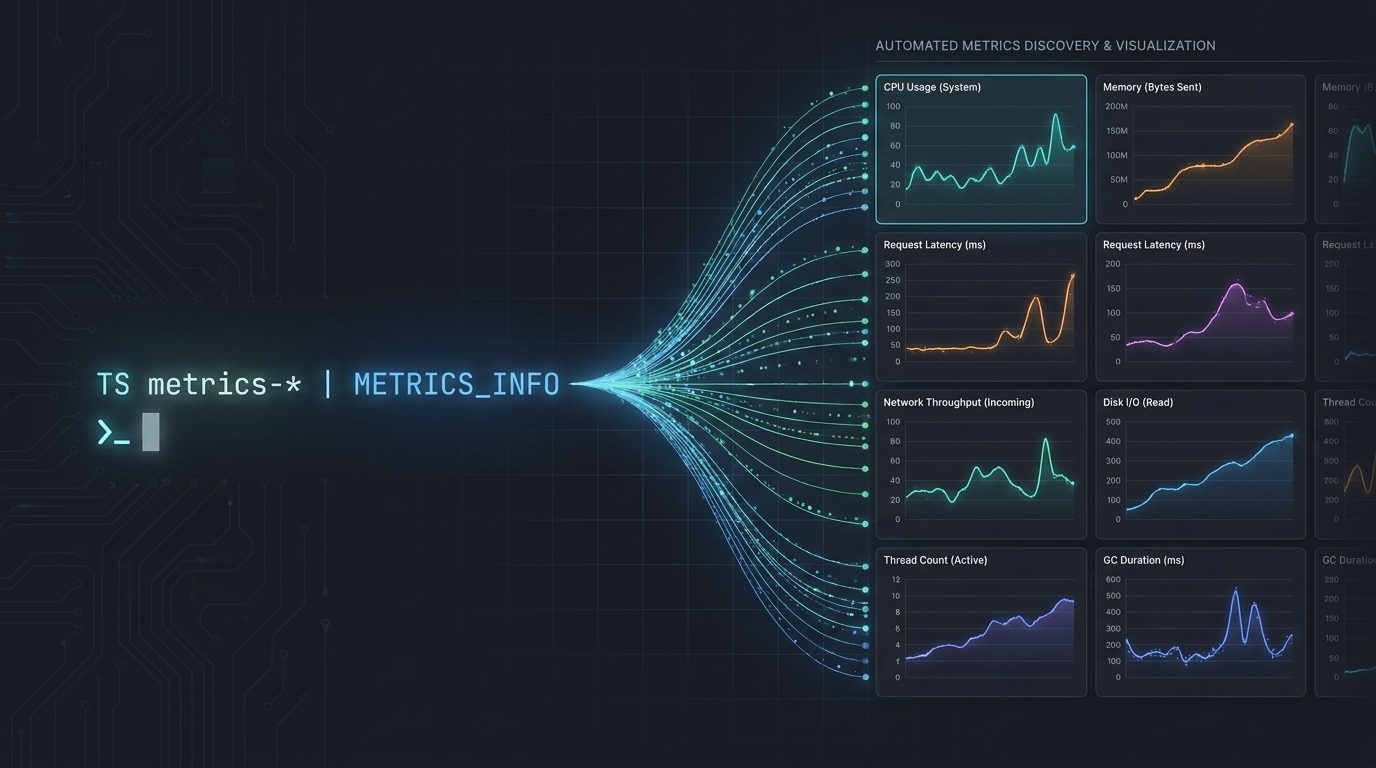
How one ES|QL query builds a metric chart for every metric in Elasticsearch
METRICS_INFO reports what metrics are in your data and how to aggregate each one, so Kibana Discover can chart counters, gauges and histograms correctly with no configuration and no field names to look up.

From a 582ms latency spike to the team that owns it, using Kibana Discover
Getting there takes a data view, some filter pills, a KQL query and a switch to Lucene query syntax, but the part that actually names the team is one ES|QL LOOKUP JOIN against a service catalog index.

Kubernetes observability: SLO templates that turn alerts into error budgets
Two bad rollouts burned 88% of a 30-day error budget while the SLI still read 99.56%. This post adds four SLO templates that bring burn-rate tracking to the OTel-based alert rules from Part 1, no new instrumentation required.
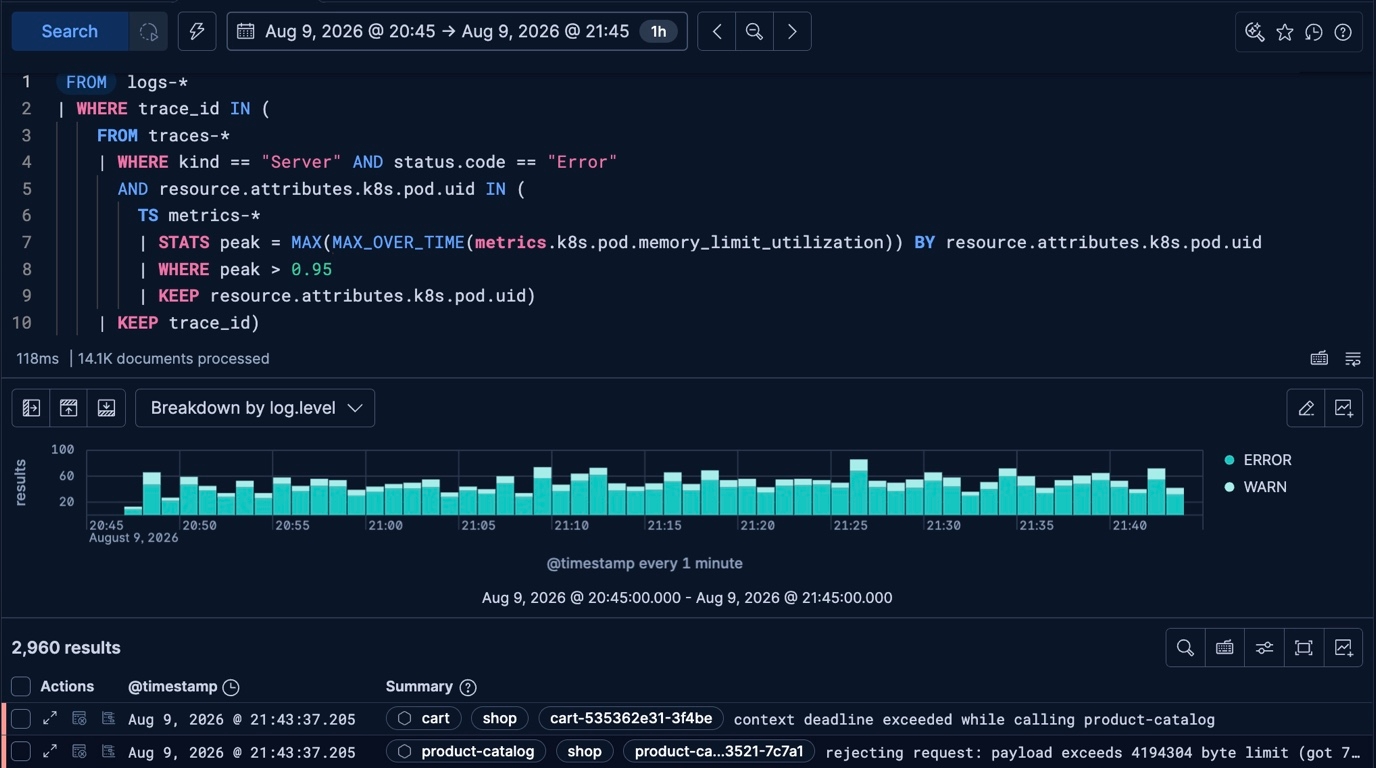
Correlate logs, metrics, and traces in one ES|QL query
Walk through four investigations, from CPU saturation to pod memory pressure, each answered by a single query across signal types.
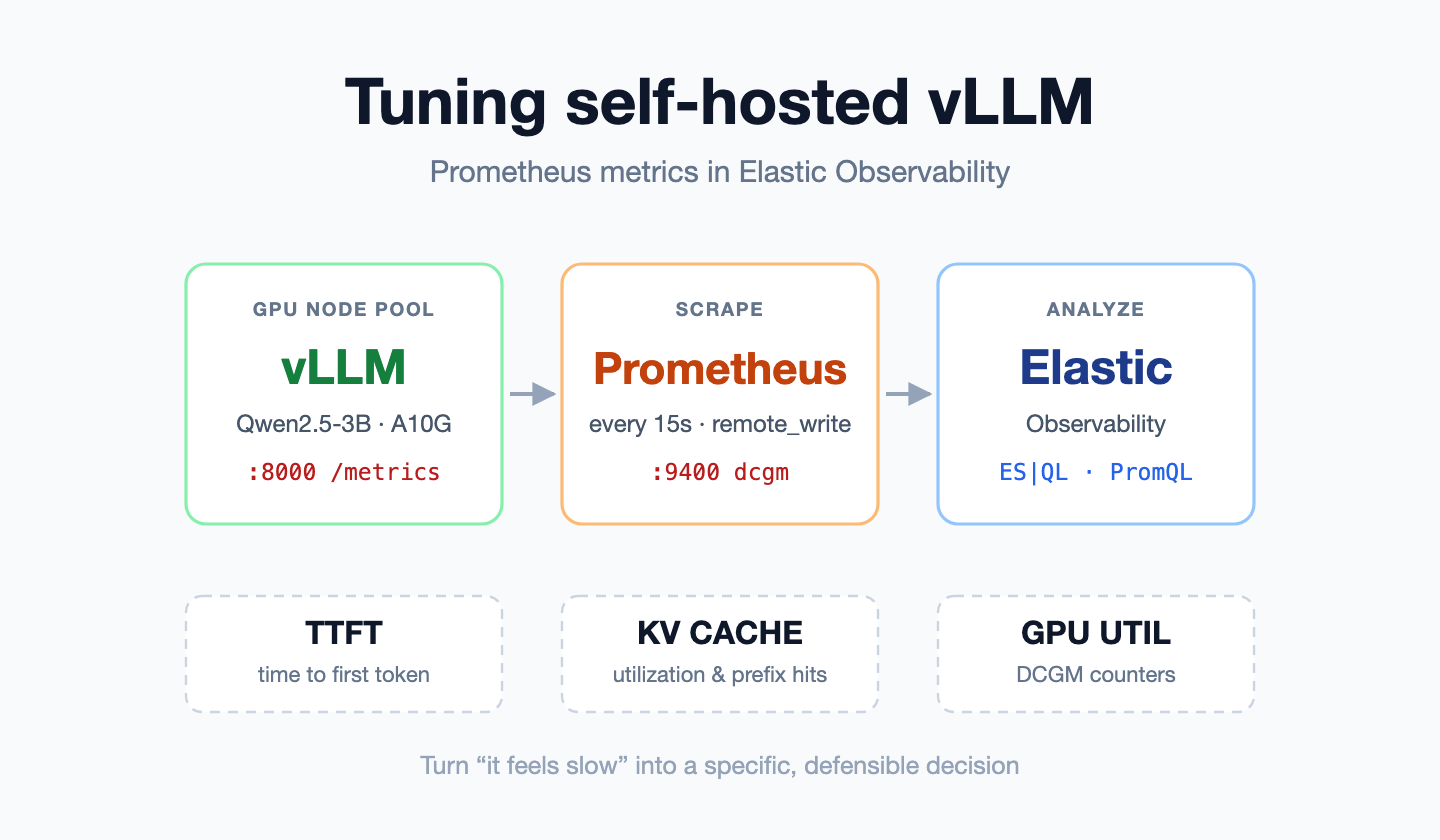
vLLM Prometheus metrics for self-hosted LLM tuning: TTFT, KV Cache, and GPU Utilization
Tuning a self-hosted vLLM inference using its Prometheus metrics in Elastic Observability — TTFT, KV cache, prefix caching and DCGM GPU counters
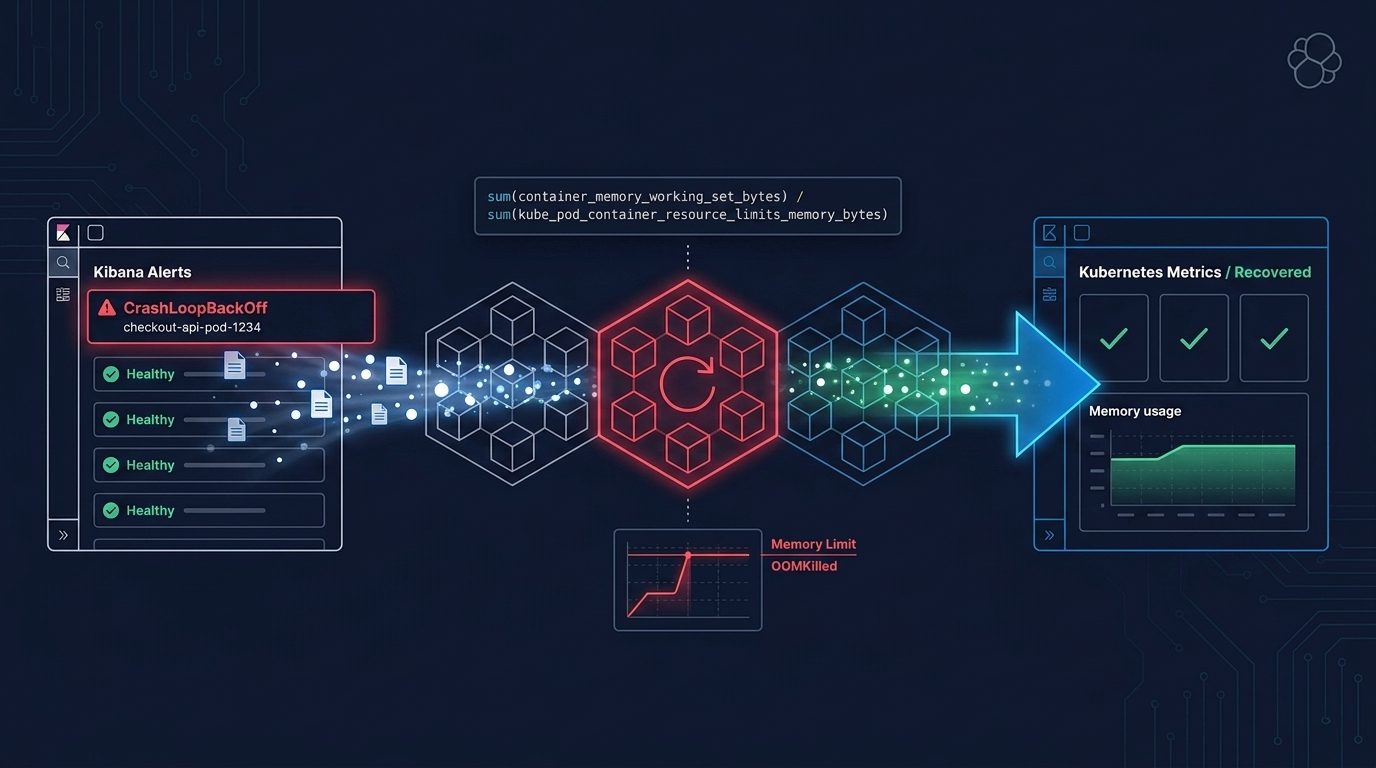
From CrashLoopBackOff to OOMKilled with PromQL in Elasticsearch and Kibana
Use PromQL in Elasticsearch and Kibana to move from a CrashLoopBackOff alert to OOMKilled, memory versus the limit, and a verified fix.