
Exploring Nginx metrics with Elastic time series data streams
Elasticsearch recently released time series metrics as GA. In this blog, we dive into details of what a time series metric document is and the mapping used for enabling time series by using an existing OOTB Nginx integration.

How to capture custom metrics without app code changes using the Java Agent Plugin
When the application you're monitoring doesn't emit the custom metrics you'd like, and you can't directly change the app code, you can use a Java Agent Plugin to automatically instrument the application and emit the custom metrics you desire.

Improving the Elastic APM UI performance with continuous rollups and service metrics
We made significant improvements to the UI performance in Elastic APM to make it scale with even the most demanding workloads, by pre-aggregating metrics at the service level, and storing the metrics at different levels of granularity.

Using the Elastic Agent to monitor Amazon ECS and AWS Fargate with Elastic Observability
In this article, we’ll guide you through how to install the Elastic Agent with the AWS Fargate integration as a sidecar container to send host metrics and logs to Elastic Observability.

How to enable Kubernetes alerting with Elastic Observability
In the Kubernetes world, different personas demand different kinds of insights. In this post, we’ll focus on alerting and provide an overview of how alerts in Elastic Observability can help users quickly identify Kubernetes problems.

How to use Elasticsearch and Time Series Data Streams for observability metrics
With Time Series Data Streams (TSDS), Elasticsearch introduces optimized storage for metrics time series. Check out how we use it for Elastic Observability.

Monitoring service performance: An overview of SLA calculation for Elastic Observability
Elastic Stack provides many valuable insights for different users, such as reports on service performance and if the service level agreement (SLA) is met. In this post, we’ll provide an overview of calculating an SLA for Elastic Observability.
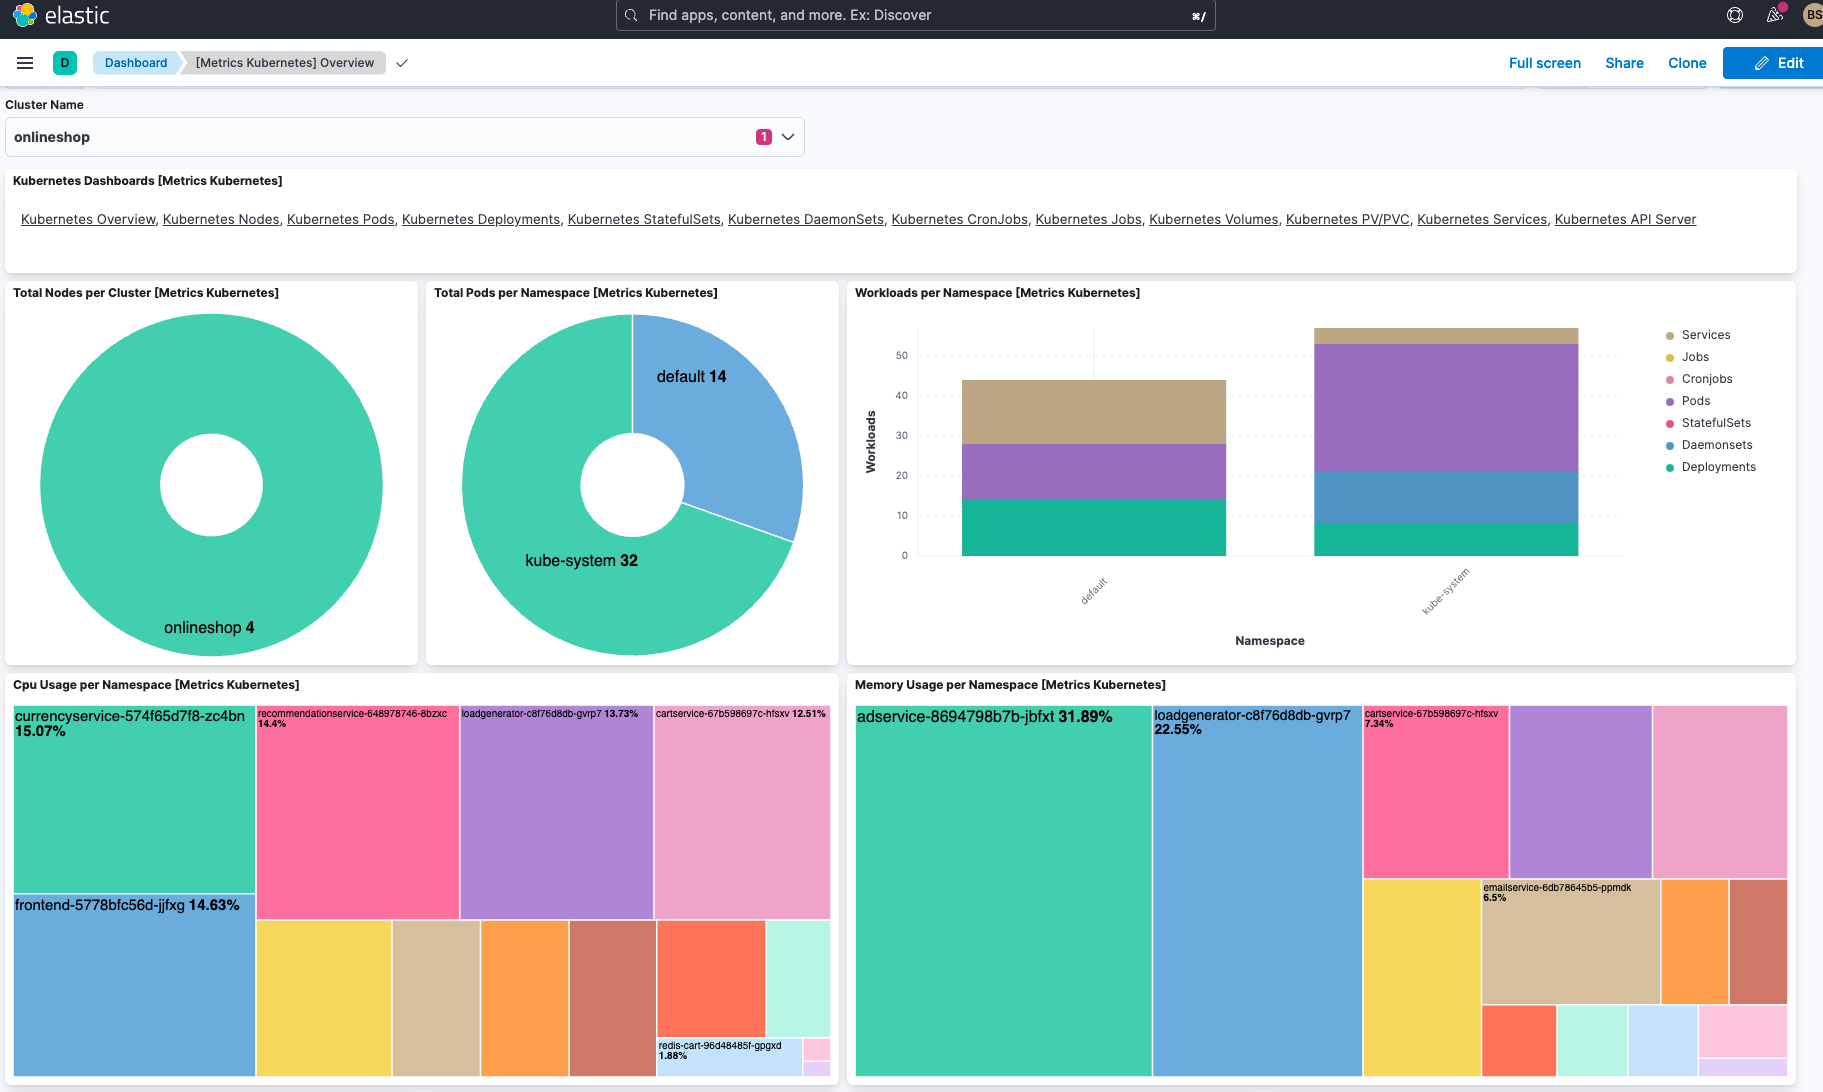
Using Elastic to observe GKE Autopilot clusters
See how deploying the Elastic Agent onto a GKE Autopilot cluster makes observing the cluster’s behavior easy. Kibana integrations make visualizing the behavior a simple addition to your observability dashboards.

Easily analyze AWS VPC Flow Logs with Elastic Observability
Elastic Observability can ingest and help analyze AWS VPC Flow Logs from your application’s VPC. Learn how to ingest AWS VPC Flow Logs through a step-by-step method into Elastic, then analyze it and apply OOTB machine learning for insights.

Wait… Elastic Observability monitors metrics for AWS services in just minutes?
Get metrics and logs from your AWS deployment and Elastic Observability in just minutes! We’ll show you how to use Elastic integrations to quickly monitor and manage the performance of your applications and AWS services to streamline troubleshooting.
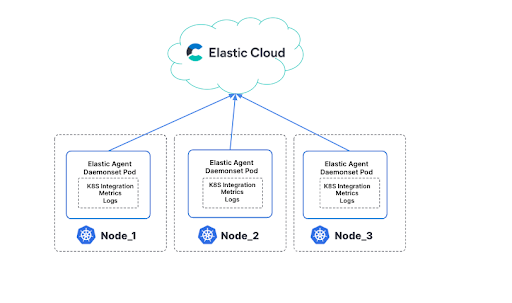
Managing your Kubernetes cluster with Elastic Observability
Unify all of your Kubernetes metrics, log, and trace data on a single platform and dashboard, Elastic. From the infrastructure to the application layer Elastic Observability makes it easier for you to understand how your cluster is performing.