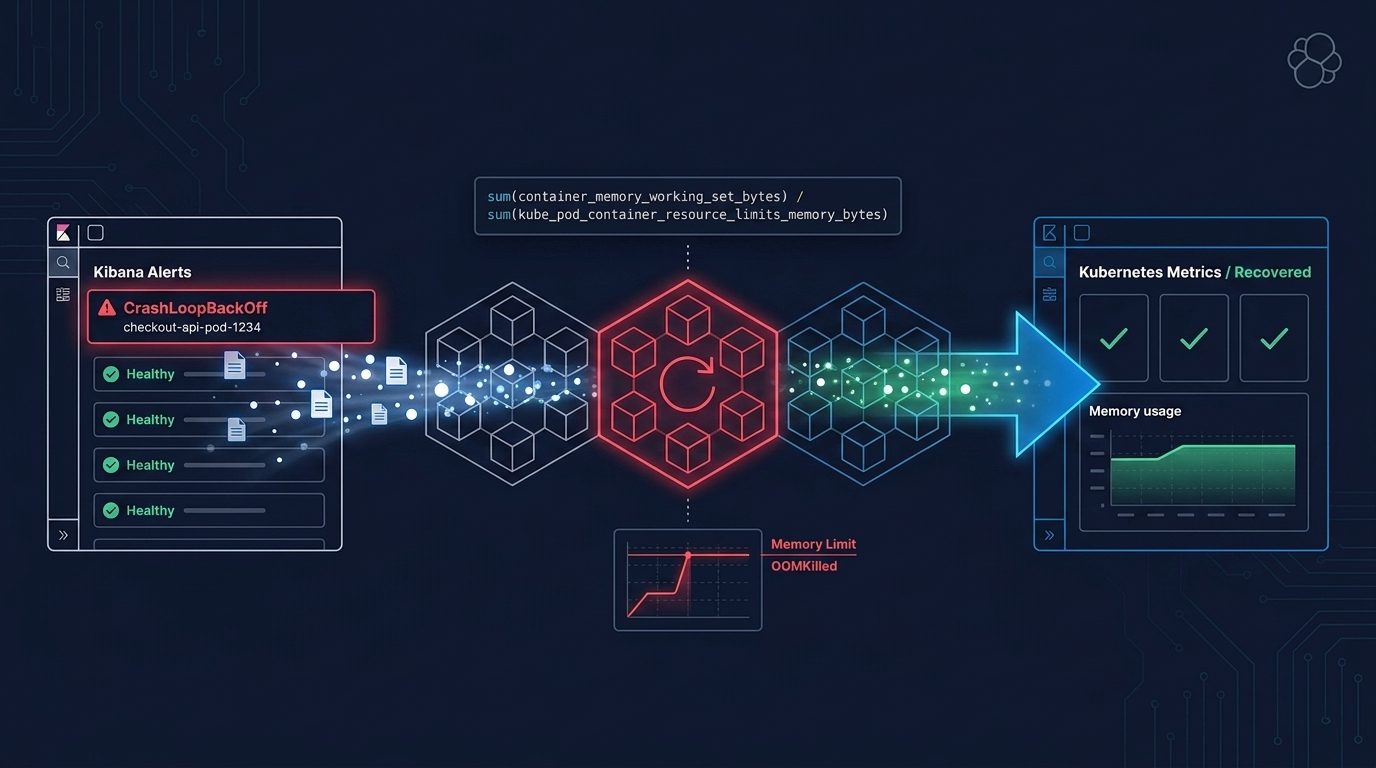
From CrashLoopBackOff to OOMKilled with PromQL in Elasticsearch and Kibana
Use PromQL in Elasticsearch and Kibana to move from a CrashLoopBackOff alert to OOMKilled, memory versus the limit, and a verified fix.
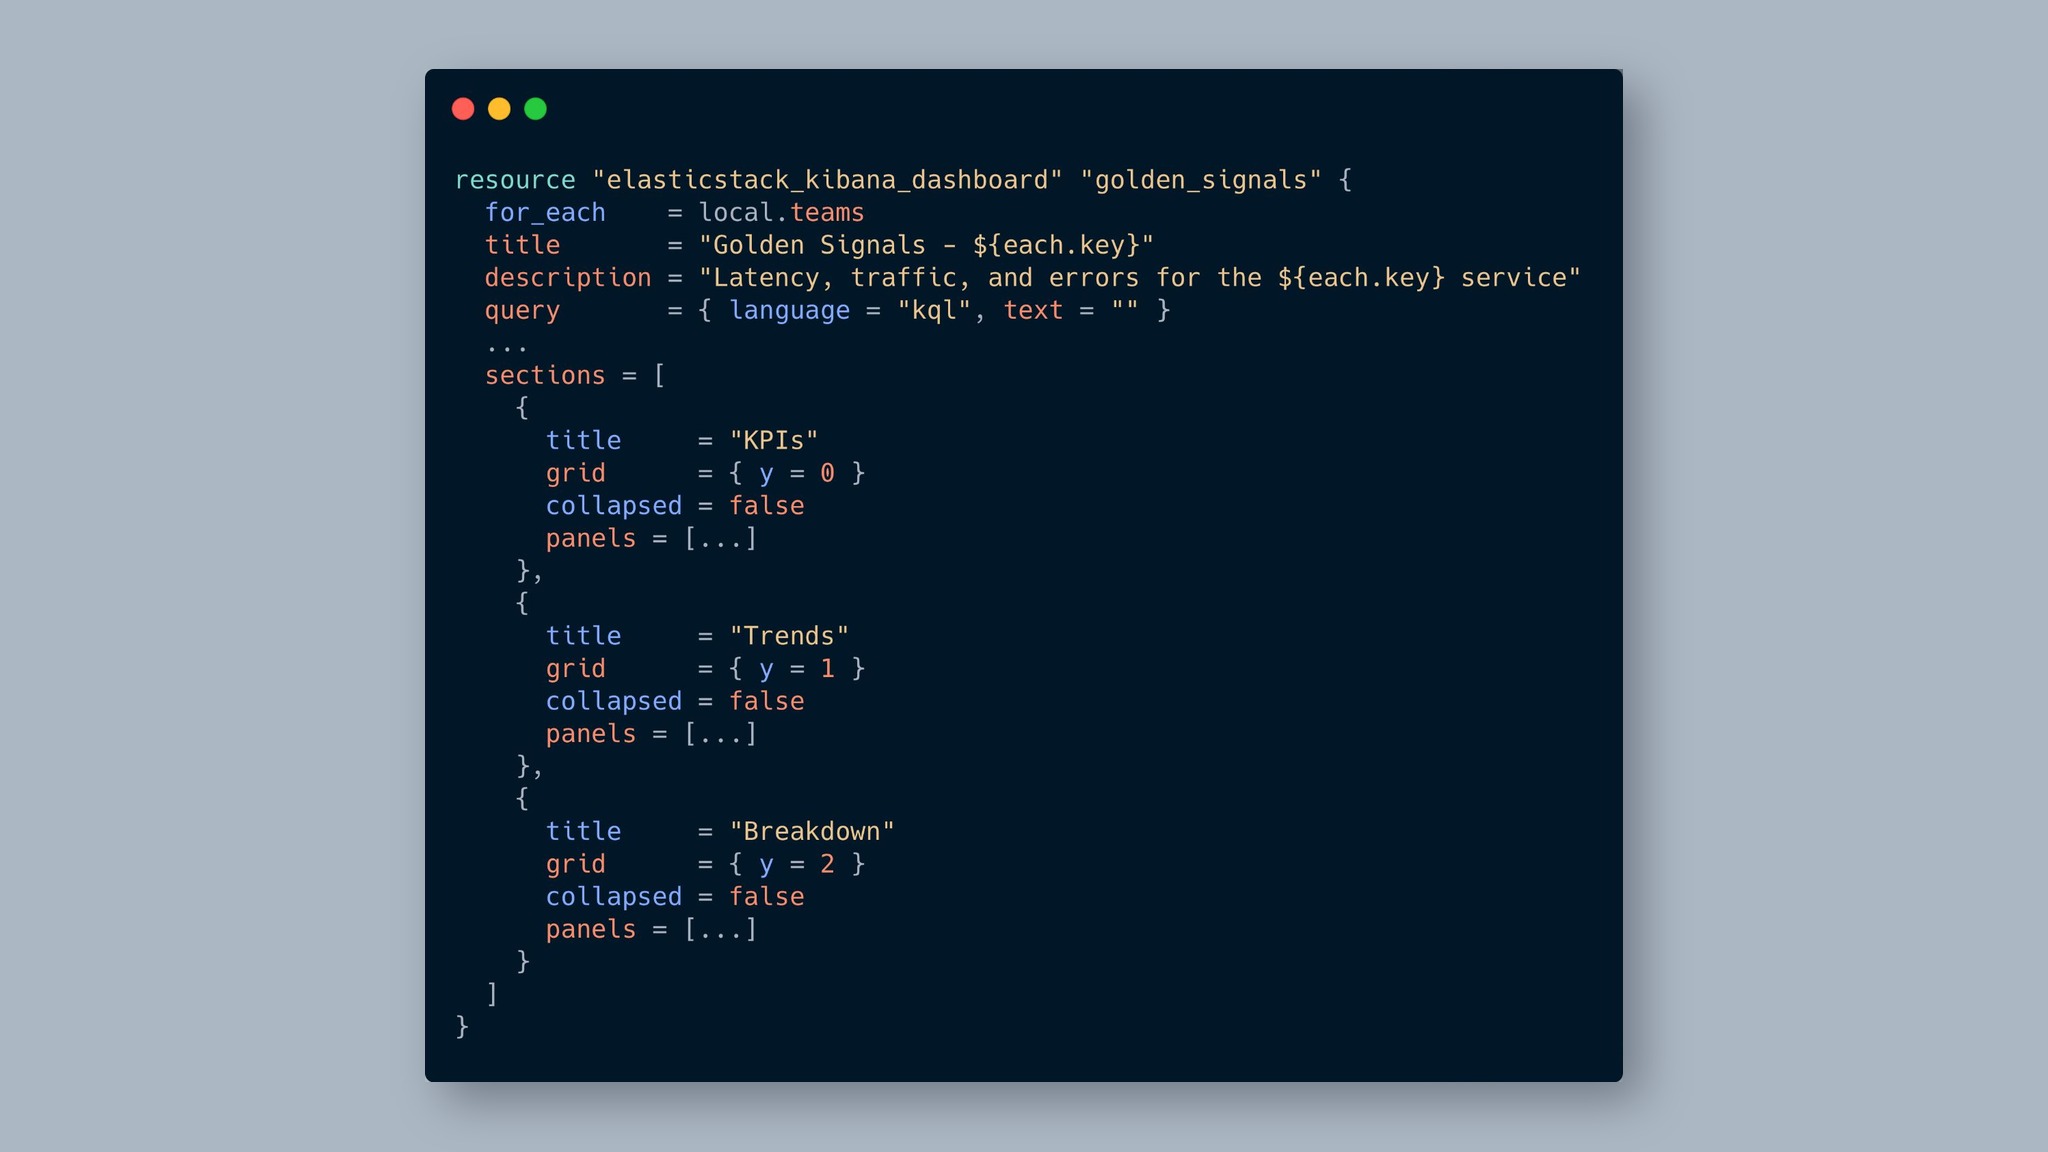
One edit, every dashboard updated: managing Kibana observability at scale with Terraform
Define your golden-signals panels once in a shared HCL library and use for_each to generate every team's dashboard, with drift detection and git rollback built in.
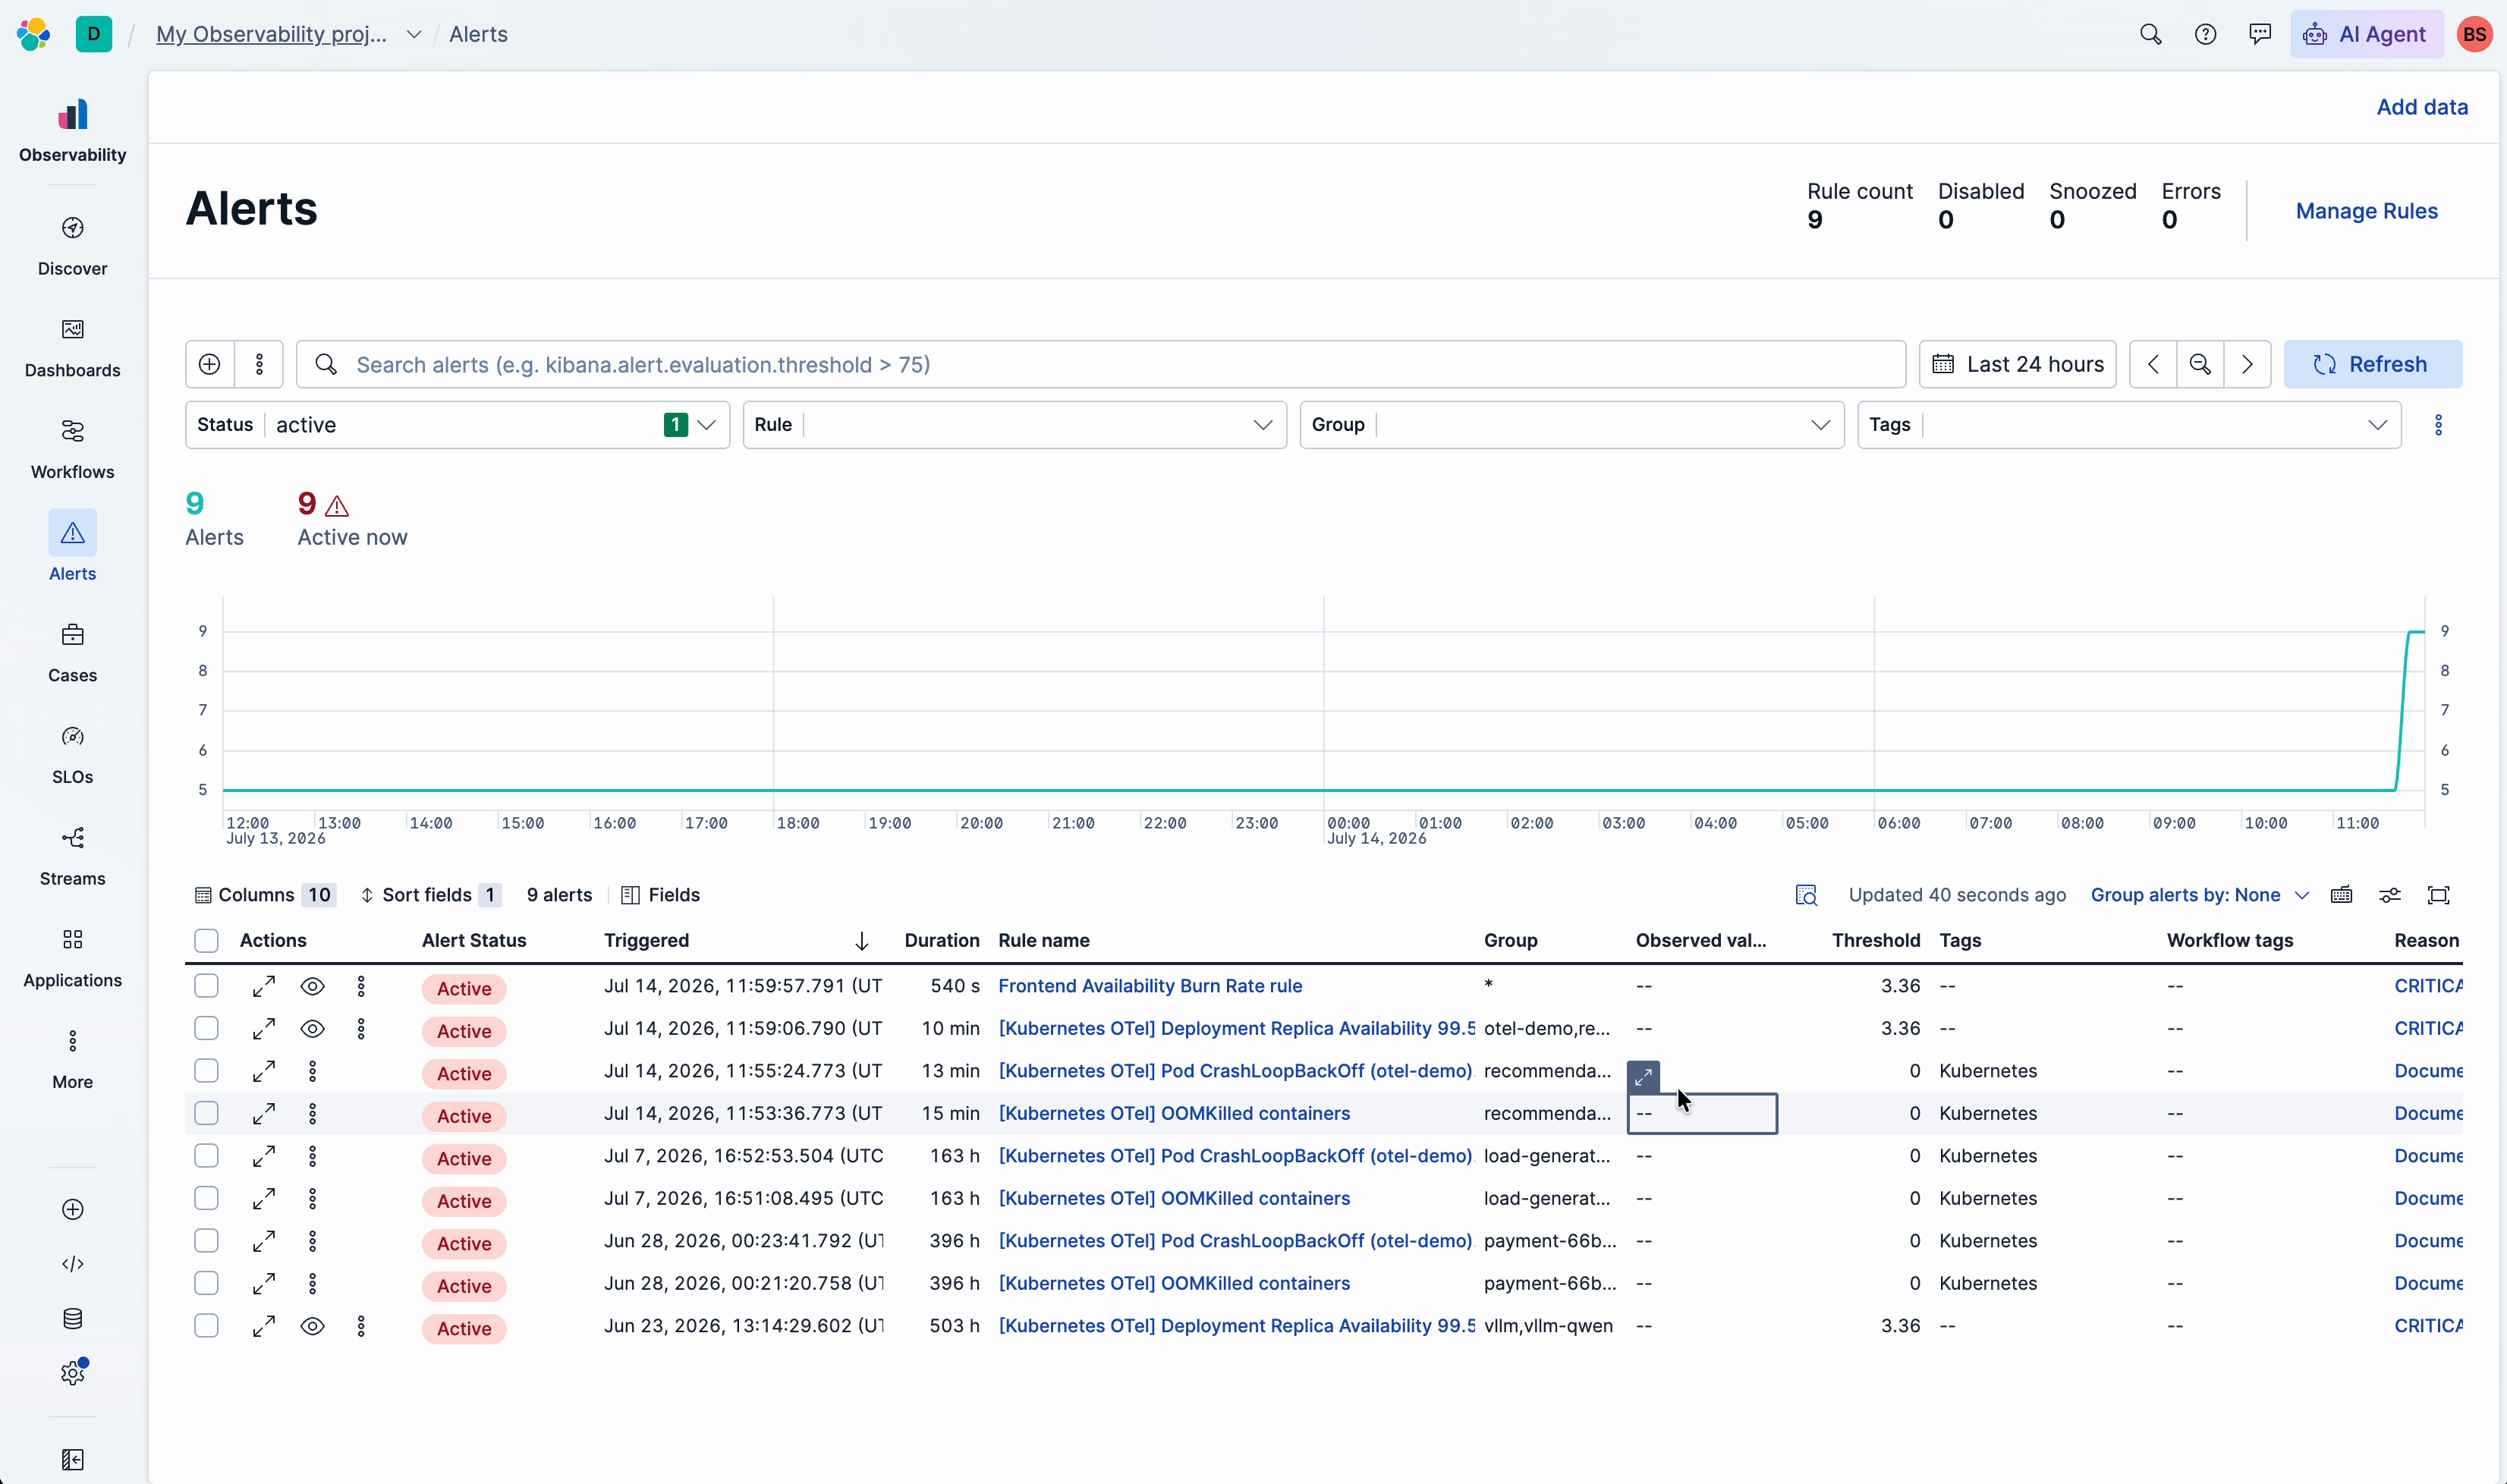
CrashLoopBackOff to root cause in seconds: automating the 20-minute Kubernetes investigation with Elastic Observability
Elastic's Kubernetes Experience fires alongside the CrashLoopBackOff alert and delivers a root-cause hypothesis with evidence before you even open it.

Migrate Datadog Kubernetes dashboards to Elastic Observability in under an hour
See how the migration CLI translates a real Datadog Kubernetes dashboard into validated Kibana panels and uploads it to your cluster in under an hour, no manual widget rebuilds required.
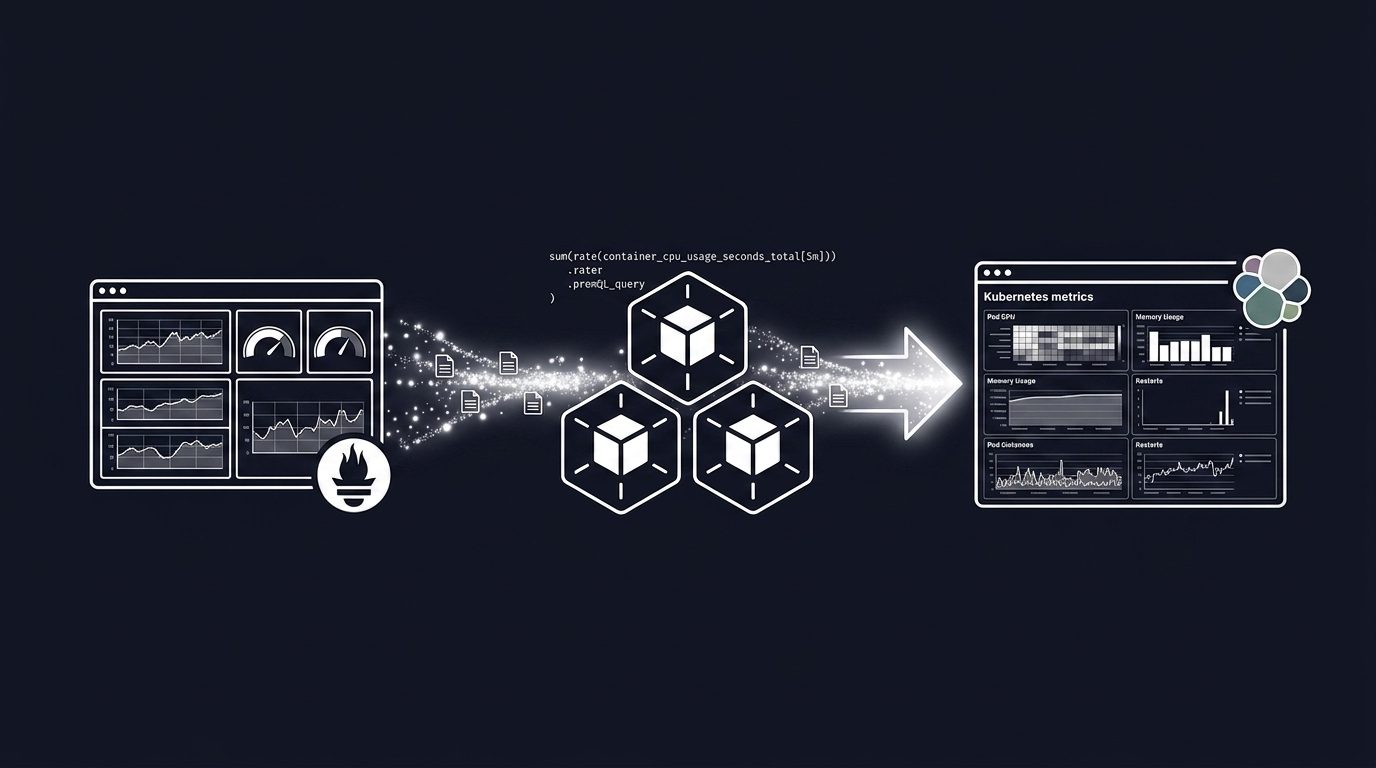
Migrate your Grafana Kubernetes dashboard to Elastic Observability: same PromQL, 30x faster queries
Take a real Grafana Kubernetes dashboard covering pod CPU, memory, node pressure, and restart counts, then migrate it into Elastic Observability with native PromQL in under an hour.
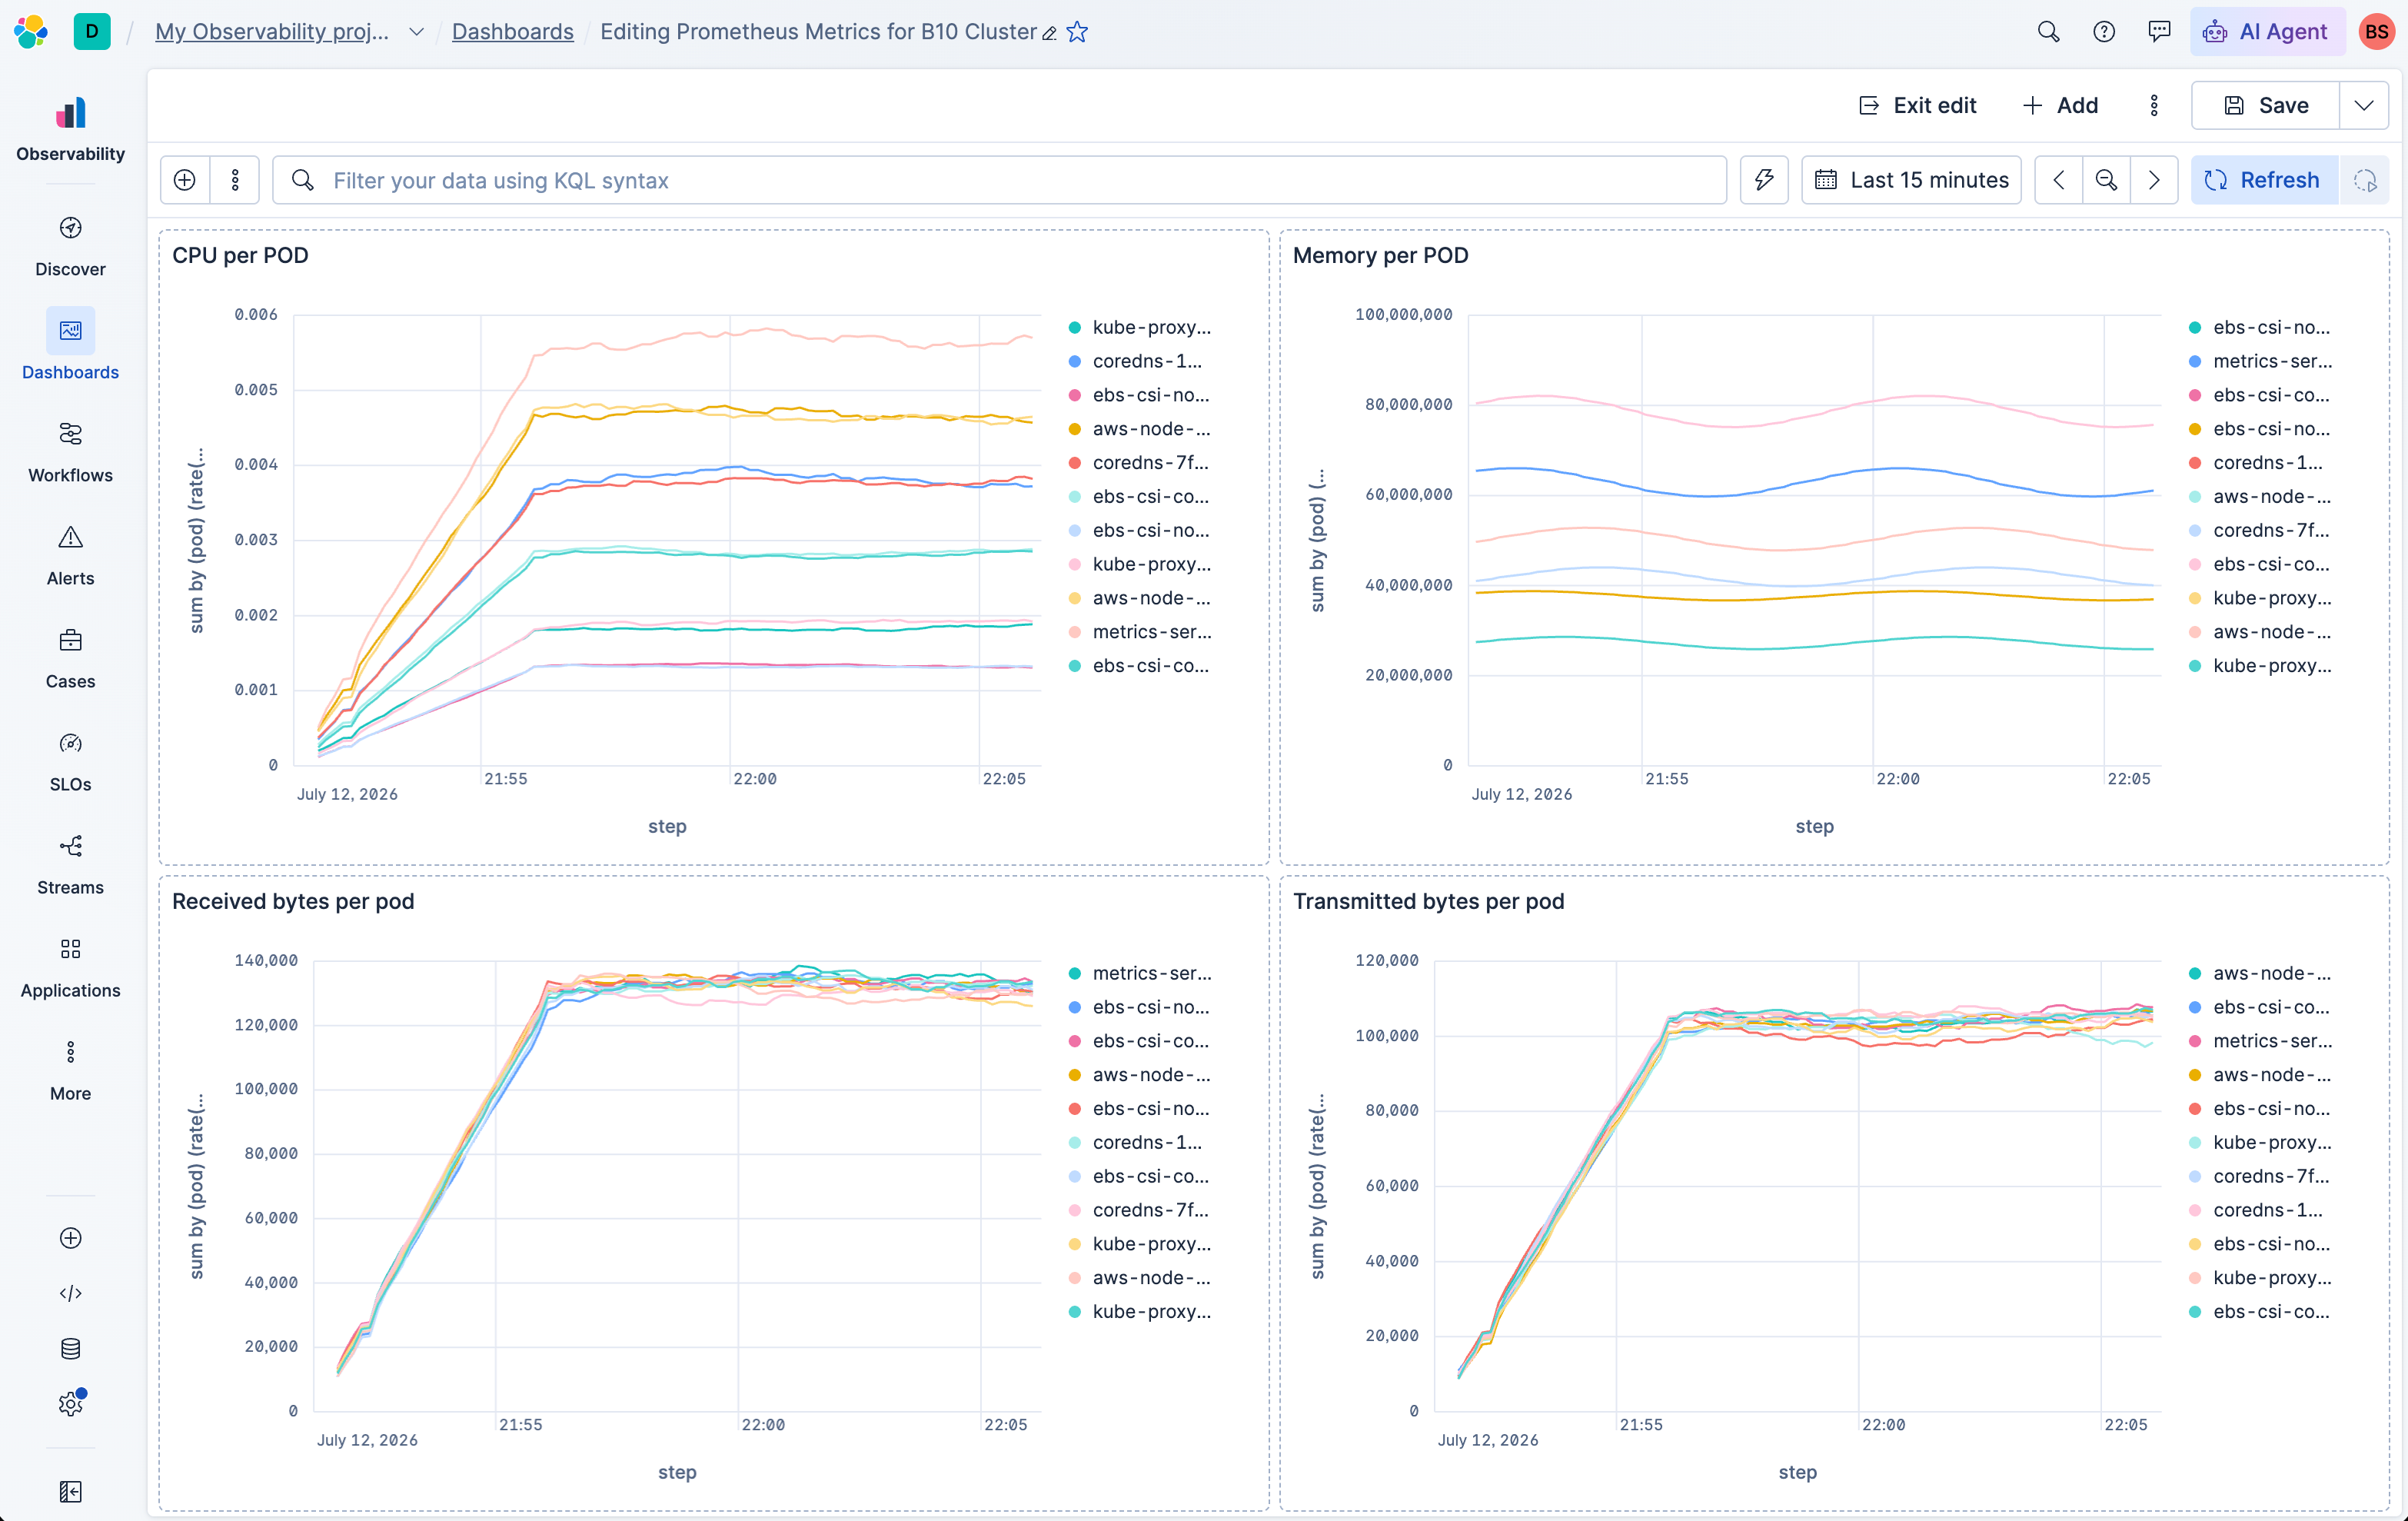
Prometheus metrics in Elastic Observability: your PromQL runs unchanged
Point Prometheus from your Kubernetes cluster at Elastic Observability with one config block. PromQL runs unchanged, keep your PromQL no cardinality billing.
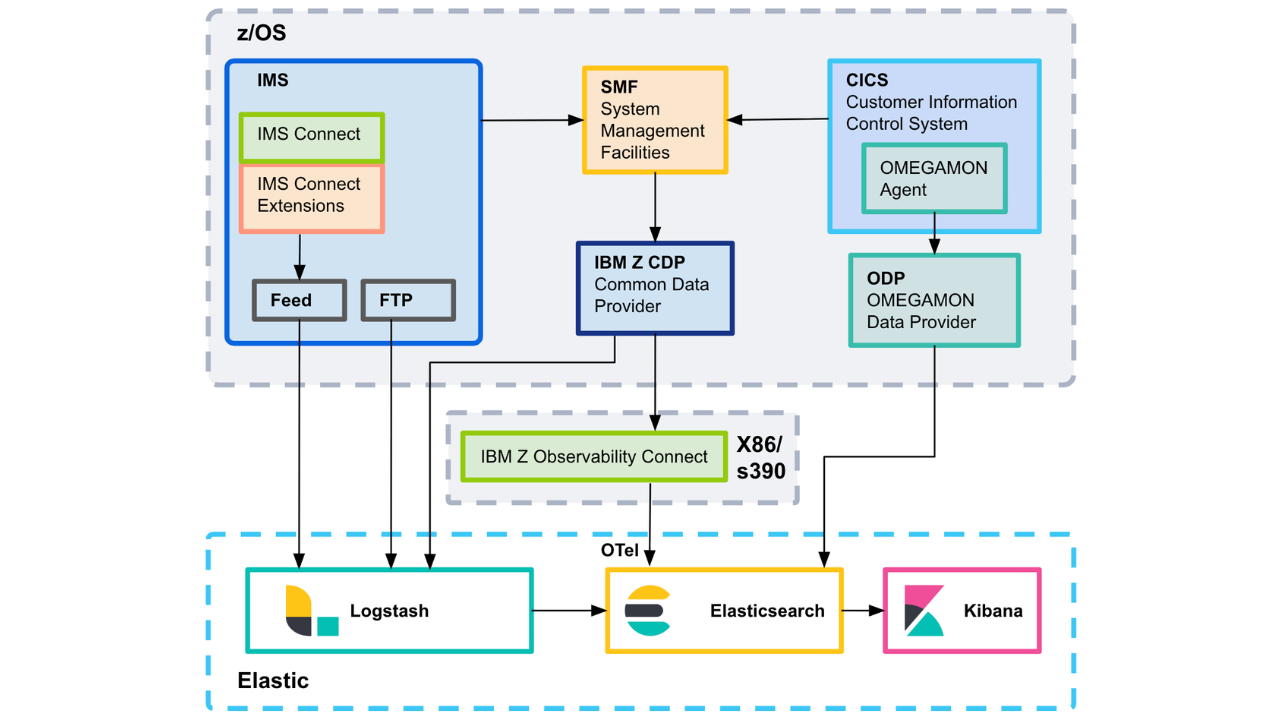
Elastic z/OS ingest: five architectures for mainframe data
This field guide walks through the ingest architectures I've seen work in production, the data quality checks that decide whether your dashboards actually work, and the ECS mapping that makes mainframe data usable to the platform.

Elastic now alerts at 80% OpenAI rate limit usage, before your app gets throttled
OpenAI rate limit monitoring in Elastic maps headroom across every project and model. Compare configured RPM, TPM and IPM limits against real usage and plan capacity before a throttling alert fires.
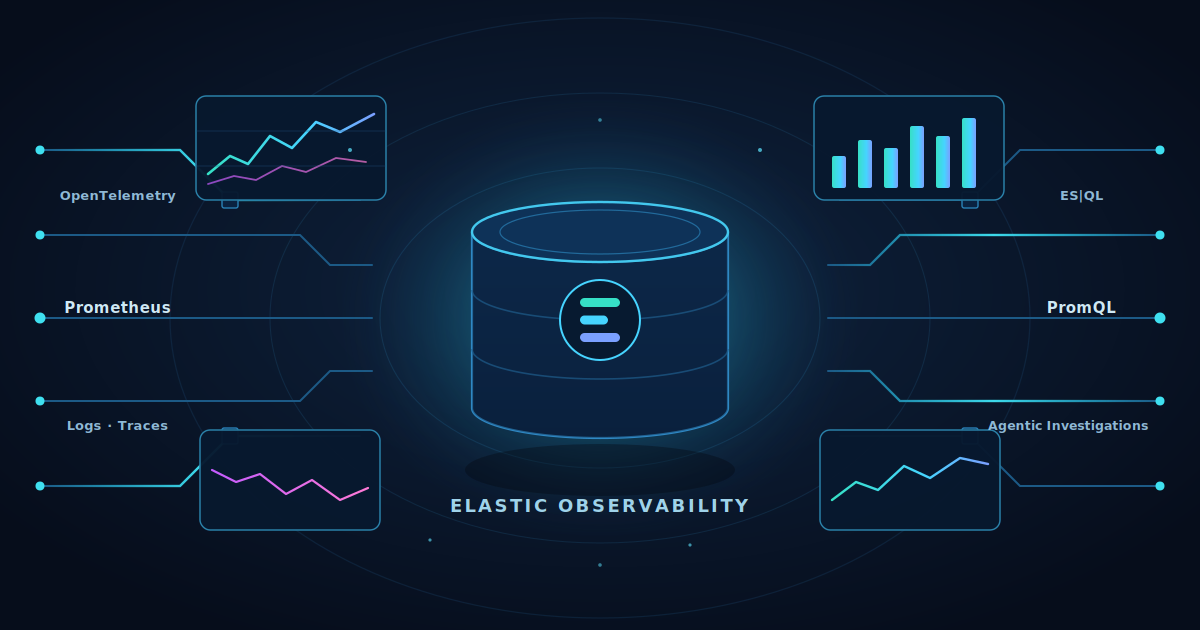
Elasticsearch: best-in-class for logs, now best-in-class for metrics
Elasticsearch is now best-in-class for metrics: 30× faster than Prometheus, up to 2.5× more storage-efficient, 50% less than Datadog. Learn about all the capabilities we’ve added.
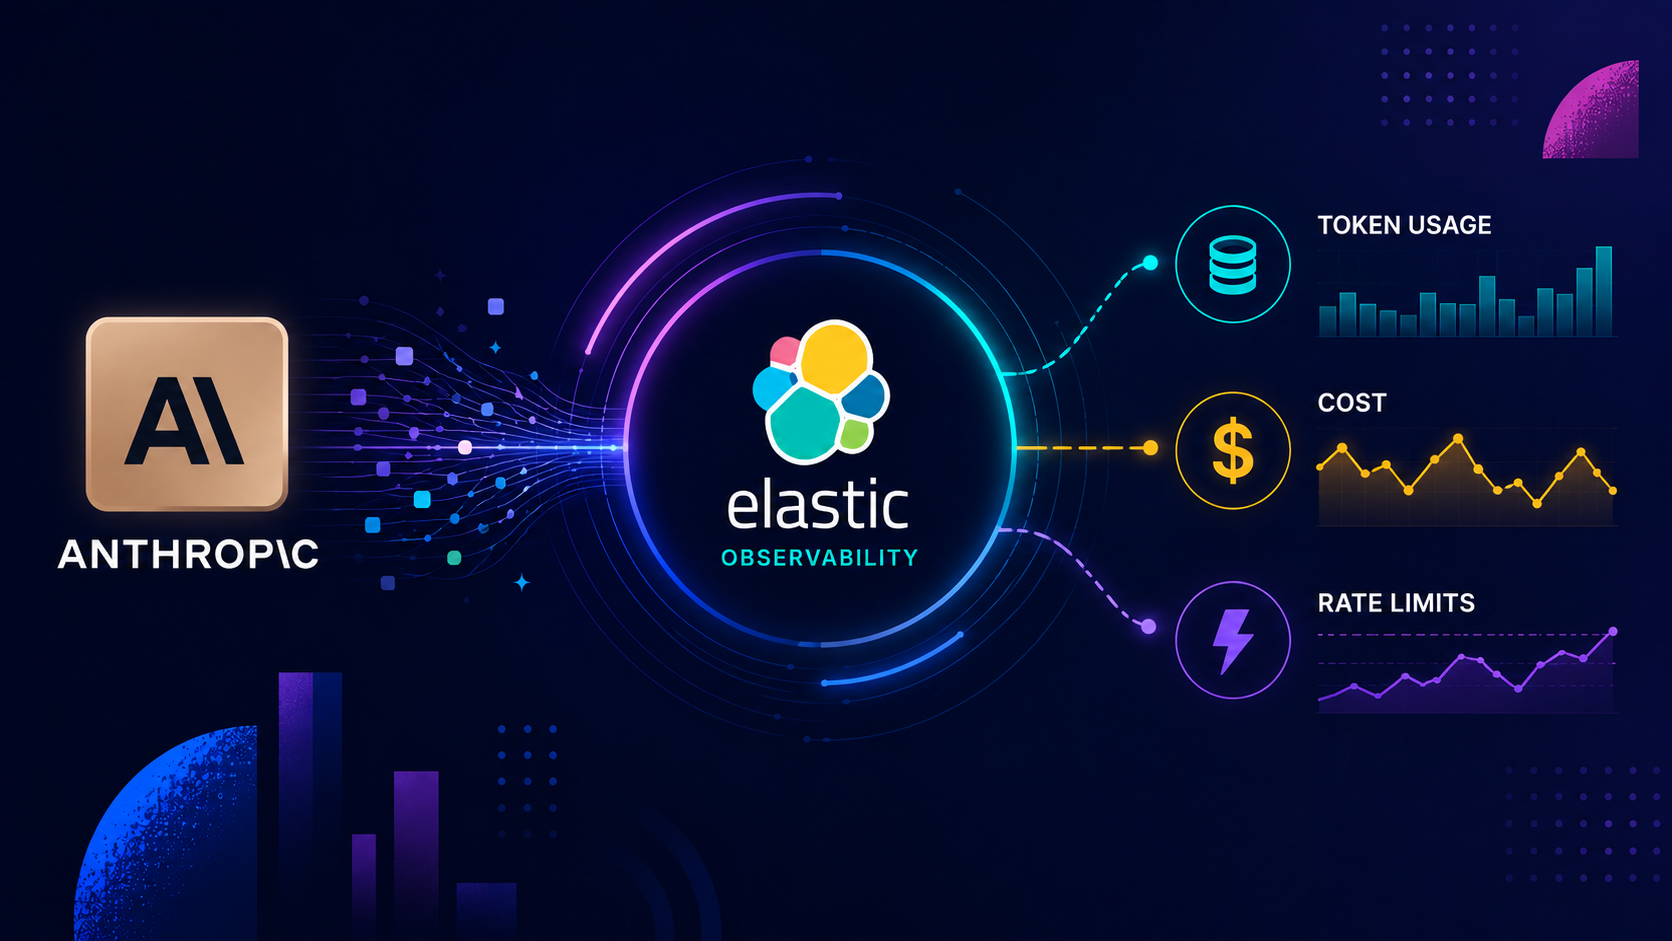
Stop finding out about your Claude bill on invoice day: Anthropic API monitoring is now in Elastic
Track Anthropic API spend and rate limit headroom across every workspace, model, and service tier, so cost surprises and throttling stop being production-time discoveries.
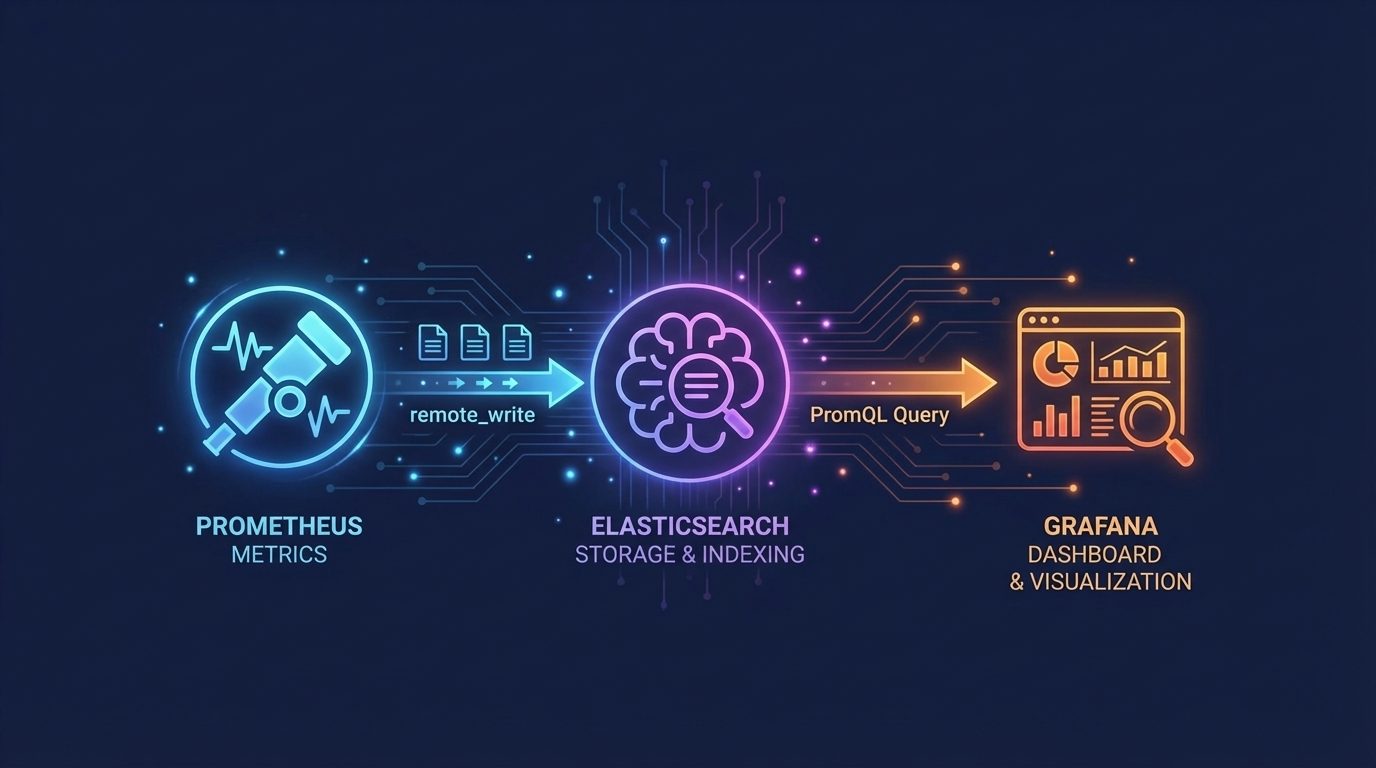
Use Elasticsearch as a Drop-In Prometheus Backend for Grafana
Use Elasticsearch as a Prometheus backend for Grafana dashboards, autocomplete, Metrics Drilldown, and alerting without changing PromQL workflows.
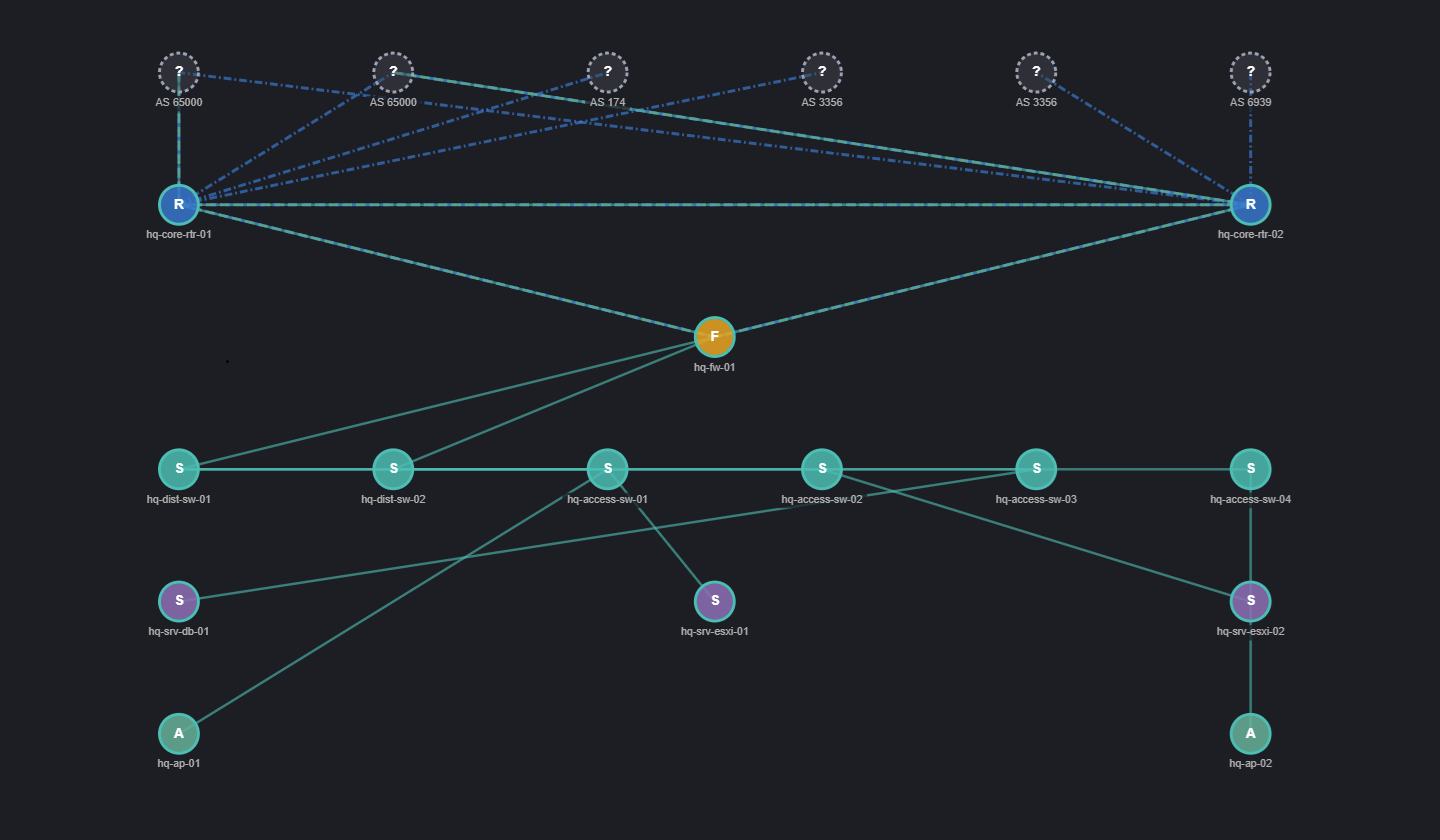
SNMP Topology Data in Kibana: Collection to Canvas
The Network Topology plugin for Kibana provides a ready-to-deploy Logstash pipeline, a structured schema, and a topology view that shows what's connected to what.