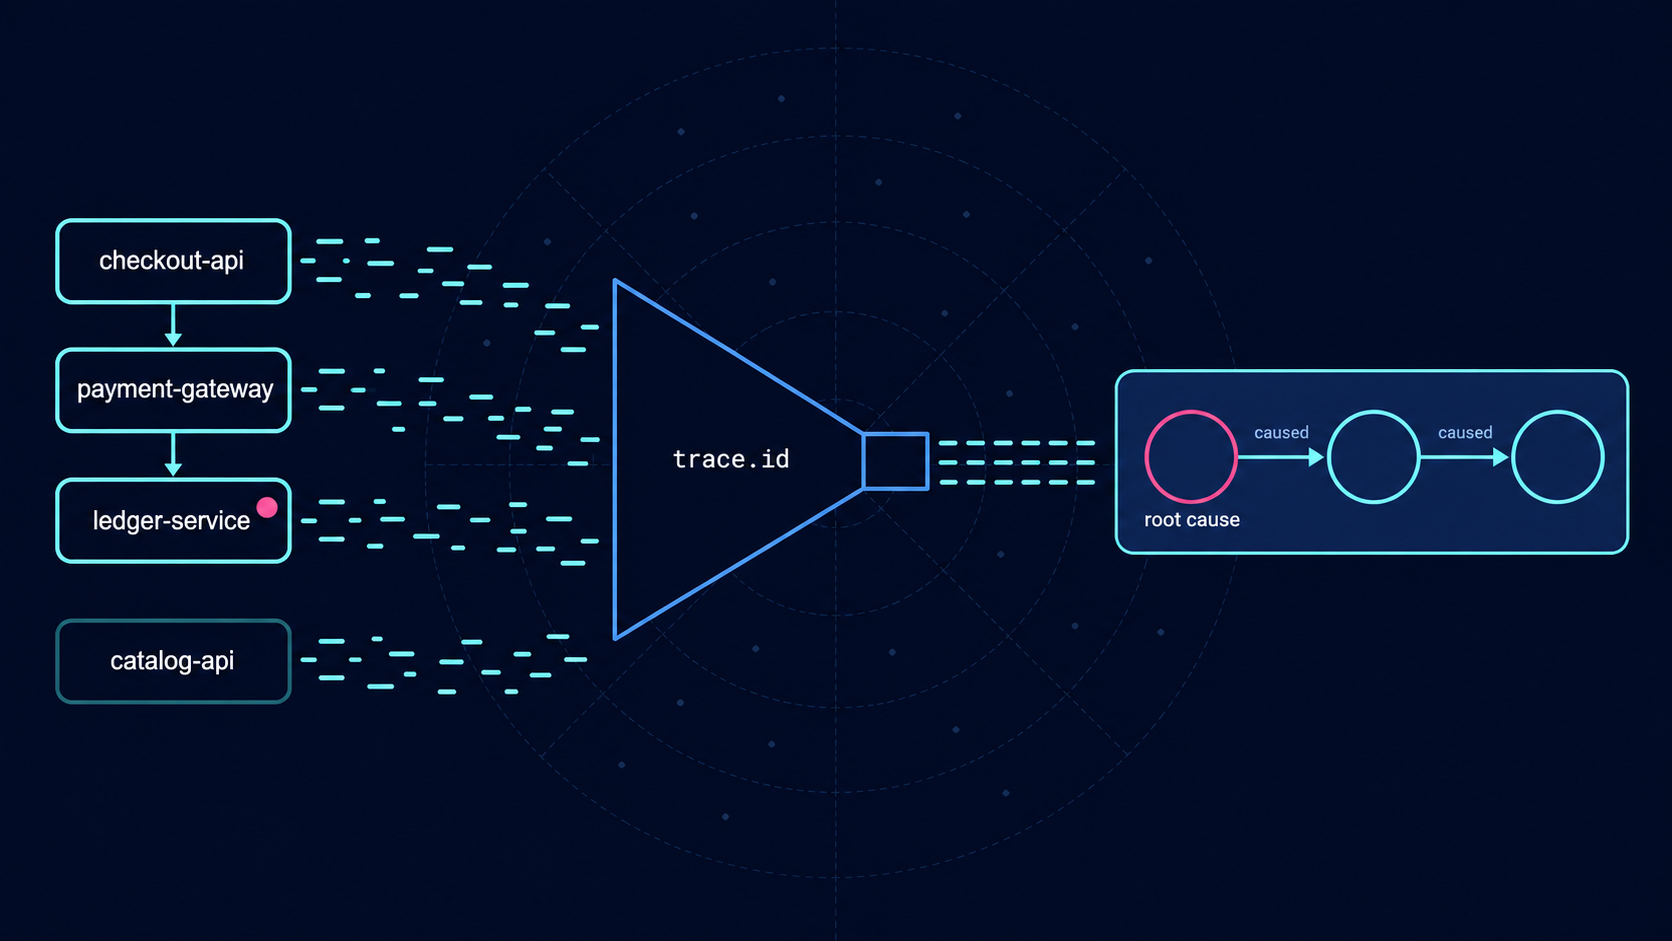
The service with the most errors was healthy: root cause analysis from logs with ES|QL
Metrics ranked three services identically at 19.1%. Four ES|QL queries over the same 4,688 OpenTelemetry log records traced 955 of 956 failure chains back to one of them, and needed no service dependency model to do it.
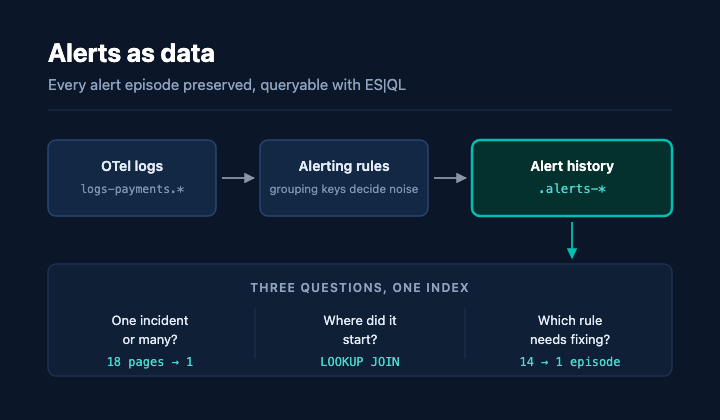
14 alerts, 1 incident: Measuring alerting rule noise with ES|QL in Elasticsearch
Grouping keys decide how many alerts one incident produces, and because Kibana stamps every alert document with a rule revision, you can measure your alert noise reduction against the same incident that caused the alerts in the first place.
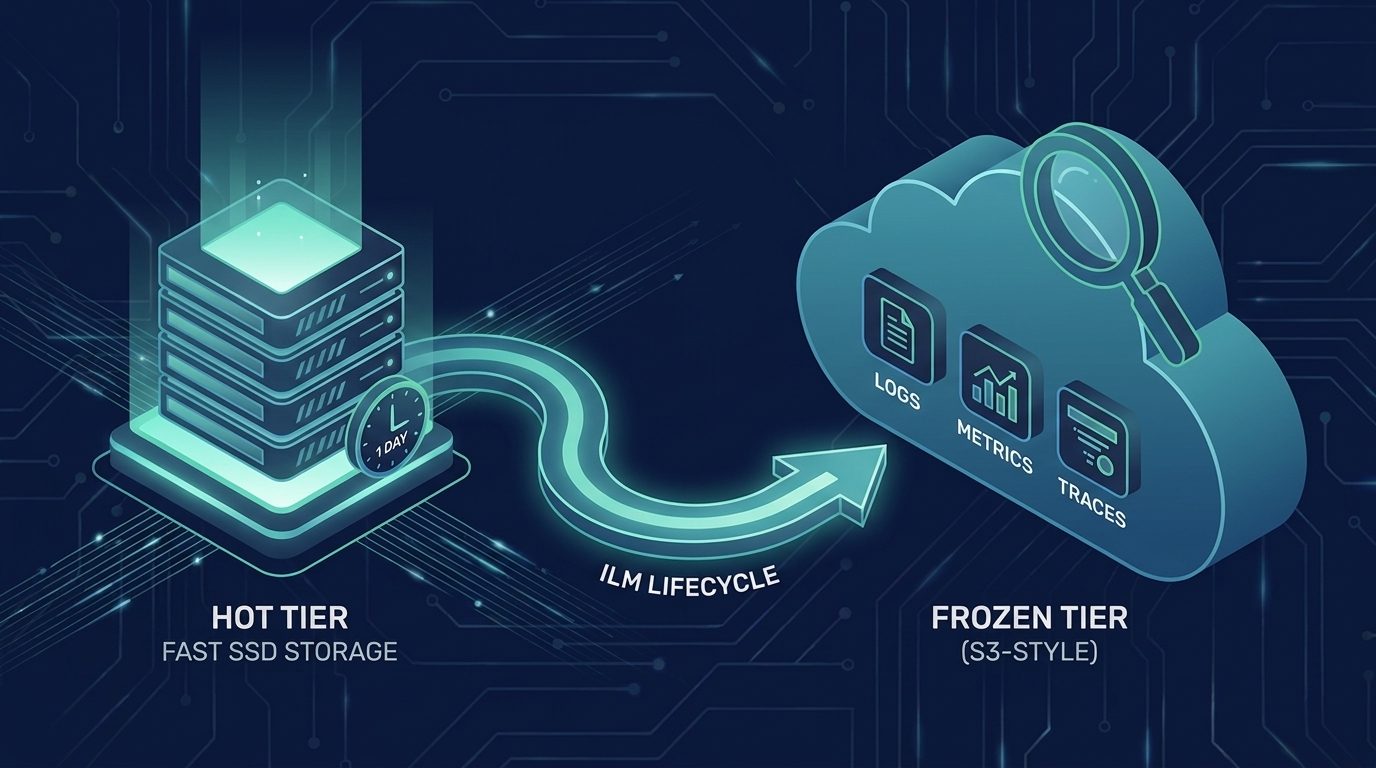
Cut log storage costs with two Elasticsearch data tiers instead of four
Elastic benchmarked one day of logs on SSD with everything older moved to frozen searchable snapshots, and it came out 16x cheaper than keeping all of it hot. The ILM policy and the cost model are both in the post.
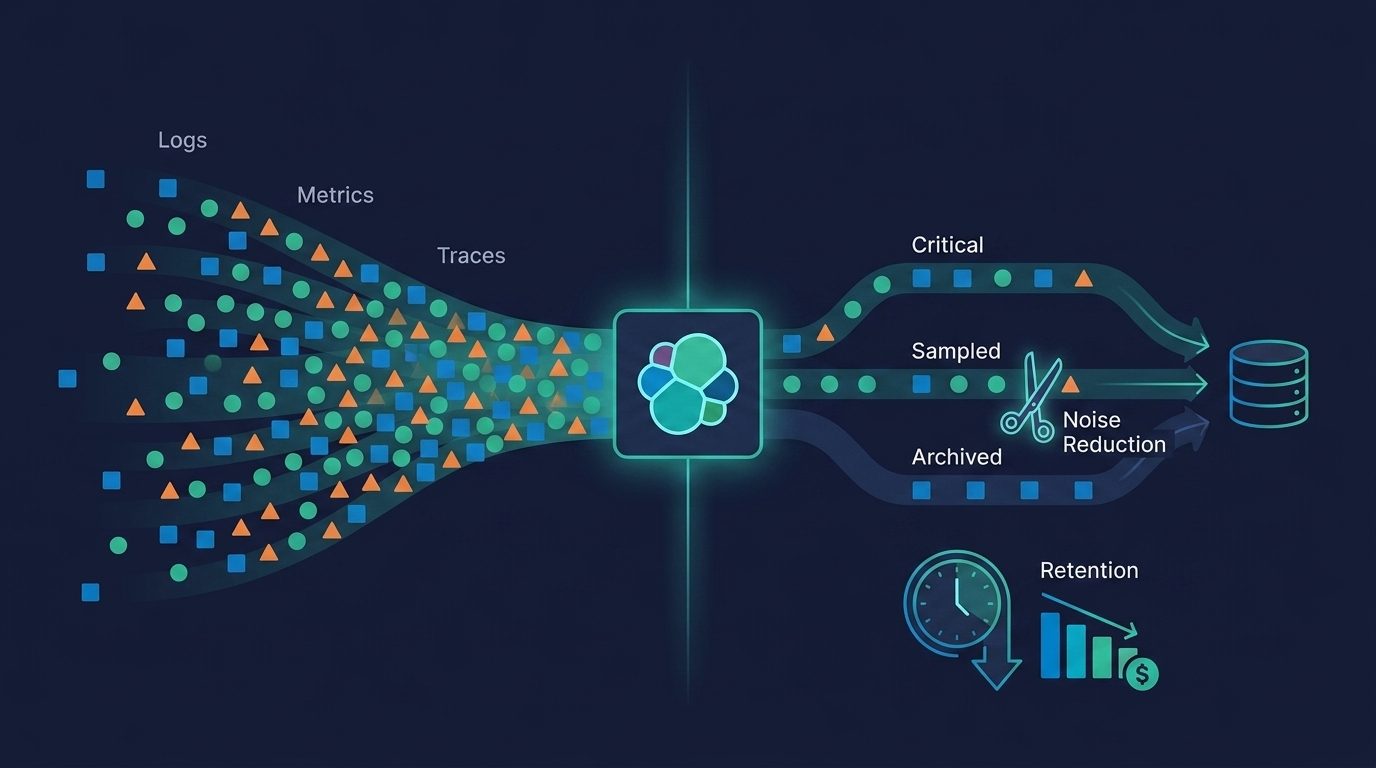
Not every log deserves 90 days: per-stream retention in Elastic Streams
AI Partitioning reads your data and proposes child streams. Retention, drops and downsampling then become per-stream settings, so the noisy ones expire on their own schedule.

Cross-project search for Elastic Observability: one query across every linked project
Keep your observability data where it lives, and still search, alert, and monitor across every linked Serverless project, easily!
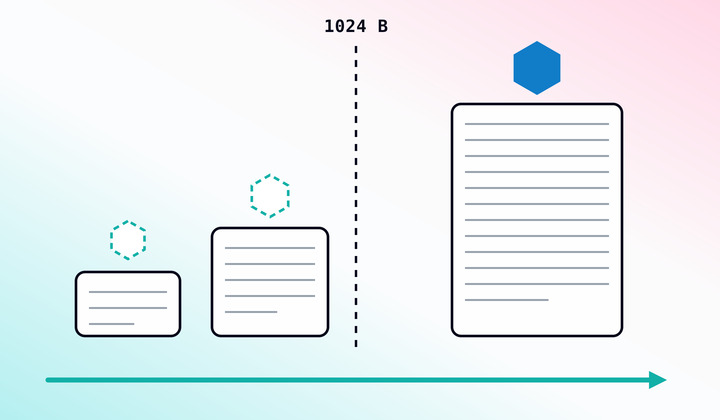
No log file too small: How Elastic Agent tracks files below the 1 KiB threshold
Elastic Agent 9.5 builds a small log file's identity out of the bytes it already has, then re-links it as it grows and crosses 1024 bytes, so it is never re-ingested.
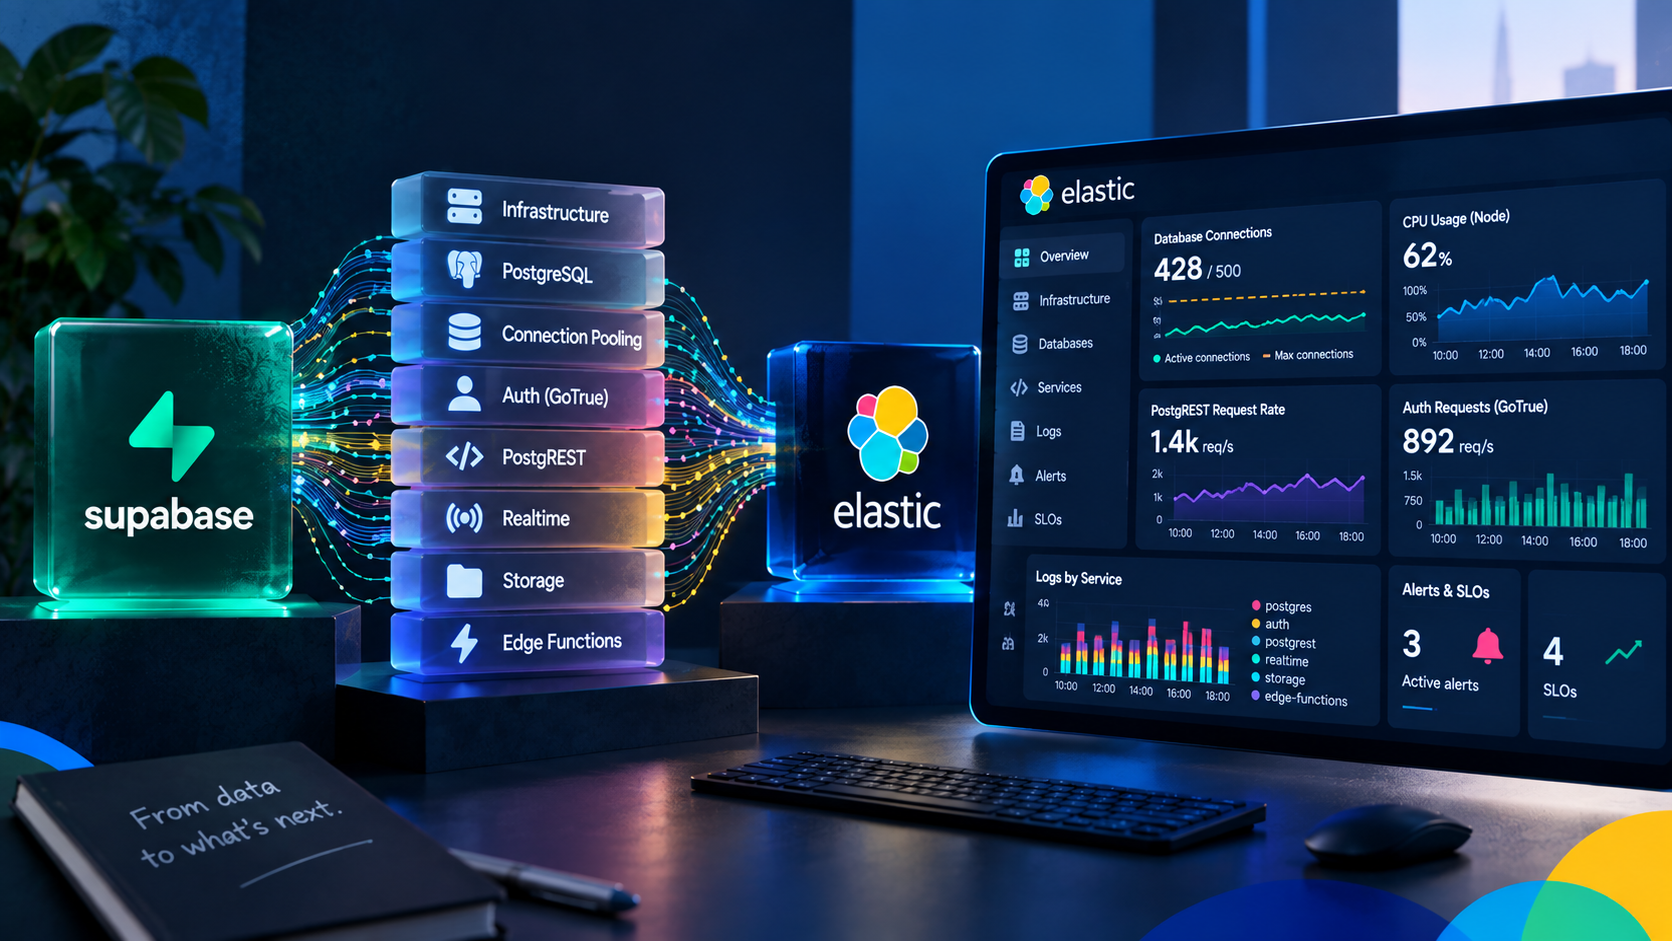
Monitor Supabase in Elastic: dashboards, alert templates, SLO templates, and zero agents
When your Supabase API goes slow, it could be the node, Postgres, the pooler or PostgREST. Elastic tells you which one and shows you the logs from whichever it was.
.jpg)
Collecting rootless Podman logs with Elastic Agent: the CRI parser, user-scoped paths, and the Podman socket
Rootless Podman containers write their logs in CRI format. This Fleet policy reads them and attaches container.* fields, with the match_source_index value that rootless paths need.
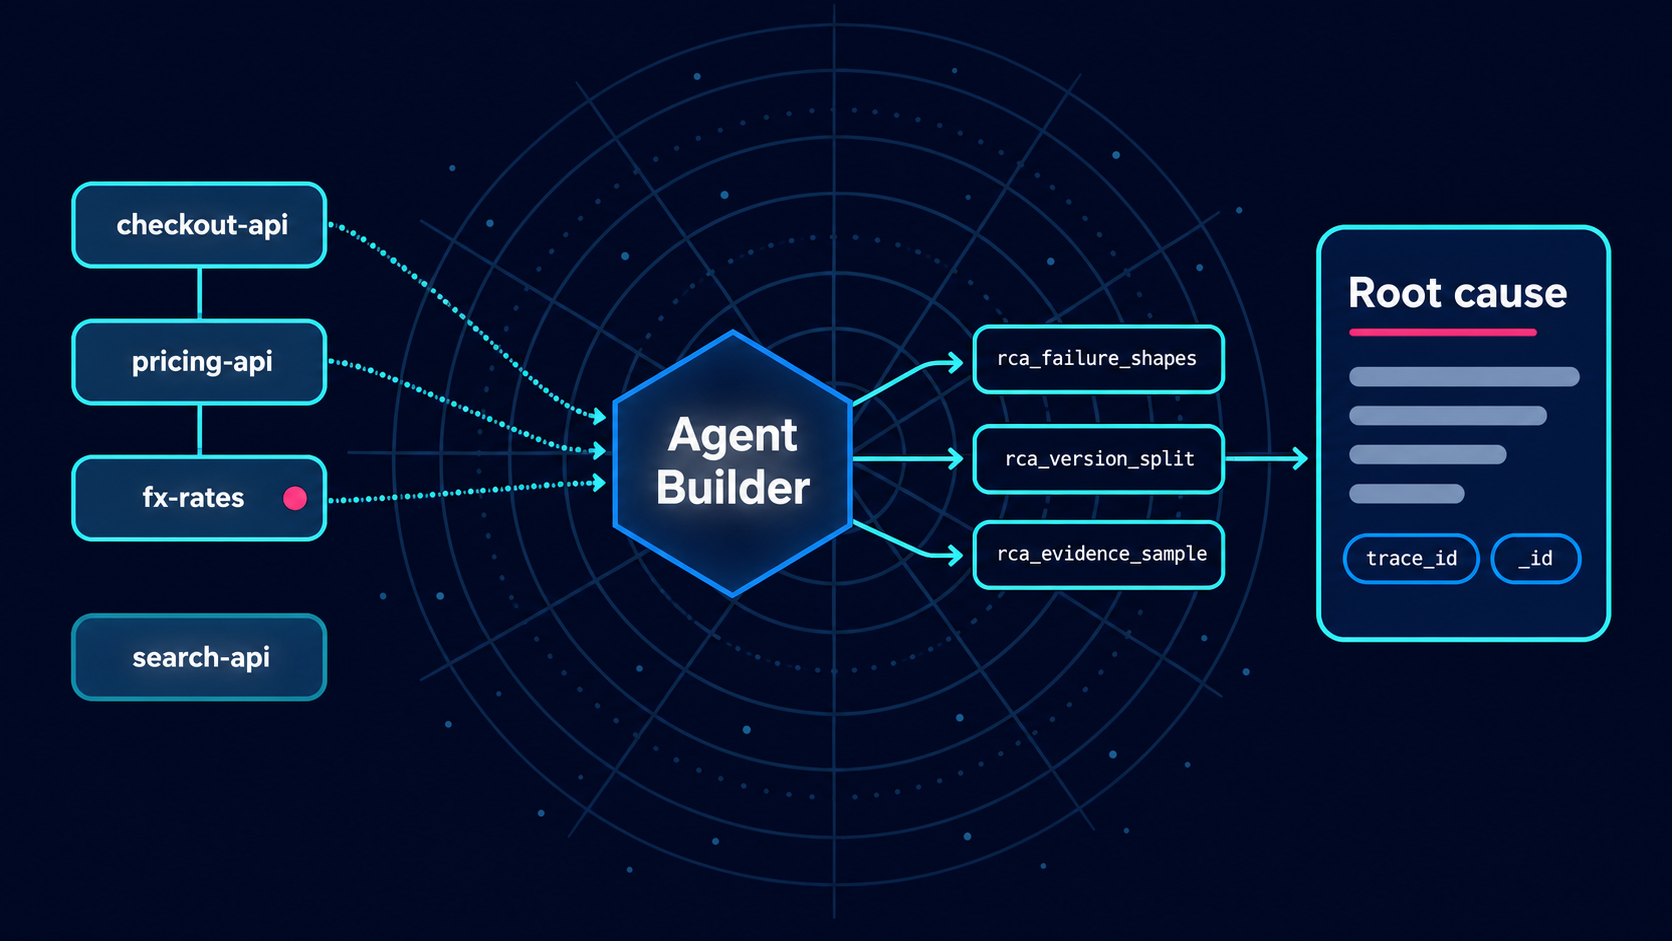
AI root cause analysis in Elastic Agent Builder that cites its evidence
The new release failed at 27.2%, the old one at 28.2%, so the deploy was never the cause; the agent worked that out in 72 seconds and handed back a trace ID for the failure that was.
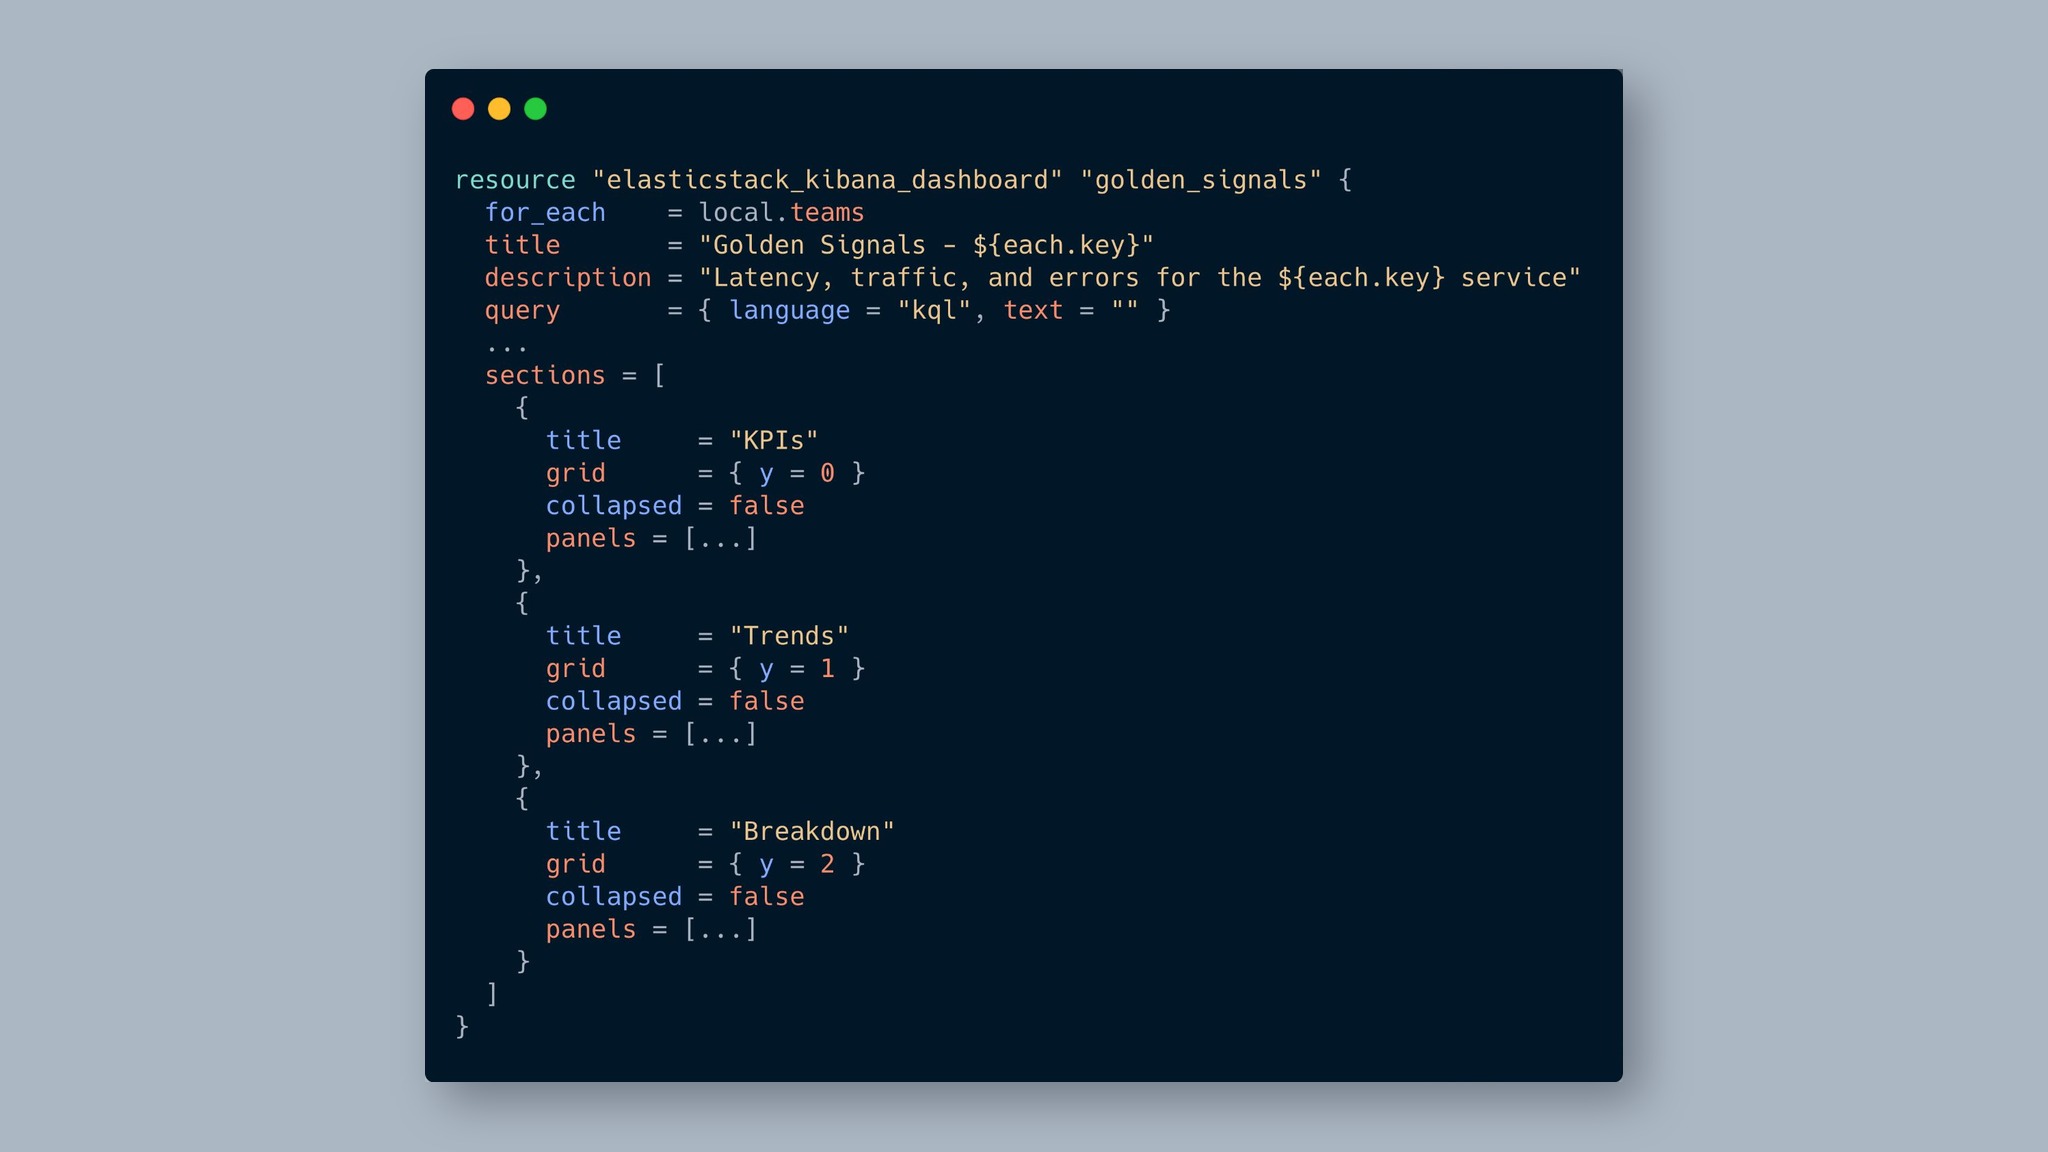
One edit, every dashboard updated: managing Kibana observability at scale with Terraform
Define your golden-signals panels once in a shared HCL library and use for_each to generate every team's dashboard, with drift detection and git rollback built in.
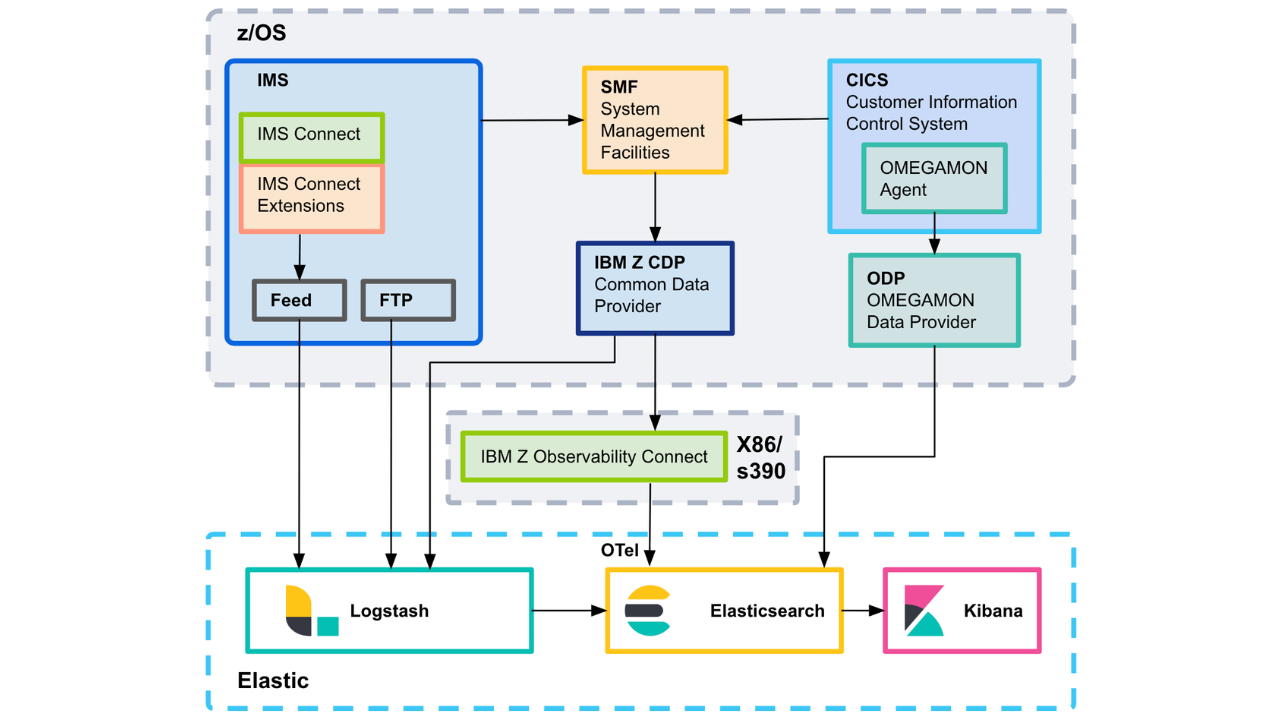
Elastic z/OS ingest: five architectures for mainframe data
This field guide walks through the ingest architectures I've seen work in production, the data quality checks that decide whether your dashboards actually work, and the ECS mapping that makes mainframe data usable to the platform.
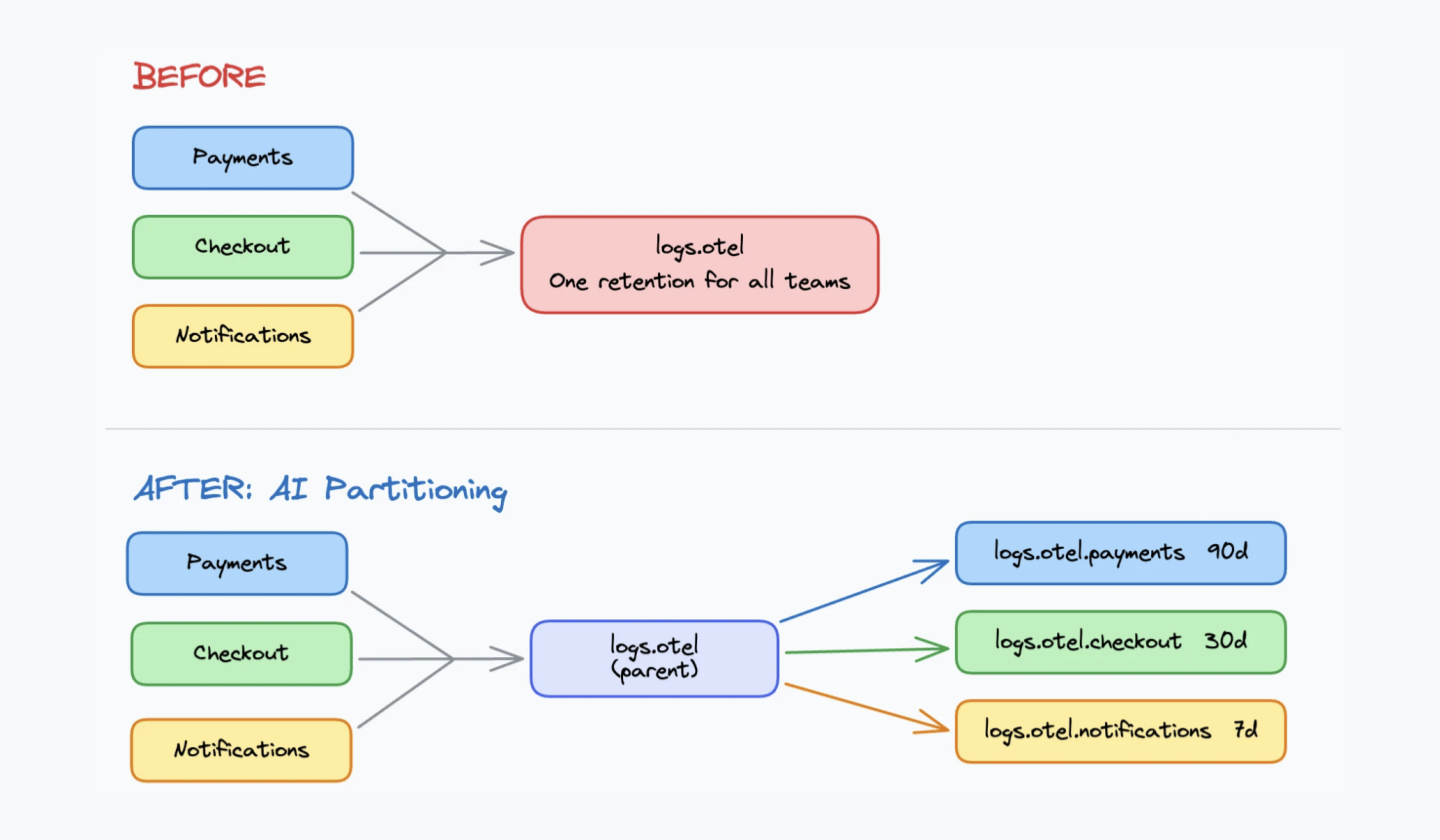
One OTLP endpoint, three teams, zero routing rules: Elasticsearch Streams AI Partitioning
Stop writing log routing rules upfront. See how Streams AI Partitioning reads your data, proposes child streams, and lets you set per-team retention in minutes.