One ES|QL query, 365 days of audit logs: Same search on hot data and searchable snapshots
Collect audit logs with the EDOT Collector, then confirm the 365-day retention policy actually applied before an auditor asks you to.
Elasticsearch turns raw logs into structured, searchable data at ingest. Follow the collect and analyze logs tutorial to see it end-to-end. Start a free cloud trial or try Elastic on your local machine now.
The same Elasticsearch Query Language (ES|QL) query that reconstructs a user’s activity on live data runs unchanged against a mounted searchable snapshot, which is what makes a 365-day audit logging policy workable. You investigate a year-old event the way you investigate yesterday’s.
In this article, we follow six audit events from a company’s admin console through the Elastic Distribution of OpenTelemetry (EDOT) Collector into a dedicated data stream. One of them is a user named alex, who fails two login tries but gets in on the third and then attempts a role change. We reconstruct that timeline with one ES|QL query and read back the retention policy to confirm that it applied. Then we rerun the same query on a snapshot-backed index. The evidence comes back in a form that you can hand to an auditor and explain.
Prerequisites
Elasticsearch and Kibana 9.5+
Docker, to run the
elastic-otel-collector:9.5containerAn API key created by a superuser
You can find the companion notebook here. It reproduces the whole lab from this article, including the collector configuration and the searchable snapshot, and the steps in between, and it cleans up at the end.
What audit logs tell you that application logs don’t
Application logs usually explain how software behaved, such as a timeout or an exception, or even a failed connection. Audit logs establish accountability by recording an actor, action, target, outcome, and time. They can help debugging, too, but their value is in reconstructing activity and demonstrating how controls operated.
A Kubernetes RoleBinding change captured in full
In Kubernetes, a Role defines permissions and a RoleBinding grants them to an identity within a namespace. Changes to both are auditable when the audit policy includes those resources. Here’s a real RoleBinding creation that was captured in an isolated Kubernetes 1.35.0 lab. It was collected through OpenTelemetry (OTel) and queried in Elasticsearch
The successful request grants the deploy-bot service account the existing pod-reader role in payments. The RoleBinding's subjects and role reference come from its request body, captured by this lab's targeted Request audit level. Metadata logging alone would omit that body.
Where audit logs come from
Common sources cover different parts of the story:
Source | Questions it can answer |
|---|---|
Kubernetes API audit logs | Who requested a resource change, and how did the API server respond? |
Cloud provider trails | Which principal performed an API operation on which resource? |
Authentication systems | Who signed in or failed authentication? Who changed privileges? |
Database audit logs | Who accessed a sensitive object or changed database permissions? |
Collection starts with enabling the right events at the source. Cloud data-access events may need separate configuration; database slow-query logs aren’t a complete access audit. For Kubernetes setup, use the existing managed Kubernetes audit-log tutorial.
Four requirements for an audit logging pipeline
Four requirements shape an audit pipeline:
Requirement | Design decision |
|---|---|
Long retention | Keep audit data in streams with an explicit retention policy, separate from short-lived operational logs. |
Immutability | Define who shouldn’t be able to alter or delete records, and for how long. A read-only index doesn’t prevent privileged administration. |
Tamper-evidence | Preserve originals and independently protected verification material so changes or missing records can be detected. |
Access control | Separate collection, investigation, and retention administration; record changes to those controls. |
For System and Organization Controls 2 (SOC 2) or ISO/IEC 27001, logs support the evidence behind your controls; storing them doesn’t establish compliance. Agree which activities to record, how long to retain each copy, who can retrieve it, and how exceptions or legal holds work. Neither framework gives this lab a universal 365-day retention requirement.
Search and preservation need complementary controls. For example, CloudTrail integrity validation uses signed digest files that must actually be validated. Where write-once retention is required, design a source archive using appropriate controls, such as S3 Object Lock. An indexed JSON string isn’t a substitute for that archive or its validation material.
How to collect audit logs with the EDOT Collector
The retention walk-through uses six fictitious application-audit JSON events: four for the user alex and two for a second user, priya, so the actor filter has something to exclude. The EDOT Collector runs as a container and ships to Elasticsearch and Kibana 9.5.3 on Elastic Cloud Hosted (ECH). The configuration is based on Elastic's documented file log collection and JSON parsing procedure: a filelog receiver with a json_parser operator and a resource processor that sets data_stream.dataset and data_stream.namespace, along with the elasticsearch exporter, in otel mapping mode. This article focuses on the decisions and results; the complete configuration and commands are in the companion notebook.
Why the json_parser uses parse_to: attributes
The collector parses the source timestamp and fields and then sends records to the dedicated logs-audit_demo.otel-lab data stream. The exporter builds that name from the dataset and namespace and appends .otel to the dataset.
Unlike the documented example, which uses parse_to: body, the lab's json_parser uses parse_to: attributes, so the parsed values go under attributes and the original JSON string stays in body.text. With parse_to: body, the fields would end up in body.structured and the original string would be lost. All six stored strings matched the fixture lines in this test. Elastic Common Schema–based (ECS-based) integrations can use root fields, such as user.name, so check the schema before reusing a query.
Reconstruct an actor’s timeline with one ES|QL query
In Kibana Discover, select ES|QL, Elastic's piped query language. The time picker uses the time zone of the dateFormat:tz advanced setting, which defaults to the browser's, so set it to UTC in Stack Management > Advanced Settings before entering the absolute window 2026-09-07T04:59:00Z through 2026-09-07T05:06:00Z. Then run the following:
FROM logs-audit_demo.otel-lab
| WHERE attributes.user.name == "alex"
| SORT @timestamp
| KEEP @timestamp, attributes.event.action, attributes.event.outcome,
       attributes.audit.target, attributes.source.address
| LIMIT 100
Notice that the last event is a failed role change. So far, we only know that alex tried to change a role and was denied, which isn’t the same as a permission change or a compromised account. To find out what happened, the next step is to look at identity-provider and resource activity within the same tenant and time window.
When comparing the screenshot with the query, keep in mind that the fixture uses UTC and Kibana displays timestamps in the browser's time zone (in this case, UTC−05:00). That’s why the rows show 00:00, while the time window is set in UTC.
Discover's time picker constrains this query; API clients need an explicit timestamp filter, and the notebook adds one. When handing evidence to a reviewer, record:
The query.
The UTC window.
The source.
The retrieval time.
The result limit.
LIMIT 100 is a bounded investigation view, not an exhaustive export.
Confirm that every audit event arrived
The data stream held six records with six distinct event IDs before and after a normal collector restart, because the filelog receiver keeps its file offsets and the exporter keeps its sending queue in the file_storage extension. At scale, also monitor source coverage, parse failures, queue saturation, and delivery lag. This six-event check is a functional test, not an ingestion benchmark or an exactly once guarantee.
Set a log retention policy that you can verify
A retention setting should be something that you can verify. On ECH, the built-in logs-*-* templates hand new data streams to the logs index lifecycle management (ILM) policy, so the lab gave its stream a dedicated index template, configured as follows:
Priority 500, higher than the built-in logs templates that also match the stream name, so Elasticsearch applies this template instead of them.
Copies the built-in
logs-otel@templatecomponent list.Restricted to
logs-audit_demo.otel-*.Sets
index.lifecycle.prefer_ilmto false.Defines a 365-day data stream lifecycle.
The data stream API then reported the backing index as managed by data stream lifecycle, and the lifecycle read-back reported effective_retention: 365d:
Why your audit data stream ignores the retention policy you set
Data stream lifecycle retention is a minimum retention mechanism based on backing-index lifecycle timing, not an exact per-event deletion deadline. A successful read-back proves configuration, not a year of availability. Rehearse retrieving the oldest required records, and review source coverage regularly. For the retention interface and ILM comparison, see retention management with Streams.
Capacity planning for long log retention
Long retention also changes capacity planning. Daily ingest volume multiplied by retention days gives a starting raw volume; mappings, compression, replicas, query concurrency, and tier placement affect the actual resources needed. Size and test against representative investigations across realistic data ages.
Query older audit logs with searchable snapshots
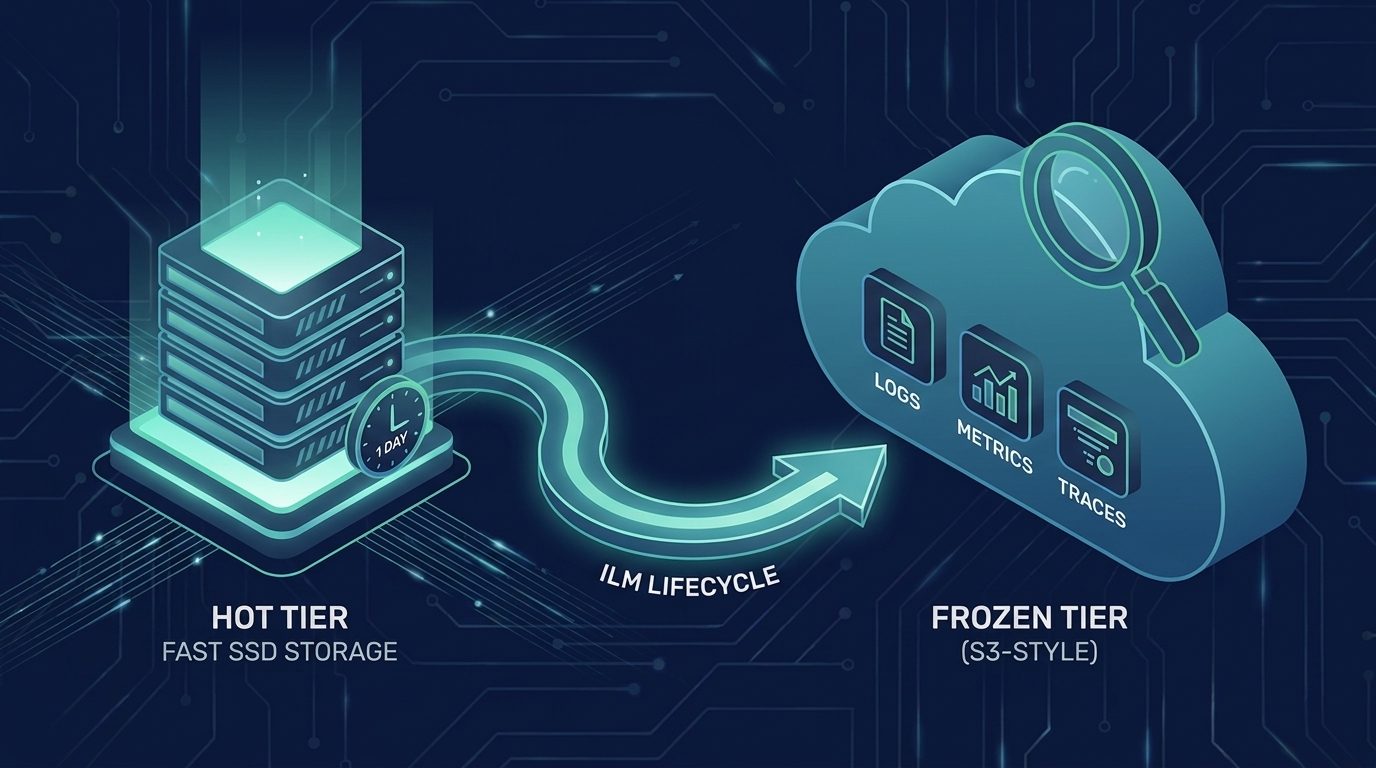
Searchable snapshots keep snapshot-backed indices queryable through Elasticsearch. Fully mounted indices can serve older data from the cold tier; partially mounted indices use a shared local cache in the frozen tier. This gives recent and older evidence a common query surface, with storage and retrieval tradeoffs to test for your workload:
The audit lab took a snapshot of its six-event backing index and mounted it. It then reran the same actor query:
The same four events were returned. This used full_copy on available hot nodes with an Enterprise license; it didn’t benchmark cold/frozen costs or latency. The backing snapshot must remain available while its mounted index uses it, and local cache isn’t a backup. The separate lab mount also needs its own retention and cleanup plan.
Who can read and change your audit logs
Use role-based access to give investigators read and view_index_metadata on the required audit data, plus Discover read access in the intended Kibana space. Keep retention and snapshot administration in separate roles. Roles are additive, so a reader role doesn’t remove permissions granted elsewhere.
The collector's API key only carries create_doc and auto_configure on its stream, and the has privileges API confirmed that it has no index, write, delete, or manage privilege there. That limits the collector's authority; it doesn’t make the records immutable against administrators. Also plan Elasticsearch and Kibana audit logging for the evidence platform itself, subject to deployment and subscription requirements.
Connecting Kubernetes audit logs to container runtime data
For the Security Labs crossover, correlating Kubernetes audit logs with container runtime data shows how API activity connects to what runs inside a workload. Stable identities and resource context make that connection possible. Our small application fixture demonstrates timeline reconstruction; it doesn’t validate those Kubernetes detection rules.
Where to start with audit log management
Start with one audit source and one question that you must answer months later. Verify delivery, preserve the required originals, rehearse searches across recent and retained data, and review who can change the evidence path. Elastic brings collection, structured investigation, searchable retention, and scoped access together; your policy defines the evidence that those capabilities must preserve.
How helpful was this content?
Related Content
The service with the most errors was healthy: root cause analysis from logs with ES|QL
14 alerts, 1 incident: Measuring alerting rule noise with ES|QL in Elasticsearch