Two rules, one outage, one alert: How change point detection cuts alert noise
The discovery agent re-runs each firing rule’s own ES|QL query against the logs unchanged, so the alert names the unreachable service with the query that proves it.
Build and observe AI agents where your data already lives. Begin with Elastic Agent Builder. You can also start a free cloud trial or try Elastic on your local machine today.
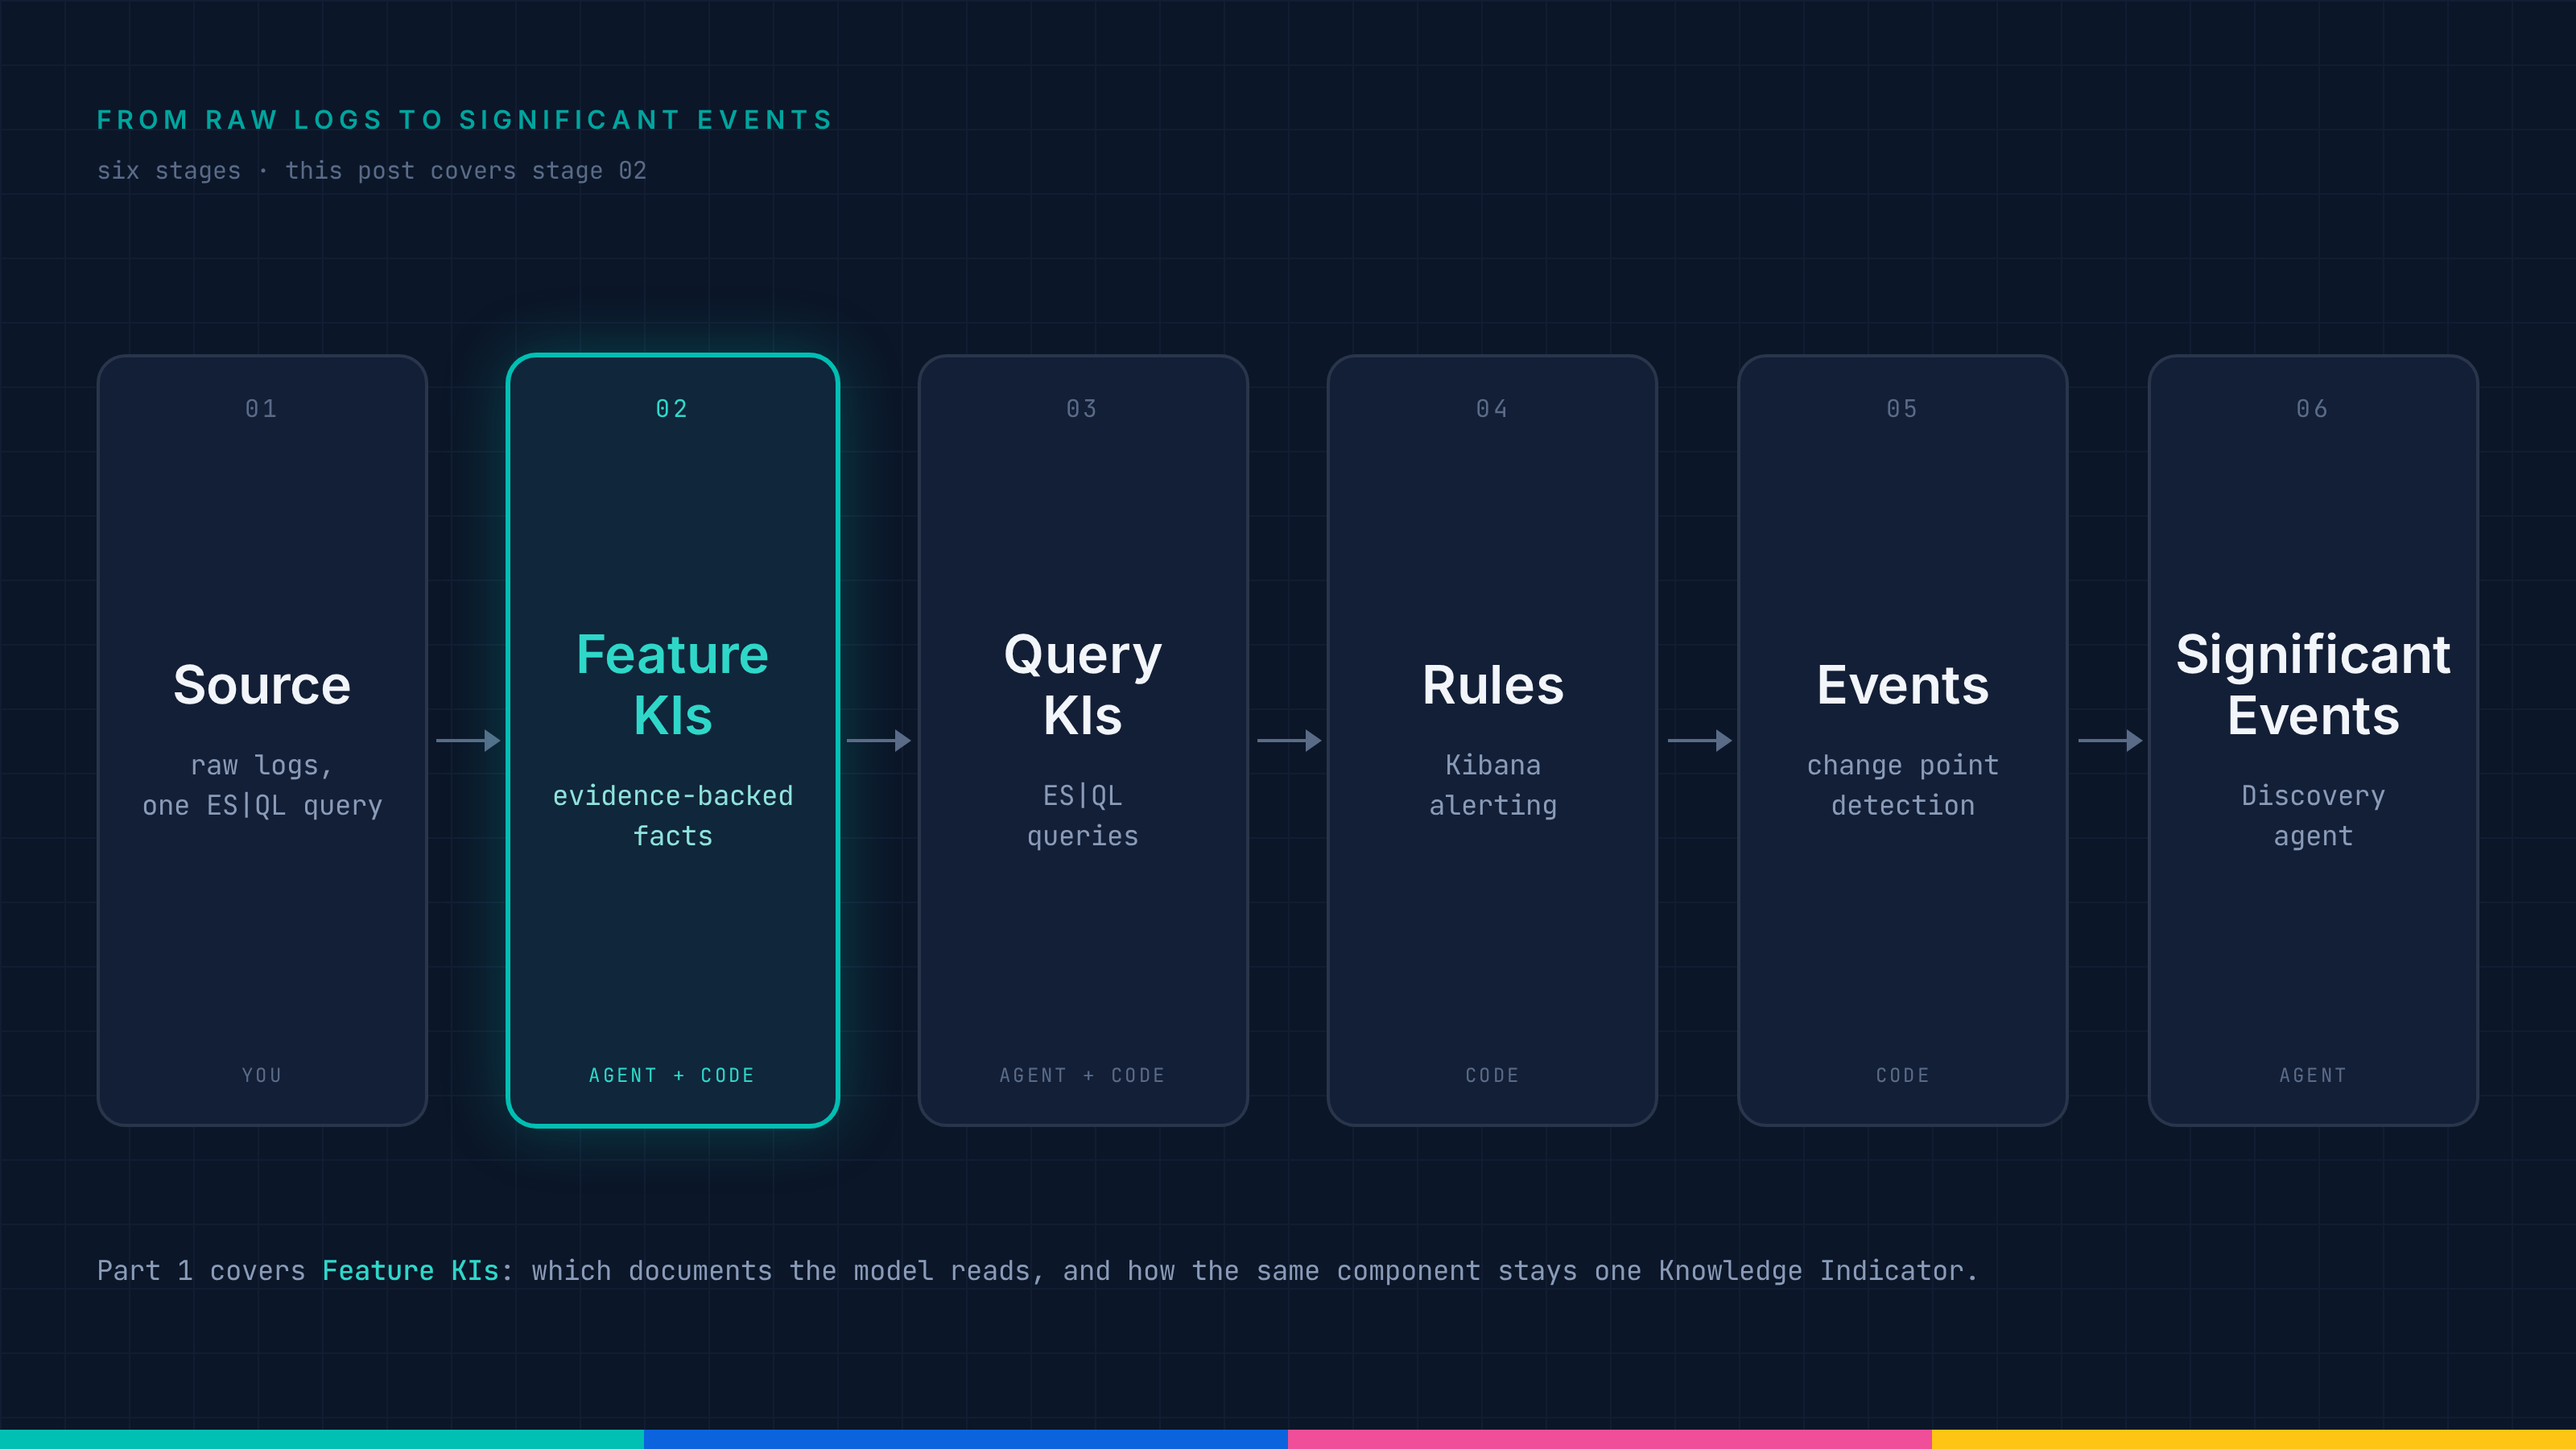
Two ES|QL rules fire for one payment outage, and Significant Events raises one alert. It re-runs each rule's own query against the logs, counts 1,156 failing lines in the last hour and names payment as the unreachable service. Every number in the alert carries the query behind it, so you can inspect the evidence yourself. This is the last of three posts. Part 1 samples a source's logs and extracts Knowledge Indicators (KIs), the evidence-backed facts about its services, dependencies and failure modes. Part 2 turns those KIs into validated ES|QL queries and promotes the strongest into rules. This post covers what happens when those rules fire.
Part 2 ended with a query that matches nothing while the shop is healthy and 676 documents once payments start failing. A second query on the same payment path fires too. Two rules firing for one outage are still two alerts, and neither one tells you whether the failure is real or whether it is still going on.
Change point detection notices that a rule's behavior changed. A discovery agent then re-runs each changed rule's own ES|QL query against the logs, measures how much is failing, groups the rules that describe the same incident and rates how severe it is. Grouping is where the noise reduction happens, and it is why both payment rules land in one alert instead of two.
The running example is the same as in Parts 1 and 2: the OpenTelemetry demo on Kubernetes, shipping its container logs to logs.otel. Partway through the capture we point checkout at the wrong port for payment and triple the load generator's users, so every order fails at the payment step. The detections and the alert below come from one replay of that scenario.
Code and model split the work the way Part 1 and Part 2 drew it. Code decides which rules changed, which detections reach the agent, what an alert's status is and what gets stored. The model decides whether the logs confirm a rule, which rules belong together and how severe the incident is. It can't edit a rule's query, so it can't rewrite one to agree with its own hypothesis. Every claim it makes has to trace back to a query result or a Knowledge Indicator (KI), the evidence-backed facts Part 1 extracted from the source.
How query KIs become Kibana alerting rules
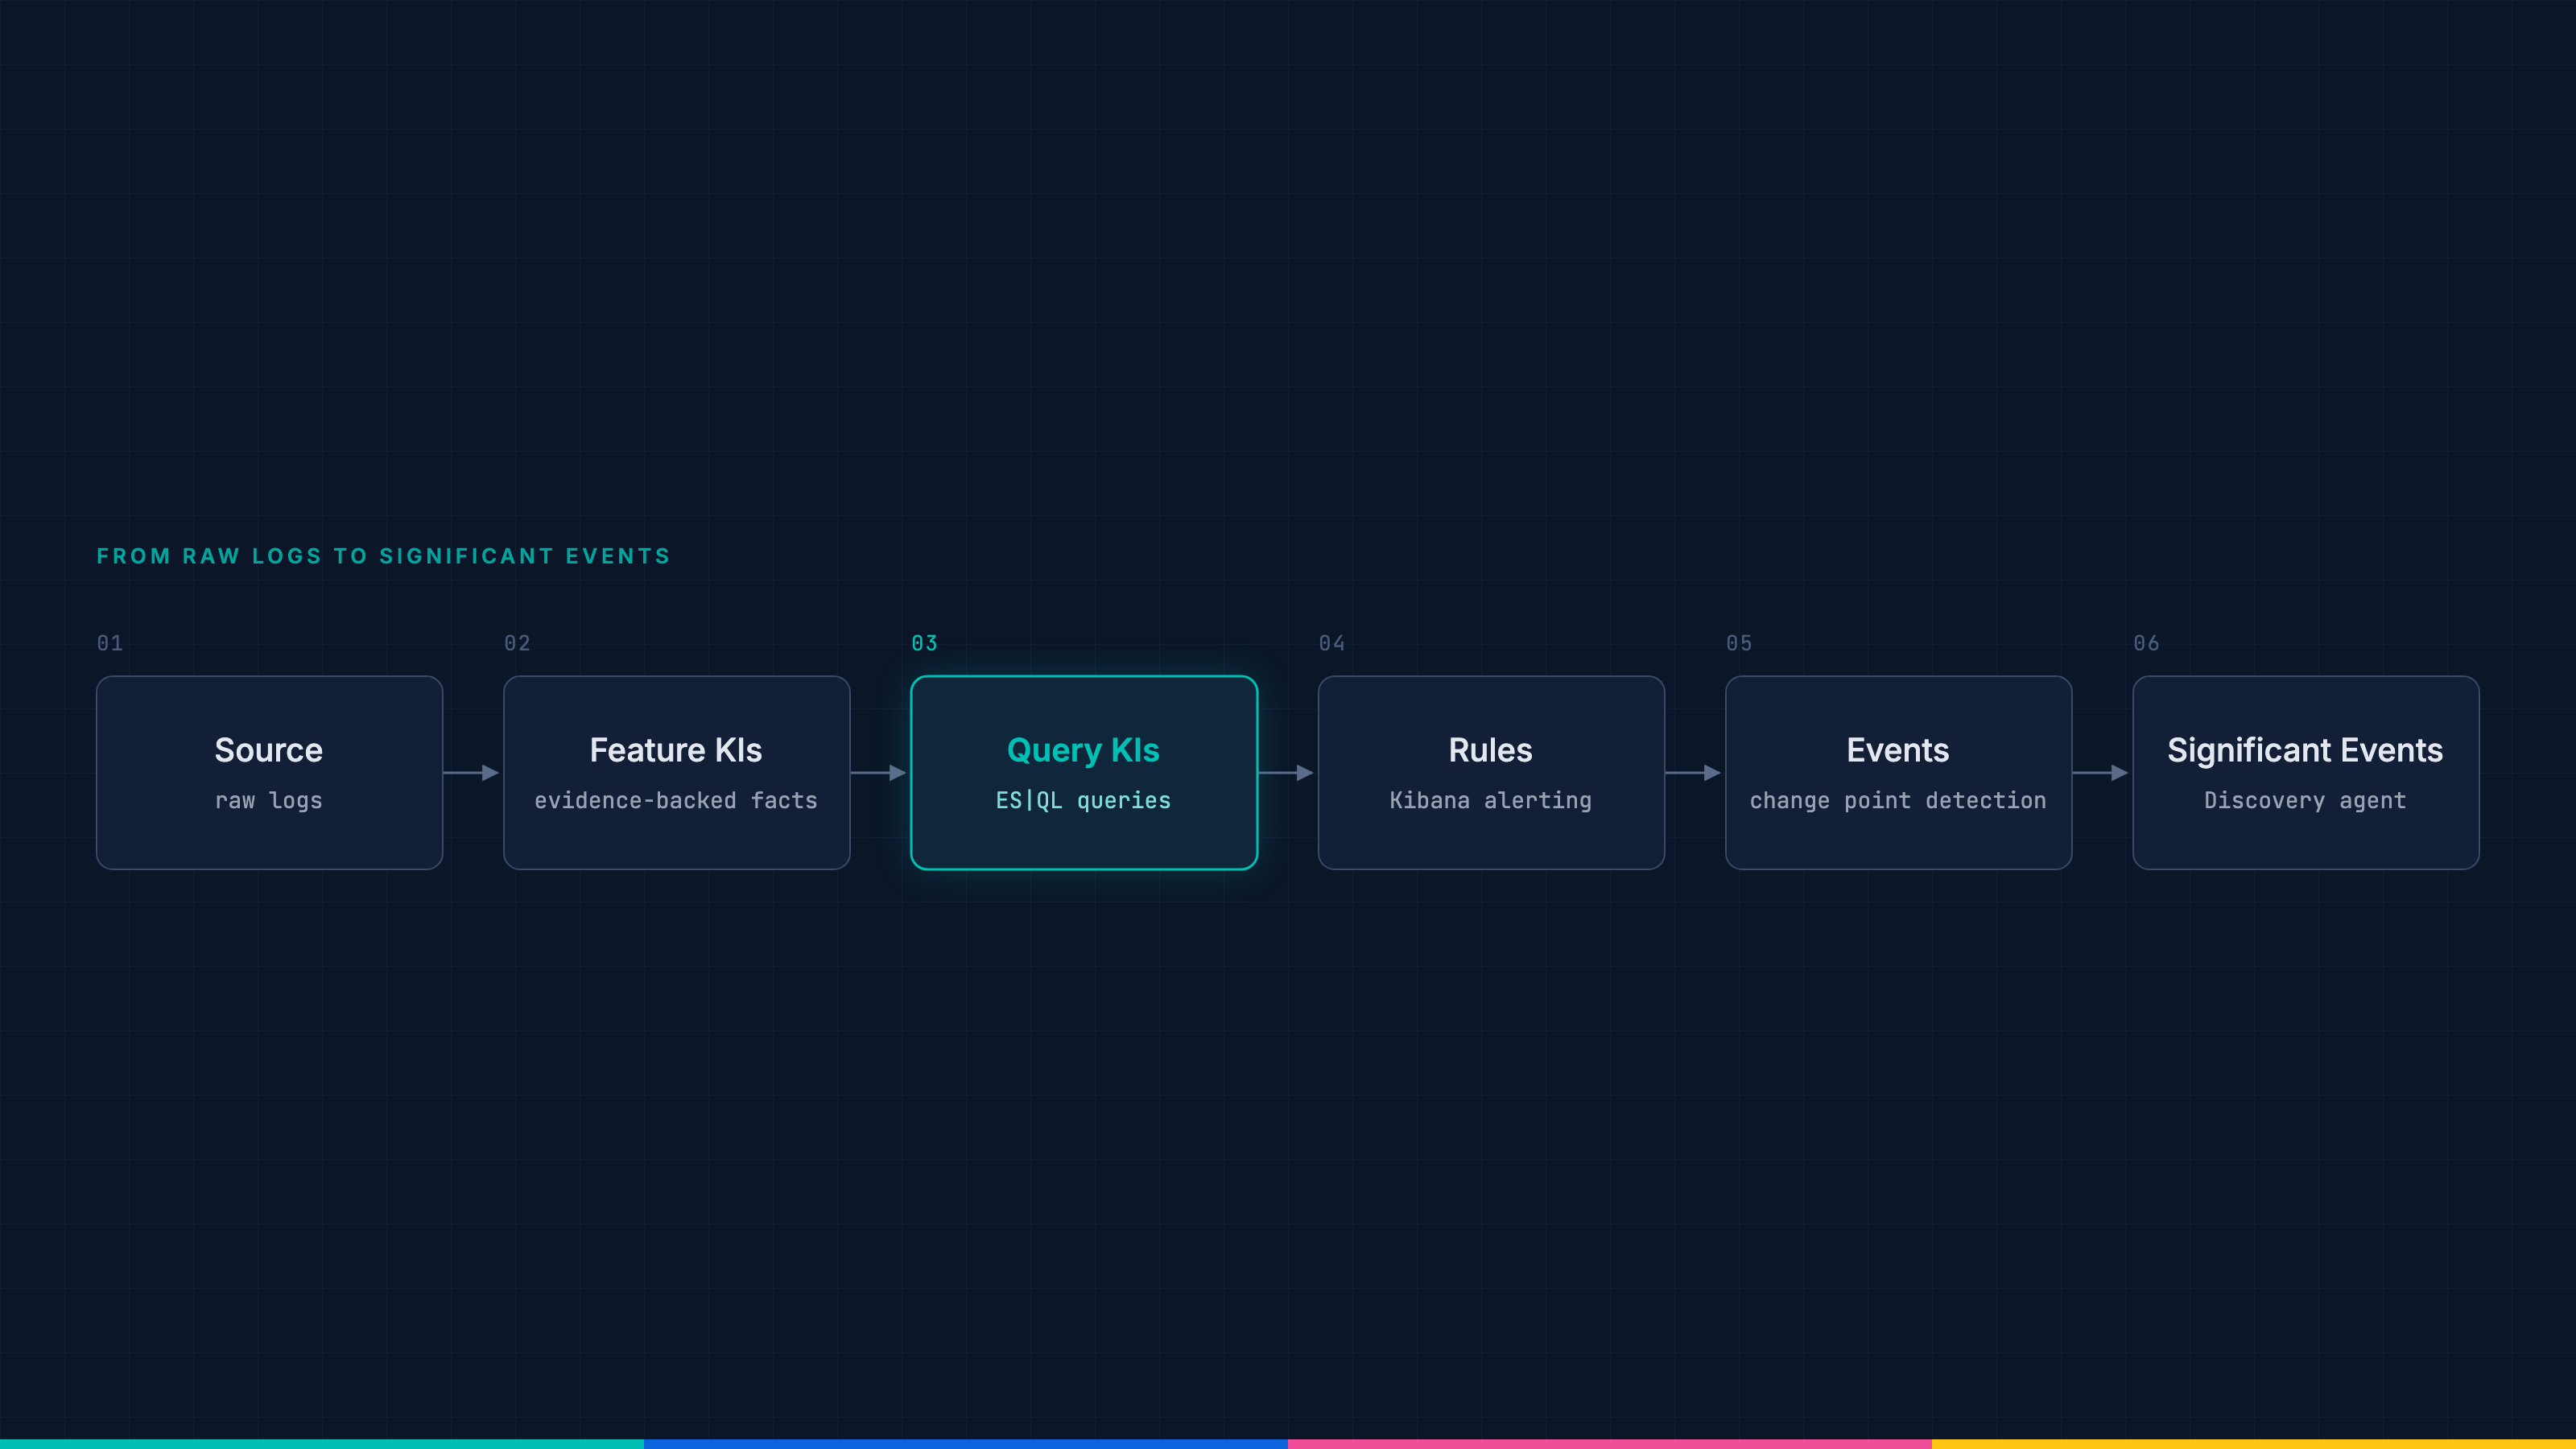
The Rules stage: the query KIs from Part 2, promoted to Kibana alerting rules.
Each query KI from Part 2 is an ES|QL query with a severity score, and the strongest of them become rules. A match query that scores high enough is promoted automatically to a Kibana alerting rule, which runs in Alerting v2, the alerting framework in Kibana. The rest stay stored as KIs, and you can promote any of them by hand.
A promoted rule runs its query on a schedule and records what it found each time. That record, run after run, is what the rest of the pipeline watches. In this capture four queries were promoted: the two payment queries, both scored as critical, and two that watch for email delivery failures and Kubernetes restarts.
How change point detection finds a real change
The Events stage: change point detection turns a rule's firing pattern into detections.
Over time, each rule's results form a time series, and the question changes from "did this rule match?" to "did this rule's behavior change?"
A source can log the same tolerated error all day. A fixed threshold would need a baseline for each rule that nobody knows in advance, and the queries from Part 2 come without one. So the detection workflow compares every rule with its own recent history. It passes each rule's series through the Elasticsearch change_point aggregation, which reports whether the series changed (a spike, a dip, a step, a shift in trend) and how significant that change is. The workflow runs on a schedule and spreads the rules across its runs, so every rule is checked regularly without analyzing all of them at once.
How closely a rule is watched depends on the severity score Part 2 gave it. Critical rules are analyzed over a short recent window in fine-grained buckets, which catches brief changes. The rest are analyzed over a longer window in coarser buckets, which trades reaction time for fewer false alarms on rules that matter less.
When a rule's behavior changes, the workflow records a detection: which rule changed, what kind of change it was and how significant. A rule that stays in the same state through an outage produces one detection, not one per check.
In this capture both payment rules changed the same way, in the same detection run:
[
  {
    "rule_name": "Payment gRPC Connection Failure (frontend → payment)",
    "change_point_type": "spike",
    "p_value": 0.0000127,
    "severity_score": 85
  },
  {
    "rule_name": "Payment Service gRPC Unavailable (connection refused or i/o timeout)",
    "change_point_type": "spike",
    "p_value": 0.0000127,
    "severity_score": 85
  }
]
Both queries match the same 676 documents during the outage, so their series jump together. A p-value of about 1 in 80,000 means a jump that large is very unlikely to be noise.
Code decides which rules produce a detection, so the model only runs on rules whose behavior changed. Most rules never get that far:
Rule | Detection? | Why |
|---|---|---|
Rule that never fired | No | Nothing to analyze |
Rule firing at a steady rate | No | The series is stationary, so its behavior didn't change |
Rule whose behavior changed | Yes | A spike, dip, step or trend change is recorded once |
Rule still in the same changed state | No | It already has a detection for that change |
Rule on a disabled source | No | It isn't scanned |
Detections wait in a queue for the discovery agent, and the most urgent go first, by severity and by how long they have waited. A detection is marked done only once the agent reports it done. If anything fails along the way, including the write of the alert, the rule stays in the queue for the next run.
In this capture, two of the four rules promoted in Part 2 produced detections: the two payment rules. The email and Kubernetes restart rules never matched, so they never reached the agent. Neither did the checkout startup query, the most precise query in Part 2. It scored 25, was never promoted to a rule, and so never fired.
How the discovery agent turns detections into Significant Event alerts
The discovery agent turns detections into Significant Events alerts.
The discovery agent is an Elastic Agent Builder agent. Its starting message is only the batch, one row per rule with the rule name, the source, the kind of change, how significant it was, and how often the rule changed recently.
A change point shows only that a count moved. The agent works out the rest from the source's logs and from what Part 1 and Part 2 built: whether the failure the rule describes is happening, how bad it is, and whether it is still going on.
For each detection the agent first looks up the query KI behind the rule, and through it the feature KIs the query was built from, which name the services, dependencies and infrastructure the rule is about.
Then it re-runs the rule's query. The confirmation query is the KI's stored query with a time filter in front and the most recent rows requested:
FROM logs.otel
| WHERE @timestamp >= ?_tstart AND @timestamp < ?_tend
| WHERE MATCH_PHRASE(body.text, "rpc error: code = Unavailable")
    AND (MATCH_PHRASE(body.text, "connection refused") OR MATCH_PHRASE(body.text, "i/o timeout"))
| SORT @timestamp DESC
| LIMIT 5
As in Part 2, the query shows the stream name and runs over the source's view, and ?_tstart and ?_tend bind a window from 15 minutes before the detection to now. The agent may not edit the WHERE, rename a field or change the FROM. Part 2 validated this query against the source and grounded every phrase in it, so running it unchanged tests what the rule claims.
The agent then reads every returned row in full, and a row counts only if it shows the service, the error and the mechanism the KI describes. A line that contains the phrases while describing something else, such as a retry that went on to succeed or a call to a different service, isn't the rule's failure.
How to measure a failure’s spread, trend and duration
An operator deciding whether to get up at 3 a.m. needs to know how bad the failure is. So for every rule whose rows show a failure, the agent runs three more queries. Each keeps the rule's FROM, sets its own time window and reuses two parts of the rule's query:
<scope>selects every line the operation writes, failing or not, such as every card-charge call.<failure>is the condition that marks a line as failing. For the payment rule, it's theMATCH_PHRASEclauses.
Spread, over the last hour: what share of the operation fails, and in how many services.
FROM logs.otel
| WHERE @timestamp >= ?_tstart AND @timestamp < ?_tend
| WHERE <scope>
| STATS affected = COUNT(*) WHERE <failure>, total = COUNT(*) BY service.name
| STATS failed = SUM(affected), total_lines = SUM(total),
        services_hit = COUNT(*) WHERE affected > 0, services = COUNT(*),
        top_failed = MAX(affected),
        top_names = TOP(affected, 5, "desc", service.name) WHERE affected > 0
When the rule's query has no scope that isolates the operation, as with the payment rules, the agent uses a variant that filters on <failure> first and reports a count without a share:
FROM logs.otel
| WHERE @timestamp >= ?_tstart AND @timestamp < ?_tend
| WHERE <failure>
| STATS affected = COUNT(*) BY service.name
| STATS failed = SUM(affected), services_hit = COUNT(*),
        top_failed = MAX(affected),
        top_names = TOP(affected, 5, "desc", service.name)
Trend, over the last 24 hours: how the failing count moved, in up to 50 buckets.
FROM logs.otel
| WHERE @timestamp >= ?_tstart AND @timestamp < ?_tend
| WHERE <scope>
| WHERE <failure>
| STATS count = COUNT(*) BY bucket = BUCKET(@timestamp, 50, ?_tstart, ?_tend)
| SORT bucket ASC
First and last occurrence, over up to 14 days: when the failure started and whether it is still happening.
FROM logs.otel
| WHERE @timestamp >= ?_tstart AND @timestamp < ?_tend
| WHERE <scope>
| WHERE <failure>
| STATS earliest = MIN(@timestamp), latest = MAX(@timestamp)
All three are aggregations, so they return a handful of rows however large the source is. Together they tell the agent:
- Whether the failure is still happening. A latest occurrence a minute ago and a full last bucket mean it is ongoing. A latest occurrence an hour ago means it already ended, whatever the count did.
- Since when. The earliest occurrence gives a floor for the onset, since the failure has been going on since at least that time.
- How much, and where. The failing share and the number of services hit separate one noisy service from a failure every caller sees. When the rule's query has no scope that isolates the operation, as with the payment query, which matches error text only, the agent reports a failing count. For the payment rules it counted 1,156 failing log lines in the last hour, all from frontend, and recorded that the failing share wasn't measured. The count comes from a different run and window than Part 2's 676, so the two numbers differ.
These numbers set the severity and filter out noise. If the failure ended before the agent looked, the rows show successful calls, or the matched lines are a background error the system tolerates at an unchanged rate, the measurements show it and no alert is raised.
The agent writes these figures into each signal's description in a fixed form, so an operator reads the same shape every time. The alert in the 'What gets written to the alert' section below shows one.
Working out blast radius from the source’s topology
The last grounding step works out how far the failure reaches beyond where the rule looks. Using only the feature KIs it fetched, the agent places each confirmed failure in the source's topology and names the impacted entities: the entity that fails, and the services, dependencies and infrastructure its failure reaches. An entity is named only when the confirmed rows and the KIs' own evidence support it.
The payment query links to frontend-payment-grpc, checkout-payment-grpc and grpc-js, the stable feature IDs from Part 1, so today's topology names the same entities as yesterday's alert. In this capture the agent named only frontend-payment-grpc. Every confirmed row came from frontend, so the checkout edge, though linked to the query, had no confirmed evidence.
Alert noise reduction: Joining signals into one incident
Grounding leaves the agent with one signal per rule, the rule's checked and measured result. The next decision is which signals describe the same incident. Two signals belong to one incident in three ways:
- Topology match: they impact the same entities, such as a shared failing service, a shared dependency, or two callers of the same target.
- Symptom match: they show the same failure mechanism, such as the same error against the same target, with compatible effects.
- Cascade: one entity's failure explains the others along a dependency. A backend error and its caller's timeout are one failure seen from two ends, even though the log lines read differently.
Grouping is transitive, so if A belongs with B and B with C, all three are one incident. Two signals that share only a service name stay separate.
Incidents grow, so before opening anything new the agent checks the Significant Events that are still live, active or recovering. A signal whose rule already belongs to a live event either records that rule's recovery, when the failure is gone, or continues the event, when the failure still matches the same incident. A signal from a rule the event doesn't hold yet joins when its impacted entities appear in the event's topology and its failure fits the incident. The event gains the new evidence and its topology grows. Only signals that continue no live event are grouped into new ones.
The two payment rules from Part 2 match on topology and on symptom. Both link to frontend-payment-grpc, and both confirmed rows show payment as the unreachable target, so they become one Significant Event. The two rules are two ways of catching one failure: one matches the frontend's "failed to charge card" line, the other the gRPC error under it. Part 2 kept both because they are different queries, and discovery is where they are recognized as the same incident. A rule watching order placement in checkout that started firing an hour later would join it as a cascade, since its failing call goes to payment.
How severity and confidence are scored from the evidence
The agent rates severity for the Significant Event as a whole, from the measured impact across every signal it holds. The rules' severity scores set how closely detection watched them and their place in the queue, and they play no part here. Neither do the p-value, the kind of change or alert volume. The ladder is applied top-down, stopping at the first rung the evidence meets:
critical, when the evidence shows any of:- a global outage that reaches most users,
- several distinct core operations blocked at once,
- an impacted entity that other entities in the topology depend on, blocked end-to-end so it can no longer do its job, or
- confirmed exposure of sensitive data.
high, when an operation on an impacted entity is confirmed failing, with calls refused, timing out or not completing, or broadly degraded. A block confined to one endpoint or lookup path stays here, even when every caller hits it.medium, when the evidence shows minor confirmed degradation, or never settles whether the operation fails or only logs an error.low, when the evidence shows confirmed recovery or confirmed absence of impact.
A confirmed failure whose share or breadth couldn't be measured still rates high, and only evidence that leaves open whether the operation fails rates medium. The step from high to critical depends on what the failure blocks, such as several core operations or an entity others depend on. The measured share and whether the failure is ongoing decide which rung the evidence meets. When a new signal joins an open event, the event's severity is reassessed with it. The payment event rated high. Its assessment_note records why: card charging fails on the observed payment path, but the failing share and broader reach weren't measured, and no other blocked core operation was confirmed, so nothing lifts it to critical.
Confidence is a separate score that says how well the evidence supports the agent's explanation. It starts from how clear the change in the rules' firing patterns was, rises when the logs confirm several signals independently, and drops with gaps, such as a cause the agent couldn't pin to an entity or an impact it couldn't measure. The Significant Event's wording follows its confidence, so a weakly supported event is worded as a plausible explanation. The payment event's confidence is 0.65: two queries corroborate the same failure, but the measured counts are log lines rather than attempts.
Why alert lifecycle is derived in code, not by the model
A Significant Event is an alert in Alerting v2, the alerting framework that runs the rules from Part 2. It uses the same states as any other alert there, active, recovering and inactive, and Significant Events sets them in its own code:
- It opens
activewhen the logs confirm a failure, and stays active while any of its signals still shows it. - It moves to
recoveringonce every rule behind it looks healthy again. A recovering event is still live, so if the failure comes back, the same event returns to active. - It becomes
inactivewhen it is closed, by an operator or because the rules behind it no longer exist. A failure that recurs after that opens a new event.
Status is derived from what the logs showed for each rule, every time the event changes. The agent can't set it, so the same evidence always leads to the same state. For the payment event, each of the two rules needs a later detection whose re-run query finds the failure gone. Once both have recovered, the lifecycle moves the event to recovering.
What gets written to the alert, and what gets rejected
The agent proposes Significant Events, and code decides what is stored. Before anything is written, the write path checks the proposal:
- a new event needs a signal the agent confirmed from returned log rows, either the failure the rule describes or a concrete error found alongside it,
- a continuation has to name an event that exists, and
- a new event that would duplicate an active one isn't written; the active event is returned instead.
The Significant Event is stored as an Alerting v2 alert, in the same .rule-events index the rules from Part 2 write to. From then on it gets what Alerting v2 gives any alert:
- the fields an operator expects, a title, a status and a severity,
- listing and search wherever alerts appear, and
- routing to notifications and workflows through action policies.
Its lifecycle states come from Significant Events, as the previous section describes, and it also carries the agent's reasoning. Action policies route it like any other alert. Here is the one discovery wrote, abridged, as it is stored in .rule-events:
{
  "severity": "high",
  "alert": { "status": "active" },
  "data": {
    "title": "Card charging — payment gRPC connection refused",
    "symptom_hypothesis": "The payment service refuses the frontend's gRPC charge call on port 9999, preventing card charges from completing.",
    "summary": "Frontend card-charge calls to the payment gRPC endpoint fail with code Unavailable and connection refused on port 9999. The failure is present now; 1,156 matching failure log lines were observed in the last hour, all from frontend. Attempt-level failure share and broader service or regional reach are not measured.",
    "confidence": 0.65,
    "signals": [
      {
        "type": "detection",
        "description": "The frontend card-charge gRPC call logs code Unavailable with connection refused on port 9999 at the payment target. 1,156 matching failure log lines were observed in the last hour, from 1 affected service; total log lines and attempt-level failure share were not measured, and the latest sample still shows the failure.",
        "metadata": { "rule_name": "Payment gRPC Connection Failure (frontend → payment)", "change_point_type": "spike" },
        "evidence": { "result": "found", "esql_query": "FROM $.nightshift.sources.default.logs | WHERE @timestamp >= ?_tstart AND @timestamp < ?_tend | WHERE MATCH_PHRASE(body.text, \"failed to charge card\")" }
      },
      {
        "type": "detection",
        "metadata": { "rule_name": "Payment Service gRPC Unavailable (connection refused or i/o timeout)", "change_point_type": "spike" },
        "evidence": { "result": "found", "esql_query": "FROM $.nightshift.sources.default.logs | WHERE @timestamp >= ?_tstart AND @timestamp < ?_tend | WHERE MATCH_PHRASE(body.text, \"rpc error: code = Unavailable\") AND (MATCH_PHRASE(body.text, \"connection refused\") OR MATCH_PHRASE(body.text, \"i/o timeout\"))" }
      }
    ],
    "causal_features": [
      { "feature_id": "payment", "type": "entity" },
      { "feature_id": "frontend", "type": "entity" }
    ],
    "blast_radius": [
      { "type": "dependency", "feature_id": "frontend-payment-grpc", "source": "frontend", "target": "payment", "protocol": "grpc" }
    ]
  }
}
The stored queries read FROM $.nightshift.sources.default.logs, the source's view, where the walkthrough above wrote the stream name logs.otel. causal_features and blast_radius are the impacted entities in the topology: the entities that fail, and the services, dependencies and infrastructure their failure reaches. Each signal carries the measurements from grounding and the query that produced them, so every number in the alert can be re-run. The hypothesis names a specific mechanism, such as "the payment service refuses the frontend's gRPC charge call on port 9999", and the agent may name an impacted entity only when a confirmed signal or the topology contains it.
The whole path, from a moving count to a stored alert, splits like this:
Step | Done by | Decides |
|---|---|---|
Change point detection | Code | Which rules changed significantly |
Selection | Code | Which rules the agent investigates, and in what order |
Grounding and impact | Agent | Whether each failure is real, ongoing, how big, and what it reaches |
Joining | Agent | Which signals are one incident, and whether they continue an open event |
Severity | Agent | How bad the incident is, and how confident the evidence is |
Lifecycle | Code | Whether the event is active, recovering or inactive |
Alert creation | Code | What is stored, after checking the agent's proposal |
How the discovery agent was evaluated
The discovery evaluation suite replays snapshots of failure scenarios, feeds the agent the detections each one produces and scores what it writes. Code evaluators check the grouping, the impacted entities, the severity and the status against the expected incident. They also check that the agent called the tools its procedure requires: the confirmation query, the KI lookup and the search for an existing alert. A continuation suite feeds the same incident over several cycles and checks that the agent keeps updating one alert, with stable severity and topology. LLM judges score the narrative and whether confidence and severity are calibrated to the evidence.
Evaluation results: Significant Events discovery across seven failure scenarios
The table below shows one run of the evaluation suite, scored from 0 to 1 per evaluator. With a single run and n = 7 (2 or 3 for the topology rows) there is no variance estimate, so read the 1.00 scores as a smoke test, not a benchmark.
Score | |
|---|---|
Incidents grouped correctly | 1.00 |
Impacted entities correct (topology) | 0.97 |
Severity matched | 1.00 |
Status matched | 1.00 |
Required tools called | 1.00 |
Same alert kept across cycles | 1.00 |
Topology stable across cycles | 1.00 |
Judge: confidence and severity calibrated | 1.00 |
Latency per run, mean | 29.4 s |
Tool calls per run, mean | 18.4 |
Methodology. Seven failure scenarios from Bank of Anthos, a sample application separate from the OpenTelemetry demo used in the rest of the series. One run, discovery on GPT-5.6 Luna, judged by Gemini 3.1 Flash-Lite. Scores are means across examples; topology stability is averaged over 3 continuation examples and topology correctness over 2. The run used the discovery prompt shortly before it merged, and the benchmark model is not necessarily the one the product uses: the production pipeline uses models served through the Elastic Inference Service, which may differ. The scores show how this design performs, not how the shipped configuration performs.
The tools row shows the mechanism. A run scores 1 there only if the agent re-ran the rule's query, looked up the KIs behind it and searched for an existing alert, so the agent ran every check its procedure requires. Topology is the one score below 1: in one of its two examples the agent's impacted entities differed slightly from the expected set.
Conclusions: What three posts of grounding add up to
Part 1 decided what the system knows about this source. Part 2 turned that knowledge into queries that stay linked to it, so they retire when it changes. This post followed two of those queries, now rules, through the outage: change point detection noticed that both had jumped, and the discovery agent re-ran each query, measured the impact, and joined them into one alert.
The series started with a model looking at raw logs and writing log.level: error, a rule that found nothing during the outage. Three posts later, the same outage produces one alert, which names payment as the unreachable entity, the caller it reaches and the queries that show it. Each claim traces back to a KI extracted in Part 1 or a query validated in Part 2.
How helpful was this content?
Related Content
Your logs already wrote the alert: Generating ES|QL detection queries in Elasticsearch
AI agent observability in Elastic for Claude Platform with OpenTelemetry
How Elastic Significant Events turns 100 log samples into detection rules
Meet Elastic nightshift AI SRE, your always-on SRE coworker