Three model calls, 92% of the wait: AI agent observability with OpenTelemetry
A cheaper model cut spend by 76% to 83% per question and got slower on four of five, which the OpenTelemetry GenAI traces from this LangChain agent explain step by step.
Build and observe AI agents where your data already lives. Begin with Elastic Agent Builder. You can also start a free cloud trial or try Elastic on your local machine today.
Three model calls took 92% of a 10-second request in our LangChain shopping assistant. The trace showed which one was most at fault, so we swapped the comparison model for a cheaper one. As a result, model spend dropped by 76%–83% per question. Response time got worse on four of the five questions; this wasn’t what we expected, and it’s why we measure cost and latency.
A single request duration won’t tell you which step made the customer wait or which one ran up the model bill, but AI agent observability is how you find out. A shopping assistant can give a correct answer but could still take too long and cost more than the question requires. Agent runs are nondeterministic, and each step can call a paid model, so you need to know which model answered and how many tokens it used.
In this blog post, we instrument a LangChain shopping assistant with the OpenTelemetry (OTel) generative AI (GenAI) conventions and send its traces to Elastic. From there, we find the slowest model call in the waterfall and attach the provider-reported charge to each request. Then, we test a cheaper model on the step that the trace points to. For background, read more about debugging large language model (LLM) applications with Elasticsearch Query Language (ES|QL) and OTel tracing for Elastic Agent Builder. We take that one change all the way through, including where it didn’t help.
Prerequisites
To follow along, you need:
An Elastic Cloud Hosted (ECH) deployment on 9.5 or later with the Managed OpenTelemetry Protocol (mOTLP) endpoint URL.
An Elasticsearch API key that can create and query one index, used to store the sample catalog in a
semantic_textfield with the deployment's default inference endpoint.An OpenRouter API key. The assistant calls GPT-5.6 Luna and GPT-5.6 Sol through OpenRouter, and the experiment costs a few cents.
Agent Builder, for the last section. On 9.4 and later, it’s the default in every solution view and includes preconfigured models on ECH, so you don't need an AI connector. In the Classic view, switch to Agent Builder first.
You can find the companion notebook here. It reproduces the whole lab from this article, from loading the sample store to comparing the two models, and cleans up at the end.
The application: A LangChain shopping assistant
Our app helps customers buy a coffee maker. They can ask about the store's policies, such as How long do I have to return it?, or compare products, as in Which coffee makers fit my budget and counter space? The sample store has six coffee makers, plus returns and shipping policies. In the example below, a customer asks for a coffee maker under $100, no wider than 20 cm, that brews at least four cups:
The LangChain agent chooses between two tools:
answer_store_questionlooks up returns and shipping policies and then uses a lower-priced model to answer.compare_productsretrieves six coffee makers and uses a higher-priced model to compare their price, width, capacity, and features against the customer's requirements.
In this starting version, GPT-5.6 Luna selects the tool and returns its answer to the customer. The policy tool also uses Luna; the product comparison tool uses GPT-5.6 Sol. Each completed request therefore makes three model calls:
Choose a tool. The agent reads the question and picks answer_store_question or
compare_products.Answer using the retrieved records. The selected tool calls its model with the store records from Elasticsearch.
Return the answer. The agent relays the tool’s output to the customer.
Elasticsearch supplies the store records. The selected tool calls a model with those records, and then the agent returns the result
The agent reads the question, picks one of two tools, and returns that tool's answer; it doesn’t search. Each tool is a small retrieval augmented generation (RAG) step. It retrieves store records from Elasticsearch and asks a model to answer using only those records. The model decides which retrieval to run, and the code decides how.
The agent definition is small:
def build_agent(comparison_model=LARGE_MODEL):
    @tool
def answer_store_question(question: str) -> str:
"""Answer questions about returns or shipping policies."""
return answer(question, "policy", size=2, model_name=SMALL_MODEL)

    @tool
def compare_products(question: str) -> str:
"""Compare coffee makers with the customer's requirements."""
return answer(question, "product", size=6, model_name=comparison_model)

return create_agent(
        model=model(SMALL_MODEL),
        tools=[answer_store_question, compare_products],
        name="shop_assistant",
        system_prompt=SHOP_INSTRUCTIONS,
    )
Both tools call the same answer helper, which runs a semantic query on the catalog's semantic_text field, filtered to policies or products, and passes the matching records to the model with the customer's question. With six products, size=6 returns the whole catalog, so retrieval stays identical in both variants of the experiment. The full source and sample catalog are in the companion notebook. For more on this retrieval pattern, read How to build an agent knowledge base with LangChain and Elasticsearch.
AI agent observability with the OTel GenAI conventions
A single request duration hides the model calls and retrieval inside it. Classic application performance monitoring (APM) instrumentation sees an outgoing HTTPS call to the model provider, but not which model answered or how many tokens it used, nor does it see which tool asked for it. The OTel GenAI LangChain instrumentor records the agent, its tools, and its model calls as connected spans. Each span describes one operation and its timing; chat spans also carry the model and token counts.
Elastic doesn’t ship its own LangChain instrumentation. Elastic Distribution of OpenTelemetry (EDOT) Python, Elastic's distribution of the OTel Python SDK, instruments OpenAI client, Amazon Bedrock, and Google Vertex AI calls directly, but not LangChain. The instrumentor used here comes from the OTel project, and Elastic receives its spans like any other OTLP source. Earlier Observability Labs posts traced LangChain with third-party libraries, such as OpenLLMetry, OpenLIT, and Langtrace. They work, too, but field names can differ between libraries, and the queries in this post assume the upstream instrumentor.
The GenAI semantic conventions name those spans by operation. This trace uses three of them:
Span name |
| What it records |
|---|---|---|
|
| The whole agent run, with |
|
| One tool call, with |
|
| One model call, with |
Telemetry travels through OTLP into a trace data stream, and every view in this post reads the same spans:
To run the application yourself:
Follow the Managed OTLP Python walkthrough to obtain your endpoint and credentials.
Install the pinned packages.
Load the eight sample store records (six coffee makers and two policies).
Export the three environment variables below.
Steps 2 and 3 are in the companion notebook.
The sample was tested with Python 3.12, LangChain 1.4.0, OTel SDK 1.44.0, and opentelemetry-instrumentation-genai-langchain 1.1b1. The screenshots and results below come from an ECH 9.6 deployment:
export OTEL_EXPORTER_OTLP_ENDPOINT="https://YOUR_MANAGED_OTLP_ENDPOINT:443"
export OTEL_EXPORTER_OTLP_HEADERS="Authorization=ApiKey%20YOUR_INGEST_API_KEY"
export OTEL_INSTRUMENTATION_GENAI_CAPTURE_MESSAGE_CONTENT="NO_CONTENT"
The first two settings send traces to Elastic. The third keeps prompt and response capture off, but token counts and timings are still recorded. Enable the instrumentor before creating the LangChain agent:
provider = TracerProvider(resource=Resource.create({
"service.name": "shop-assistant",
}))
provider.add_span_processor(BatchSpanProcessor(OTLPSpanExporter()))
trace.set_tracer_provider(provider)
LangChainInstrumentor().instrument()
Zero-code instrumentation with EDOT Python
For zero-code instrumentation, install EDOT Python (elastic-opentelemetry) and opentelemetry-instrumentation-genai-langchain, and then start the app with opentelemetry-instrument. edot-bootstrap doesn’t install the LangChain package yet, and OpenLLMetry's opentelemetry-instrumentation-langchain registers the same langchain name, so don't install both.
The application adds a root shop.request span around each customer request and a retrieve products span around the Elasticsearch search. It also passes config={"metadata": {"agent_name": "shop_assistant"}} to agent.invoke: the instrumentor (1.1b1) records a top-level LangGraph run, which is what create_agent returns as invoke_workflow unless the run's metadata names the agent.
Find the slowest model call in the trace waterfall
In Kibana, open Observability > Applications > Service inventory, select shop-assistant and then the shop.request transaction, and pick a trace for the product question. The waterfall shows the routing call, the selected tool, its retrieval and model call, and the final response call:
This request takes 10.10 seconds. The compare_products tool takes 4.93 seconds, and expanding it shows why: the Sol comparison call takes 4.20 seconds, versus 690 ms retrieving the products. The initial routing call takes another 1.91 seconds, and the final response call takes 3.15 seconds. The three model calls account for about 92% of this request's duration, giving us a useful place to focus.
A tool span includes the work of its children, so adding both durations would count that work twice. Use the root span for the customer's elapsed time, and expand the children to find the expensive steps.
Select the Sol chat span, and open its GenAI tab to see the model and token usage. The Sol call read 680 input tokens and wrote 268 output tokens. The model identity and token counts stay visible with message capture disabled. The GenAI tab and the waterfall token badges are a technical preview in Elastic Stack 9.6 and on Elastic Cloud Serverless. On 9.5, open the span's Metadata tab and filter on gen_ai instead:
Compare every model call with ES|QL
The same gen_ai.* fields are available to ES|QL, so you can compare every model call of the service, not just one trace. In Discover, switch to ES|QL, and select the time range of your run. Then, group the chat spans by the model that answered:
FROM traces-generic.otel-default
| WHERE resource.attributes.service.name == "shop-assistant"
    AND attributes.gen_ai.operation.name == "chat"
| STATS calls = COUNT(*), avg_ms = ROUND(AVG(duration) / 1e6),
        input_tokens = SUM(attributes.gen_ai.usage.input_tokens),
        output_tokens = SUM(attributes.gen_ai.usage.output_tokens)
    BY model = attributes.gen_ai.response.model
| SORT avg_ms DESC
| KEEP model, calls, avg_ms, input_tokens, output_tokens
| LIMIT 10
Track LLM cost per request on the trace
Token counts and a billed charge are different fields, and they come from separate places:
Number | Where it comes from | Where it lands in the trace |
|---|---|---|
Model and tokens per call | The LangChain instrumentor |
|
Billed cost per call | OpenRouter's usage response, which ChatOpenRouter copies into | Nowhere, until the application records it |
Cost per request | The application, summing its three calls |
|
The application collects the per-call charges with a LangChain callback and records their sum on the root span. app.model_cost.usd covers model usage only, including the provider's cache pricing; Elasticsearch, retrieval inference, and infrastructure are billed separately. If you estimate cost from tokens instead, price cached tokens on their own. gen_ai.usage.input_tokens already includes gen_ai.usage.cache_read.input_tokens and gen_ai.usage.cache_write.input_tokens. On reasoning models, such as GPT-5.6, also check that gen_ai.usage.output_tokens includes the reasoning tokens (gen_ai.usage.reasoning.output_tokens), since they’re billed as output. In our run, no call used the cache or reported reasoning tokens, so tokens multiplied by the provider's rates match the billed charge.
Does a cheaper model make the agent faster?
The trace points at a specific place to experiment: the model inside compare_products. That model reads a small catalog and checks price, width, and capacity constraints. Try Luna in place of Sol, while keeping the question, instructions, product records, and output format the same. The rest of the agent stays in place. For more examples of assigning work to different models, read Your FAQ bot doesn't need a PhD and Let the big model think, let the small model work.
Both versions answer the same five product questions, three times each. Each answer must pass a check, so a cheaper answer that recommends the wrong products doesn’t count as a saving:
Case | Customer asks for | The answer passes when it |
|---|---|---|
| Under $100, at most 20 cm wide, at least four cups | Names Compact Brew, Morning Mini, and Counter Fit |
| A programmable timer and the cheapest one | Names Morning Mini, Family Brew, and Slim Pro |
| At least 10 cups at once | Names Family Brew |
| Under $60 and at least six cups | Says no product meets all requirements |
| The quietest model, in decibels | Says the catalog doesn’t include noise data, without inventing a number |
The application labels each shop.request root span with app.runset (the experiment name), app.case, app.variant (baseline compares with Sol, candidate with Luna), and app.check_passed, next to app.model_cost.usd. In Discover, switch to ES|QL, select a time range covering the experiment, and average those spans by question and variant. The LIKE pattern matches every run of the experiment:
FROM traces-generic.otel-default
| WHERE resource.attributes.service.name == "shop-assistant"
    AND name == "shop.request"
    AND attributes.app.runset LIKE "shopping-model-swap*"
| STATS requests = COUNT(*), seconds = ROUND(AVG(duration) / 1e9, 2),
        usd_per_1k = ROUND(AVG(attributes.app.model_cost.usd) * 1000, 3),
        checks = COUNT(*) WHERE attributes.app.check_passed == true
    BY question = attributes.app.case, variant = attributes.app.variant
| SORT question, variant
| KEEP question, variant, requests, checks, seconds, usd_per_1k
| LIMIT 10
usd_per_1k is the mean cost per 1,000 requests, which is easier to compare than fractions of a cent. Each row covers three requests:
For the budget-and-counter-space question (compact), model spend fell from $4.465 to $0.889 per 1,000 equivalent requests, about 80% less. Both versions recommended the same three eligible products and passed all three repeats. Mean response time changed from 8.89 to 8.54 seconds, a much smaller difference.
The waterfall trace above is one of these compact baseline requests. Its Sol call cost $0.00404 of the request's $0.00454, at the rates billed during our run ($2 and $10 per million input and output tokens; OpenRouter has since raised Sol's listed price). The candidate's three Luna calls cost about $0.0009, so each request saves about $0.0036.
Check the customer's answer alongside the trace and cost figures. The candidate answer lists the same three products and specifications:
The other four questions also cost less, but their mean response times increased in this sample. A lower model price gives us a cost saving to evaluate, but latency still needs its own measurement. These 30 requests cost $0.05347 in provider-reported model usage. This is a small, sequential test with three repeats per question and model, temperature zero, and retries disabled. Review the answer text, as well as the automated checks, and expand the evaluation before changing a production model.
What LLM tracing captures and what it leaves out
Model names, tokens, timings, and outcome fields are enough for this comparison, so the application sets OTEL_INSTRUMENTATION_GENAI_CAPTURE_MESSAGE_CONTENT=NO_CONTENTbefore initializing the instrumentor. NO_CONTENT is also the default. Setting it explicitly makes the choice visible in the configuration and keeps prompts and responses out of the trace store.
Full prompt and response text doesn’t belong in span attributes by default. Span attributes are indexed with every trace, so raw content can increase storage, exceed attribute-size limits, and expose personal information and secrets to anyone who can read traces.. The variable accepts four values (case-insensitive):
Value | Where message content goes |
|---|---|
| Nowhere; spans keep the model, tokens, and timing |
| Span attributes on the chat span ( |
| Separate OTel log events, as described by the GenAI event conventions |
| Both |
If you need conversation content, prefer EVENT_ONLY. Events travel as log records next to the trace, so you can redact them before they’re stored and give them their own access rules and retention without widening access to every trace. The tradeoff is that the conversation view of the GenAI tab reads the span attributes, so it stays empty with EVENT_ONLY. Whichever mode you choose, decide what to redact and how long to keep it before enabling capture.
Ask the Elastic AI Agent what to optimize next
The Elastic AI Agent, the default agent in Agent Builder, can query the same traces with its built-in platform.core.execute_esql tool. Give it the service and trace data stream, along with the experiment name, and then ask a focused question. For model calls, it can query attributes.gen_ai.response.model and attributes.gen_ai.usage.output_tokens alongside each span's duration. Open the tool's query and results to check the evidence behind its answer.
Which step dominates an agent request?
Service shop-assistant, trace data stream traces-generic.otel-default. Trace <trace_id>. Inspect this shop-assistant trace. Break down model time and retrieval time without adding parent and child durations twice. Which call is worth investigating first?
The AI agent locates the Sol call inside the product tool and separates model time from retrieval. It attributes 9.26 of the request's 10.10 seconds to model calls. The 690-ms retrieval accounts for a much smaller share, so tuning search would have limited impact on this particular request.
Does the agent need its last model call?
In every trace, the agent calls the model once more after compare_products returns. The tool's answer is already complete at that point, so this last call only relays it to the customer. Ask the AI agent what that relay costs:
Service shop-assistant, trace data stream traces-generic.otel-default. Trace <candidate_trace_id>. In this candidate trace, compare_products returns the final answer and then the agent calls the model one more time. How long does that last call take, how many output tokens does it write, and what share of the request is it? Suggest one change to test.
In this candidate trace, the Luna call inside compare_products takes 3.77 seconds and writes 250 output tokens. The last call takes another 2.33 seconds and writes 184 output tokens: 25.5% of the 9.14-second request was spent repeating an answer that the tool already wrote. The AI agent suggests returning the tool's answer directly. In LangChain, that’s one argument on the tool: @tool(return_direct=True) ends the agent run with the tool's output and skips the last model call. Treat it as the next experiment: run the same five questions, and check that the answers still pass. Then, measure the time saved with the same ES|QL query.
Does the cost saving hold across questions?
Service shop-assistant, trace data stream traces-generic.otel-default. Experiment <runset> (root spans named shop.request; attributes app.case, app.variant, app.check_passed, app.model_cost.usd). Compare baseline and candidate by product question. Which questions save money without a clear latency improvement? Include request counts and failed checks.
The AI agent queries shop.request spans and checks that all 30 requests are present. The candidate costs less on all five questions, while four of them have a higher mean response time in this small sample. The result helps choose which questions to test more extensively instead of assuming that the cheaper model makes every answer faster.
Turning traces into decisions
The OTel GenAI conventions turn a LangChain agent run into a trace that you can read step by step: invoke_agent, execute_tool, and chat spans that record each call's model and tokens. In Elastic, the waterfall showed that three model calls took about 92% of a 10-second request. With the provider-reported charge on the root span, an ES|QL query showed that a lower-priced comparison model cut model spend by 76%–83% per question, without a consistent latency improvement.
Use those findings to choose the next experiment, and then measure it with the same query and answer checks. For this assistant, the useful decision is whether a change gives the customer a correct recommendation with less waiting and lower model spend.
Next steps
The same traces support the next round of work:
Test the change that the AI agent suggested. Add
return_direct=Truetocompare_products, and run the five questions again. Then, compare latency, cost, and checks with the same ES|QL query.Alert on cost and latency. Turn the experiment query into an Elasticsearch query rule on
shop.requestspans, so a model or prompt change that raisesapp.model_cost.usdor the mean duration opens an alert.Widen the evaluation. Add more questions and repeats before you change a production model. Record each result as an attribute on the root span so ES|QL can compare them.
Capture content only where you need it. If you must review conversations, try
EVENT_ONLYwith redaction and a separate retention policy for those log events.
Instrument other frameworks. The opentelemetry-python-genai repository also ships instrumentations for LlamaIndex, the OpenAI Agents SDK, and several model providers. The spans follow the same GenAI conventions, so the queries in this article still apply.
How helpful was this content?
Related Content
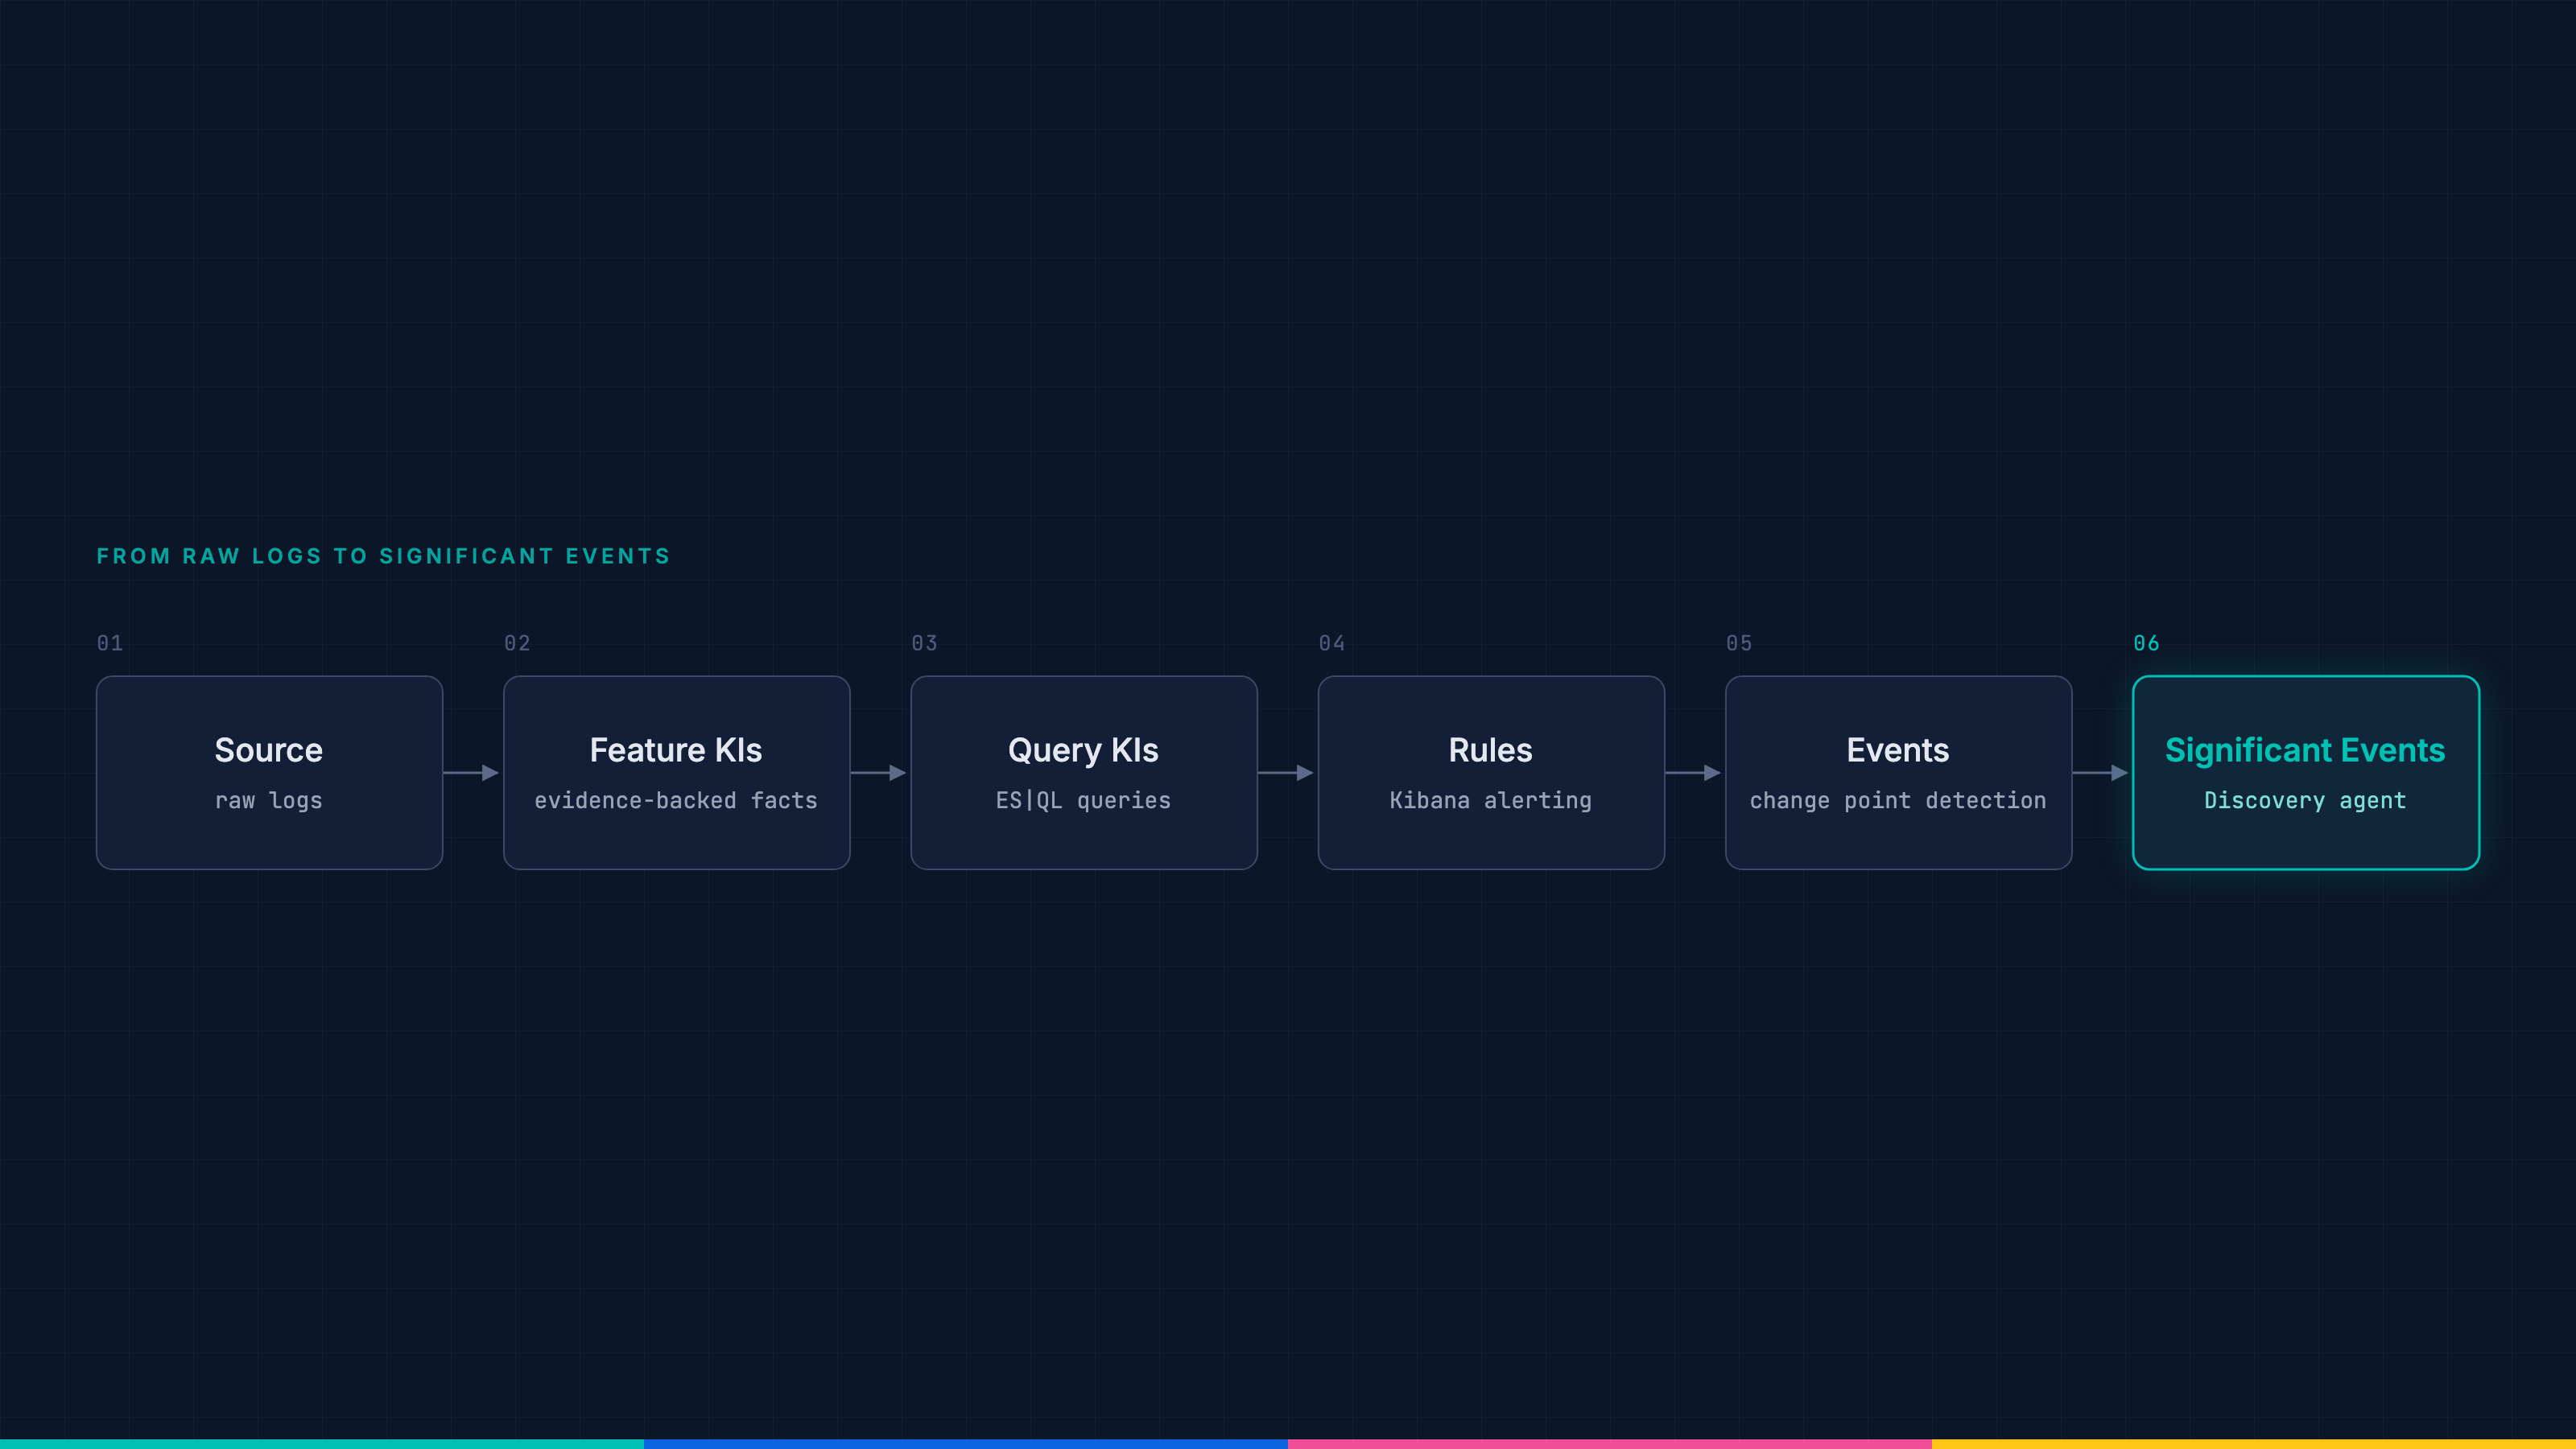
Two rules, one outage, one alert: How change point detection cuts alert noise
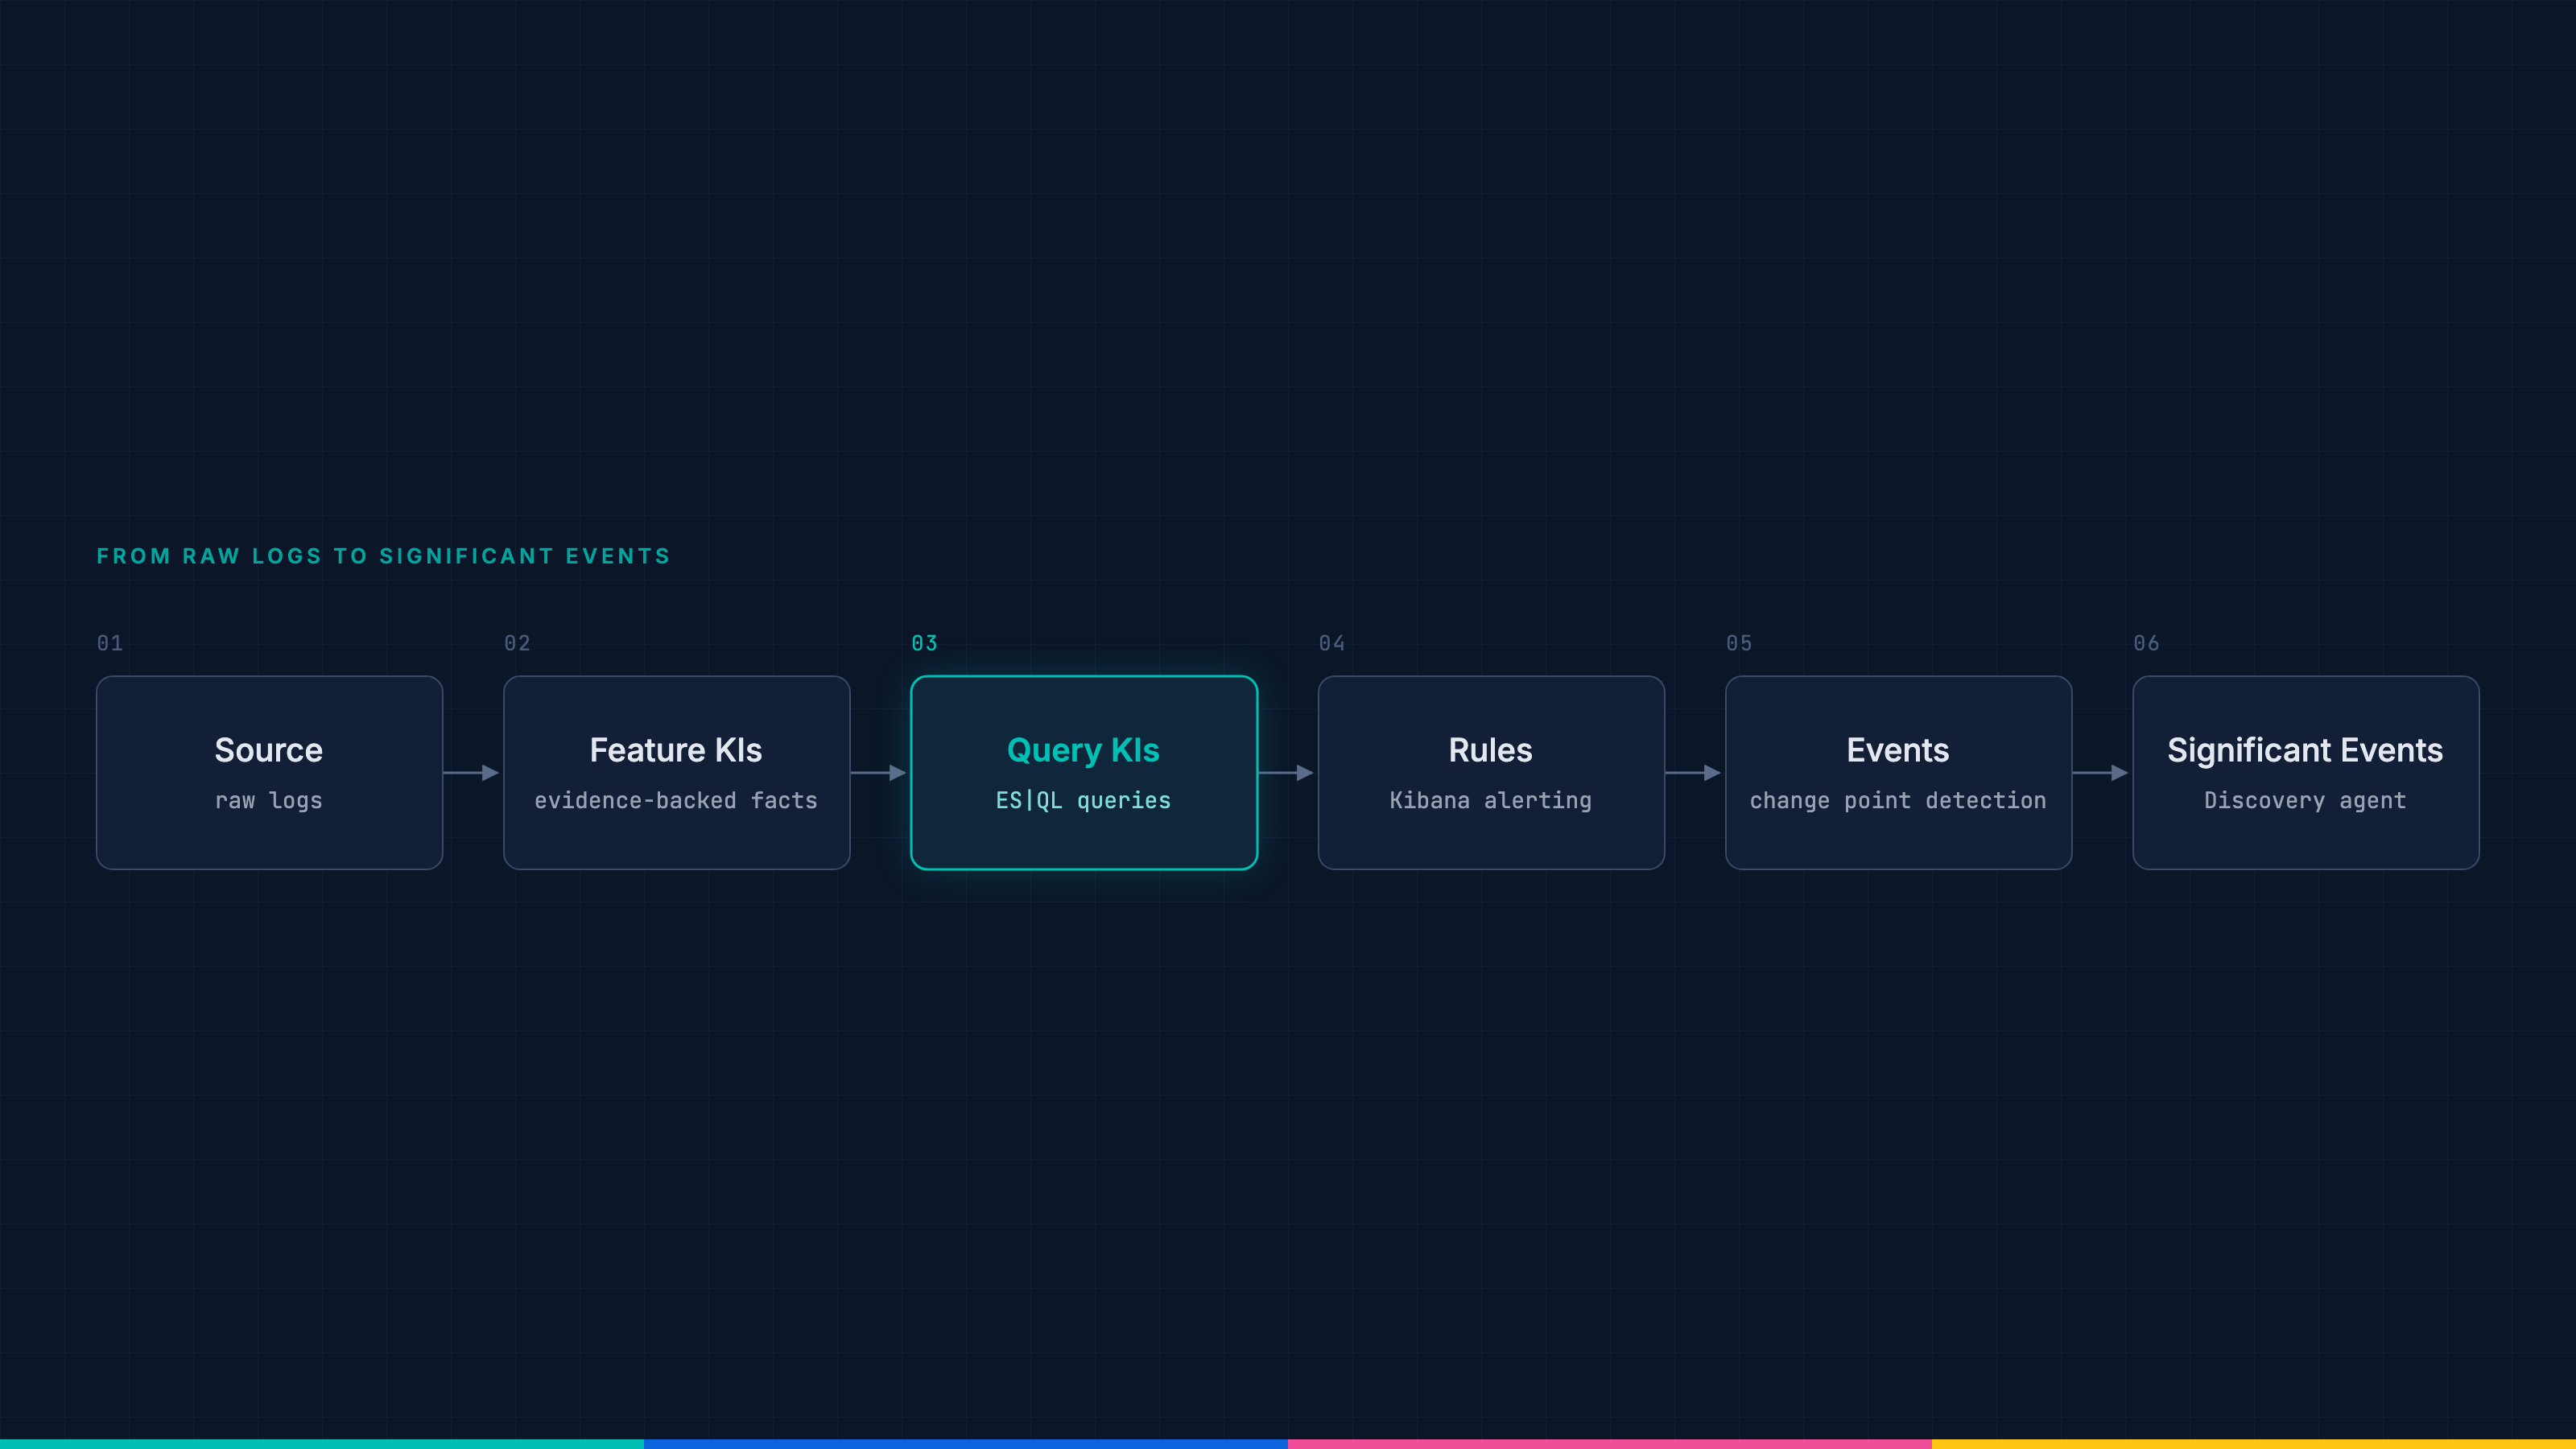
Your logs already wrote the alert: Generating ES|QL detection queries in Elasticsearch
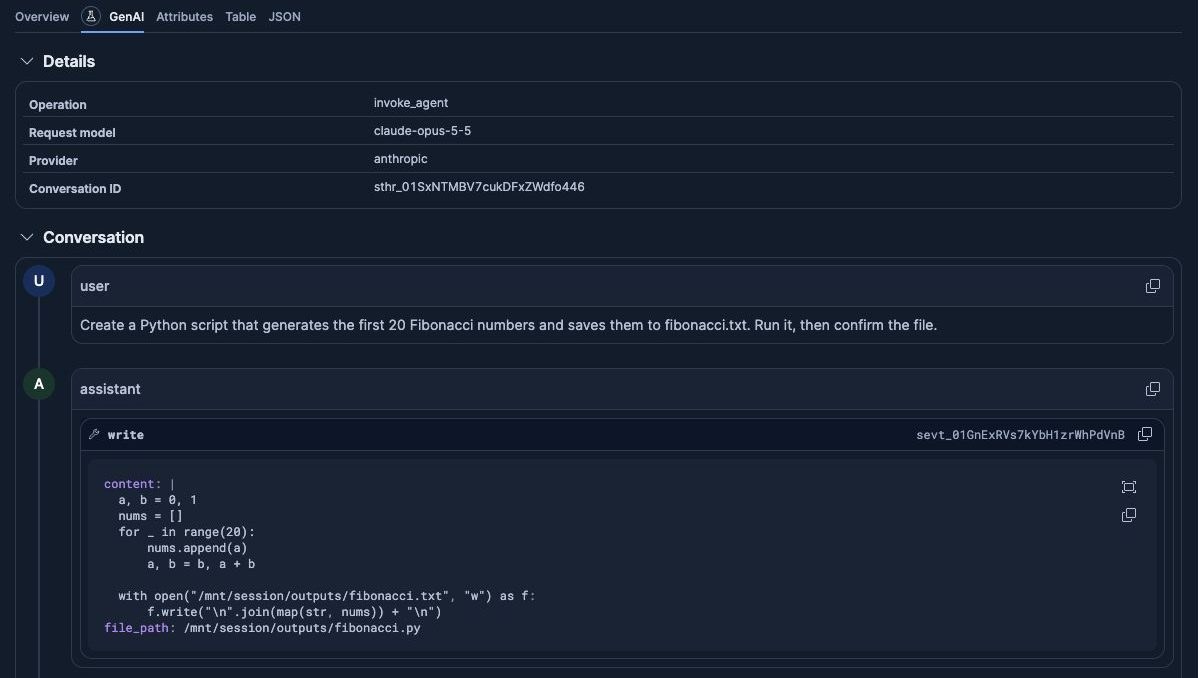
AI agent observability in Elastic for Claude Platform with OpenTelemetry
How Elastic Significant Events turns 100 log samples into detection rules