
Three regions, three Kibanas, one view: Cross-cluster search comes to Elastic Synthetics
Monitors from every connected cluster appear in one Kibana, with journey waterfalls, screenshots, errors and certificates. Nothing is replicated, and each cluster still owns its monitors.

One ES|QL query, 365 days of audit logs: Same search on hot data and searchable snapshots
Collect audit logs with the EDOT Collector, then confirm the 365-day retention policy actually applied before an auditor asks you to.
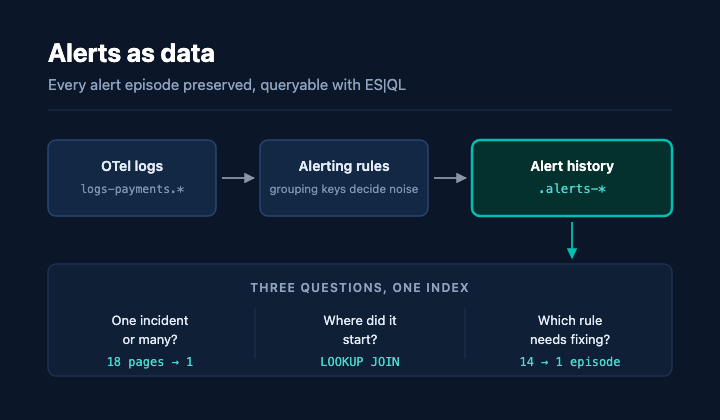
14 alerts, 1 incident: Measuring alerting rule noise with ES|QL in Elasticsearch
Grouping keys decide how many alerts one incident produces, and because Kibana stamps every alert document with a rule revision, you can measure your alert noise reduction against the same incident that caused the alerts in the first place.

Cross-project search for Elastic Observability: one query across every linked project
Keep your observability data where it lives, and still search, alert, and monitor across every linked Serverless project, easily!

Migrate Datadog Kubernetes dashboards to Elastic Observability in under an hour
See how the migration CLI translates a real Datadog Kubernetes dashboard into validated Kibana panels and uploads it to your cluster in under an hour, no manual widget rebuilds required.

How Prometheus Remote Write Ingestion Works in Elasticsearch
A look under the hood at Elasticsearch's Prometheus Remote Write implementation: protobuf parsing, metric type inference, TSDS mapping, and data stream routing.
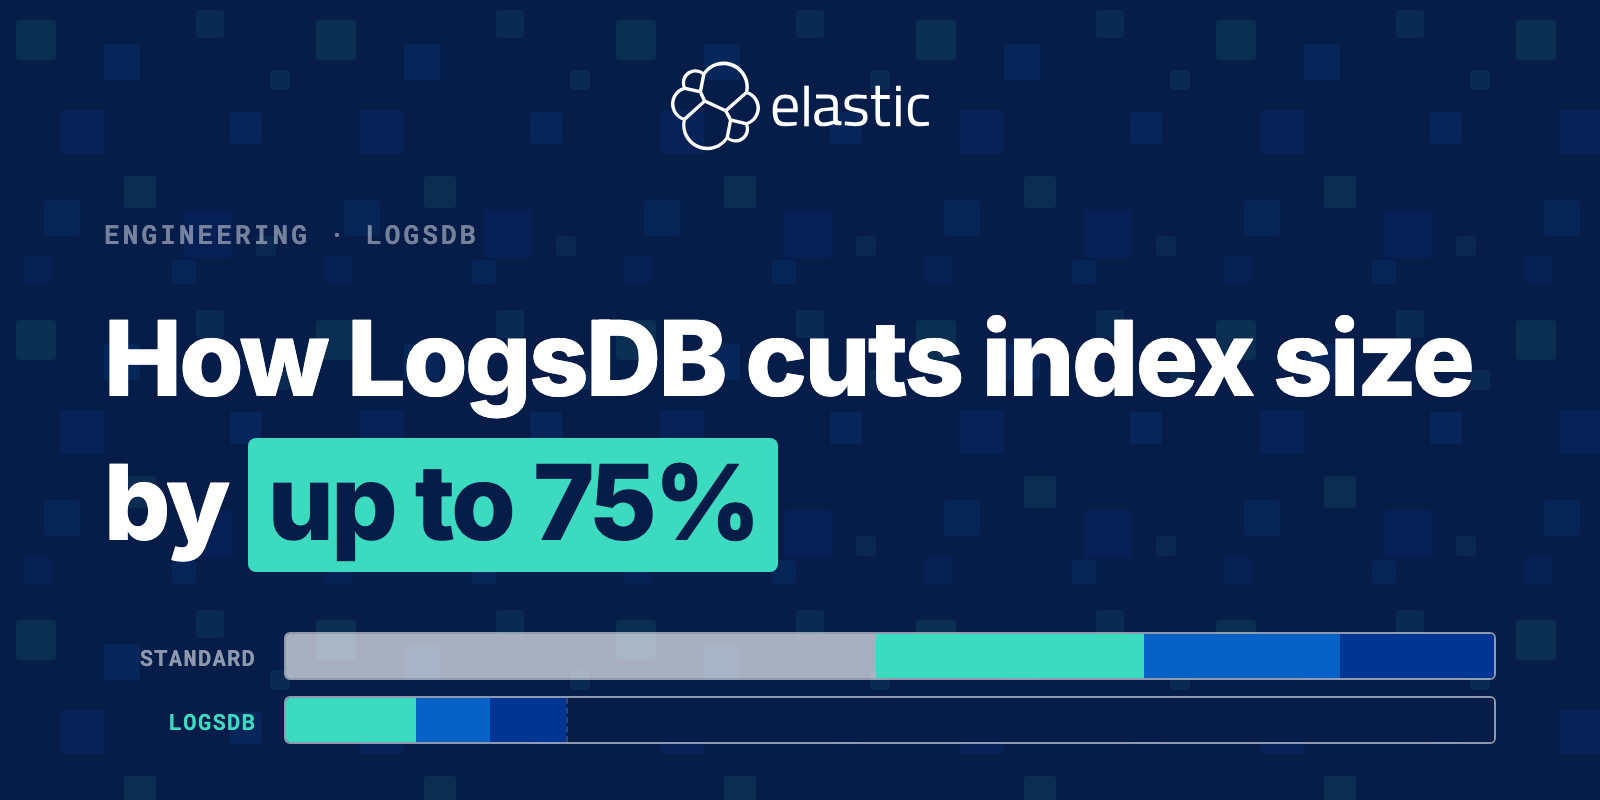
Elasticsearch over the years — how LogsDB cuts index size by up to 75% at no throughput cost
By default, Elasticsearch is optimized for retrieval, not storage. LogsDB changes that. Here's the layered architecture behind a 77% index size reduction.

How to cut Elasticsearch log storage costs with LogsDB
Learn how to enable LogsDB index mode in Elasticsearch and measure real storage savings. We compare a standard index against a LogsDB index using Apache logs and show how much storage you can reclaim.

Monitor dbt pipelines with Elastic Observability
Learn how to set up a dbt monitoring system with Elastic that proactively alerts on data processing cost spikes, anomalies in rows per table, and data quality test failures

Elastic Universal Profiling: Delivering performance improvements and reduced costs
In this blog, we’ll cover how a discovery by one of our engineers led to cost savings of thousands of dollars in our QA environment and magnitudes more once we deployed this change to production.
.jpg)
Continuous profiling: The key to more efficient and cost-effective applications
In this post, we discuss why computational efficiency is important and how Elastic Universal Profiling enables your business to use continuous profiling in production environments to make the software that runs your business as efficient as possible.

Improving the Elastic APM UI performance with continuous rollups and service metrics
We made significant improvements to the UI performance in Elastic APM to make it scale with even the most demanding workloads, by pre-aggregating metrics at the service level, and storing the metrics at different levels of granularity.