14 alerts, 1 incident: Measuring alerting rule noise with ES|QL in Elasticsearch
Grouping keys decide how many alerts one incident produces, and because Kibana stamps every alert document with a rule revision, you can measure your alert noise reduction against the same incident that caused the alerts in the first place.
Catch problems before your users do. Begin with synthetic monitoring and the SLO docs. You can also start a free Elastic cloud trial today.
One bad deploy on a payments platform opened 18 alert episodes in seven minutes, all from one incident. A single miscalibrated rule produced 14 of those episodes across only 7 alert instances. The median episode stayed active for one minute, so most of them had recovered before anyone could open the page.
This is an alert noise reduction exercise done with queries. Kibana writes every alert into a hidden index and keeps it there after recovery, so we put three questions to that alert history with ES|QL. Was this one incident or many, where did it start, and which rule produced more noise than signal? Then we change the grouping key on the noisy rule and replay the same failure, and the same query comes back with one episode that lasts seven minutes.
Kibana stamps every alert document with a rule revision, so the before and after of that tuning change sit in one index. At the end, an Agent Builder agent answers the same questions over the same alert history.
Everything below was tested on Elasticsearch and Kibana 9.5.2 on Elastic Cloud, with OpenTelemetry Collector Contrib 0.157.0.
Prerequisites
- Elasticsearch and Kibana 9.5 or later, on Elastic Cloud or self-managed.
- Kibana privileges to create and edit Elasticsearch query rules and Observability custom threshold rules, plus read access to the
.alerts-*indices. - OpenTelemetry Collector Contrib 0.157.0 or later, and an Elasticsearch API key with ingest privileges for the OTLP endpoint.
- Agent Builder enabled, for the final section only. Everything before it is plain ES|QL and works without it.
Why alert history beats alert notifications
A notification answers one short-lived question: who should look at this right now?
Most of the questions that make alerting better arrive later, and they are questions about data:
- Did 18 alert episodes represent 18 problems, or one incident evaluated from 18 angles?
- Which service showed the first symptom, and did the failure follow the dependency chain?
- Which rules produce short, repetitive episodes that nobody can act on?
- Did last month's threshold change actually reduce noise?
Inside Elastic, this framing has a name: alerts as data.
The idea is that every alert and every state transition is a fact in time, stored with explicit semantics, so correlation becomes a query across streams rather than a bespoke feature.
It also matches what shows up in real operations channels: a single infrastructure failure can open dozens of alerts within seconds, and flapping alerts with miscalibrated thresholds are a familiar source of page fatigue.
Both problems are hard to solve from notifications and straightforward to study from preserved alert history.
What Kibana alerting stores in every alert document
Kibana alerting rules write alerts-as-data documents into hidden indices that you can query like any other index.
The two aliases used in this article are .alerts-stack.alerts-default for Elasticsearch query rules and .alerts-observability.threshold.alerts-default for the Observability custom threshold rule.
The unit of storage is what we will call an episode: one document that covers one alert instance from the moment it becomes active until it recovers.
The fields that matter for investigation:
| Field | What it tells you |
|---|---|
kibana.alert.instance.id | The grouping-key value this episode belongs to |
kibana.alert.start, kibana.alert.end | When the episode opened and recovered |
kibana.alert.duration.us | How long it stayed active |
kibana.alert.status | active or recovered |
kibana.alert.flapping, kibana.alert.flapping_history | Whether Kibana marked it as rapidly changing state |
kibana.alert.rule.name, kibana.alert.rule.revision | Which rule, and which version of it |
kibana.alert.grouping | The structured grouping values, for example service.name |
kibana.alert.reason | The human-readable condition at trigger time |
kibana.alert.url | A deep link back to the rule's data view |
Two properties make the rest of the article possible.
First, a new episode for the same instance creates a new document, so counting documents counts episodes.
Alert documents and notifications are decoupled: whether an episode also pages anyone depends on the actions attached to the rule and on their frequency, which can be every check, only on status changes, or a summary on a custom interval.
Our three rules have no actions attached, so nobody was paged during the lab; everything we count from here on is an alert document.
Second, grouping fields with ECS names such as service.name are copied to the top level of the alert document, which means alert history can join against other indices.
One caveat before you query: alert indices are wide.
The alerts index on this deployment maps roughly 1,400 fields, so every ES|QL query in this article projects a narrow set of columns with KEEP, and you should do the same, especially in tools that feed an LLM.
Because these are hidden system indices, the Discover editor cannot always introspect their fields, so it may flag the query with a warning or even an error badge while still running it and returning rows. Trust the result count in the toolbar, not the badge.
One more orientation note: Kibana screenshots below render timestamps in the browser's local time (UTC-5 in this lab), while the query result tables in the text use UTC.
The lab: how one bad deploy produces an alert storm
To generate an honest storm, we need services that fail in a chain, not a single threshold breach.
The scenario: fraud-scorer 2.3.0 ships with slow model loading, the payments queue backs up, payment-gateway requests start timing out, and customers see failed checkouts on payments-web.
Every service writes structured JSON logs, and an OpenTelemetry Collector tails them with a filelog receiver and ships them over OTLP/HTTP to the deployment's Elastic OpenTelemetry endpoint using an API key.
receivers:
  filelog/payment_gateway:
    include:
      - ${env:LAB_DIR}/events/payment-gateway.jsonl
    start_at: end
    resource:
      service.name: payment-gateway
      service.namespace: payments
      service.version: 5.1.2
      cloud.region: us-central1
    operators:
      - id: parse_json
        type: json_parser
        parse_from: body
      - id: parse_severity
        type: severity_parser
        parse_from: attributes.severity_text
      - id: use_message_as_body
        type: move
        from: attributes.message
        to: body

exporters:
  otlphttp/elasticsearch:
    endpoint: ${env:OTEL_EXPORTER_OTLP_ENDPOINT}
    headers:
      Authorization: ApiKey ${env:ES_API_KEY}
A transform processor routes everything into one data stream, logs-payments.stormlab-default, and the records land with service.name, log.level, custom string attributes under labels.*, and numeric attributes under numeric_labels.*.
The full collector configuration for all three services, and a notebook that reproduces the whole lab, are in the companion repository.
We also load one small index that will do a lot of work later: a service catalog.
PUT payments_service_catalog
{
  "settings": { "index.mode": "lookup" },
  "mappings": {
    "properties": {
      "service.name": { "type": "keyword" },
      "team":         { "type": "keyword" },
      "tier":         { "type": "keyword" },
      "depends_on":   { "type": "keyword" }
    }
  }
}
Three documents map each service to its owning team, tier, and upstream dependency: fraud-scorer depends on payments-queue, payment-gateway on fraud-scorer, and payments-web on payment-gateway.
POST payments_service_catalog/_bulk
{ "index": {} }
{ "service.name": "fraud-scorer",    "team": "risk-ml",       "tier": "backend",  "depends_on": "payments-queue" }
{ "index": {} }
{ "service.name": "payment-gateway", "team": "payments-core", "tier": "edge",     "depends_on": "fraud-scorer" }
{ "index": {} }
{ "service.name": "payments-web",    "team": "storefront",    "tier": "frontend", "depends_on": "payment-gateway" }
index.mode: lookup is what later allows LOOKUP JOIN from ES|QL.
How grouping keys decide how many alerts you get
The storm is observed by three alerting rules, and their grouping keys are the real subject of this article.
| Rule | Rule type | Grouping key | Window | Threshold |
|---|---|---|---|---|
gateway-5xx-per-endpoint-status | Elasticsearch query rule (ES|QL mode) | labels.endpoint, labels.status_code, cloud.region | 1 minute | 3 or more errors |
fraud-scorer-queue-lag | Elasticsearch query rule (ES|QL mode) | service.name, cloud.region | 1 minute | Max lag of 30 seconds or more |
payments-error-rate-per-service | Observability custom threshold rule | service.name | 2 minutes | More than 5 ERROR documents |
The first rule is deliberately miscalibrated in a way we have all shipped at some point: it groups gateway errors by endpoint and status code with a one-minute window and a low threshold.
FROM logs-payments.stormlab*
| WHERE service.name == "payment-gateway" AND log.level == "ERROR"
| STATS error_count = COUNT(*) BY labels.endpoint, labels.status_code, cloud.region
| WHERE error_count >= 3
It runs every minute as an Elasticsearch query rule in ES|QL mode, and each returned row becomes one alert instance, so /api/payments,503,us-central1 and /api/payments/confirm,504,us-central1 alert separately.
The second rule watches the first domino directly: consumer lag on the fraud queue, reported by the service in numeric_labels.queue_lag_seconds.
FROM logs-payments.stormlab*
| WHERE service.name == "fraud-scorer" AND numeric_labels.queue_lag_seconds IS NOT NULL
| STATS max_lag_seconds = MAX(numeric_labels.queue_lag_seconds) BY service.name, cloud.region
| WHERE max_lag_seconds >= 30
The third rule is an Observability custom threshold rule: more than five ERROR documents in two minutes, grouped by service.name.
It represents the sane default: one stable alert instance per affected service. It also demonstrates that different rule types feed the same investigation because all of them write alerts-as-data documents.
All three rules carry the tag alerts-as-data-v2, which is how every query below isolates them.
Tags on rules are not cosmetic: kibana.alert.rule.tags is stored on every alert document, so a tag is effectively a queryable dataset label for your alert history.
Replaying the incident: 18 alert episodes in seven minutes
We replay the incident: three minutes of healthy baseline, the 2.3.0 deploy, queue lag climbing past the threshold, six minutes of rotating gateway 5xx bursts, customer-visible errors, then a rollback and recovery.
The Alerts page during the storm looks like the pager felt.
Notice the table, not just the count.
The same instance IDs appear both as Active and as Recovered within minutes of each other, which is churn you can see but not yet measure.
When the dust settles, the preserved history can be queried in Discover's ES|QL mode.
The raw material of the storm, the error logs themselves, confirms the cascade shape:
FROM logs-payments.stormlab*
| WHERE labels.incident_id == "payments-brownout-20260722" AND log.level == "ERROR"
| STATS errors = COUNT(*) BY minute = DATE_TRUNC(1 minutes, @timestamp), service.name
| SORT minute
![Discover ES|QL view of error counts per minute and service: fraud-scorer errors first, then payment-gateway at seven per minute, then payments-web]]3
Now we leave the logs behind and interrogate only the alert history.
How to tell if an alert storm was one incident or many
FROM .alerts-*
| WHERE kibana.alert.rule.tags == "alerts-as-data-v2"
| STATS episodes = COUNT(*),
        alert_instances = COUNT_DISTINCT(kibana.alert.instance.id),
        first_episode = MIN(kibana.alert.start),
        last_episode = MAX(kibana.alert.start)
  BY rule = kibana.alert.rule.name
| SORT episodes DESC
| rule | episodes | alert_instances | first_episode | last_episode |
|---|---|---|---|---|
| gateway-5xx-per-endpoint-status | 14 | 7 | 16:36:38 | 16:42:38 |
| payments-error-rate-per-service | 3 | 3 | 16:36:41 | 16:37:41 |
| fraud-scorer-queue-lag | 1 | 1 | 16:35:35 | 16:35:35 |
Eighteen episodes, one incident, and every one of them opened inside a seven-minute window.
The gateway rule alone produced 14 of the 18 episodes while tracking only 7 distinct instances, which means half of its episodes were re-opens of something that had just recovered.
That single row is the quantified version of a complaint that usually stays anecdotal: this rule fires more than it helps.
How to find which service failed first with ES|QL
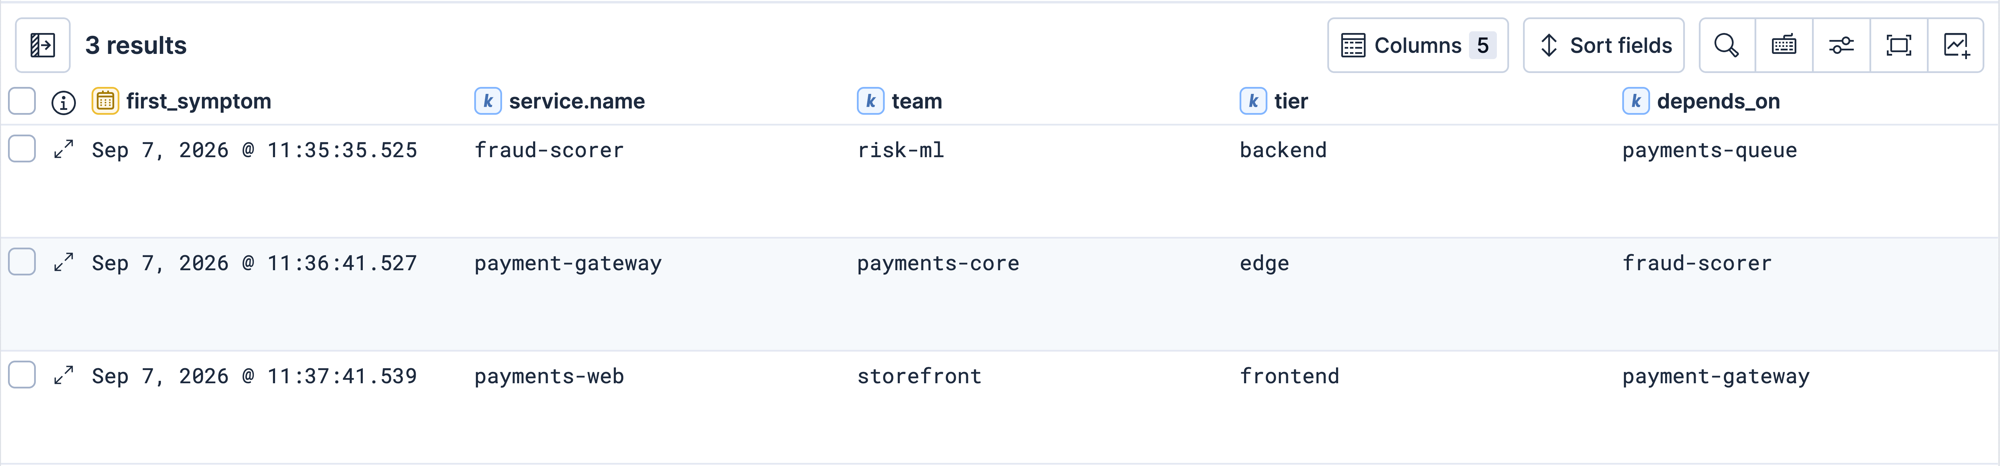
Because the grouping fields were ECS names, each episode carries service.name at the top level, and we can join the alert history against the service catalog.
FROM .alerts-*
| WHERE kibana.alert.rule.tags == "alerts-as-data-v2" AND service.name IS NOT NULL
| STATS first_symptom = MIN(kibana.alert.start) BY service.name
| LOOKUP JOIN payments_service_catalog ON service.name
| KEEP first_symptom, service.name, team, tier, depends_on
| SORT first_symptom
| first_symptom | service.name | team | tier | depends_on |
|---|---|---|---|---|
| 16:35:35 | fraud-scorer | risk-ml | backend | payments-queue |
| 16:36:41 | payment-gateway | payments-core | edge | fraud-scorer |
| 16:37:41 | payments-web | storefront | frontend | payment-gateway |
The alert order matches the dependency chain exactly: the first symptom belongs to team risk-ml, the edge degraded 66 seconds later, and customers noticed a minute after that.
There is a subtler deduction available in this table.
The earliest alerting service depends on payments-queue, which never alerted at all, so the most likely true origin sits one hop upstream of the first visible symptom, and that is where a post-incident review should start reading logs.
Also note which rule is absent from this analysis: the noisy gateway rule grouped by endpoint and status code, so its episodes carry no service.name and cannot participate in the topology join.
A grouping key is the data contract for your future investigations.
How to score which alerting rule is noisiest
A noise scorecard query condenses rule quality into one table.
FROM .alerts-*
| WHERE kibana.alert.rule.tags == "alerts-as-data-v2"
| EVAL minutes_active = COALESCE(kibana.alert.duration.us, 0) / 60000000.0
| STATS episodes = COUNT(*),
        alert_instances = COUNT_DISTINCT(kibana.alert.instance.id),
        flapping_episodes = SUM(CASE(kibana.alert.flapping == true, 1, 0)),
        median_minutes_active = MEDIAN(minutes_active)
  BY rule = kibana.alert.rule.name, revision = kibana.alert.rule.revision
| SORT episodes DESC
| rule | revision | episodes | instances | flapping | median minutes active |
|---|---|---|---|---|---|
| gateway-5xx-per-endpoint-status | 0 | 14 | 7 | 0 | 1.0 |
| payments-error-rate-per-service | 0 | 3 | 3 | 0 | 7.0 |
| fraud-scorer-queue-lag | 0 | 1 | 1 | 0 | 9.0 |
Read the last column first.
A median active time of one minute means the typical episode from the gateway rule was already resolving itself before the on-call could even sign in, while the two well-grouped rules produced episodes long enough to represent the actual incident.
The flapping column is Kibana's own attempt at the same problem, and it is damage control.
The real fix is upstream, in the rule definition, and the alert history has just told us exactly what to change: the grouping key manufactures instances, and the one-minute window manufactures re-opens.
Alert noise reduction: fixing the rule and proving it worked
The rule's own detail page already summarizes the problem: 14 alerts in 24 hours, every one of them from a single incident, produced by the definition on the right.
We update the rule rather than replace it, changing the grouping to service.name, widening the window to five minutes, and raising the threshold.
FROM logs-payments.stormlab*
| WHERE service.name == "payment-gateway" AND log.level == "ERROR"
| STATS error_count = COUNT(*) BY service.name, cloud.region
| WHERE error_count >= 10
Updating a rule in place matters for one specific reason: Kibana stamps every alert document with kibana.alert.rule.revision, so the before and after of a tuning change are separable in the same index with no bookkeeping on our side.
Then we replay a compressed version of the same failure: same deploy, same lag ramp, same rotating gateway bursts, same customer impact, rollback after seven minutes.
The scorecard query runs unchanged, and now the revision column earns its place:
| rule | revision | episodes | instances | flapping | median minutes active |
|---|---|---|---|---|---|
| gateway-5xx-per-endpoint-status | 0 | 14 | 7 | 0 | 1.0 |
| payments-error-rate-per-service | 0 | 6 | 3 | 0 | 6.0 |
| fraud-scorer-queue-lag | 0 | 2 | 1 | 0 | 8.0 |
| gateway-5xx-per-endpoint-status | 1 | 1 | 1 | 0 | 7.0 |
The unchanged rules now show both incidents in their rows, six and two episodes, which is exactly what stable rules should do.
The gateway rule splits into two rows because the revision changed, and the contrast is the entire argument of this article in four numbers.
Same failure shape, one episode instead of fourteen, and the median episode now lasts seven minutes instead of one, so it spans the incident instead of a fraction of it.
This is the part of alerting work that usually relies on faith, and here it is a query result: the tuning change is verified against the same incident pattern, in the same index, by the same ES|QL.
Nothing about this loop is specific to our lab rule.
Any rule that tags its alerts can be scored, tuned, and re-scored this way, which turns alert tuning from an opinion into a measurement.
Querying alert history with an Agent Builder agent
Every query above is deterministic, which makes them ideal tools for an AI agent.
We register three ES|QL tools in Agent Builder, each one a parameterized version of a query from this article with an explicit KEEP projection, and wire them into an agent called Alert Historian.
POST kbn:/api/agent_builder/tools
{
  "id": "alert_noise_scorecard",
  "type": "esql",
  "description": "Noise scorecard per alerting rule and revision: episodes, distinct instances, flapping episodes, median minutes active.",
  "configuration": {
    "query": "FROM .alerts-* | WHERE kibana.alert.rule.tags == \"alerts-as-data-v2\" AND DATE_DIFF(\"hours\", kibana.alert.start, NOW()) <= ?lookback_hours | EVAL minutes_active = COALESCE(kibana.alert.duration.us, 0) / 60000000.0 | STATS episodes = COUNT(*), alert_instances = COUNT_DISTINCT(kibana.alert.instance.id), flapping_episodes = SUM(CASE(kibana.alert.flapping == true, 1, 0)), median_minutes_active = MEDIAN(minutes_active) BY rule = kibana.alert.rule.name, revision = kibana.alert.rule.revision | KEEP rule, revision, episodes, alert_instances, flapping_episodes, median_minutes_active | SORT episodes DESC",
    "params": {
      "lookback_hours": {
        "type": "integer",
        "description": "How many hours of alert history to analyze, for example 6"
      }
    }
  }
}
The agent's instructions define the vocabulary (an episode is one alert document), the method (timeline first, then propagation, then scorecard), and the honesty rules (report numbers and timestamps from tool output, never invent alerts).
We ask it one question: what happened in the last three hours, was it one incident or many, which team owns the first symptom, and did the gateway rule tuning reduce noise?
The agent called all three tools and got the structure right: it separated the history into two storms with a quiet gap, one per failure wave, rather than blending them into one event.
It attributed the first symptom to team risk-ml, reproduced the upstream deduction about the queue that never alerted, and then answered the tuning question with the revision table.
Its verdict on the fix reads like a review comment backed by data: fourteen episodes at revision 0 against one stable episode at revision 1, with the median episode going from one minute to seven.
The agent is not doing anything we could not do by hand.
That is precisely the point: because alerts are durable, structured data with explicit semantics, a language model can reason over patterns and histories instead of reacting to a single notification, and every number it states is traceable to a tool call you can rerun.
Running alert history queries in production
A few things to decide before you rely on alert history in production.
Retention is a learning-window decision
Alert indices follow an ILM policy, and the default keeps far more than the few hours this lab needed, but if you want quarter-over-quarter rule quality trends, align the policy with that ambition deliberately.
Scope alert index read access narrowly
Alert documents embed rule parameters, reasons, and deep links, so treat .alerts-* read privileges like any other operational dataset and grant the narrowest index patterns that work, for example only the observability alert aliases.
Grouping keys are a data contract
Use ECS field names in BY clauses when they exist, keep cardinality bounded, and never put secrets or personal data into grouping values, because they become kibana.alert.instance.id and live for the retention window.
Project columns aggressively with KEEP
With around 1,400 mapped fields in the alert indices, an unprojected query is unpleasant for humans and actively harmful inside LLM tools, so end every reusable query with KEEP.
Alert storms also stress your automation
If a rule triggers a workflow per alert, fourteen episodes mean fourteen executions doing the same work, which is another argument for pointing automation at the aggregated alert dataset rather than at each notification.
Where to start with your own noisiest rule
The lab in this article is intentionally small, and every piece of it generalizes.
Score your noisiest real rule with the scorecard query, fix its grouping or window, and let kibana.alert.rule.revision tell you whether the fix held.
Join your alert history against whatever catalog you already have; a CMDB export in a lookup index is enough, and the propagation order becomes a query.
If you use Agent Builder, wrap your two or three most-used investigation queries as tools, and the next storm review starts with a conversation instead of a wall of notifications.
The companion notebook builds everything used here: the catalog index, the log data stream, the three rules, both incident replays, the queries, and the Agent Builder tools and agent. It runs for about 25 minutes because the rules evaluate once a minute and the episode durations are the data.
A notification tells you something broke.
The alert history tells you how your detection is performing, and it is already sitting in an index waiting to be queried.
How helpful was this content?
Related Content
Meet Elastic nightshift AI SRE, your always-on SRE coworker

Cross-project search for Elastic Observability: one query across every linked project

Skip writing alert rules: 6 ready-made ES|QL templates ship inside the NGINX OTel integration
Your SLO is on fire; here's how to find the arsonist in Elastic Observability