Meet Elastic® nightshift AI SRE, your always-on SRE coworker
Elastic's SRE team has been running Elastic nightshift against our own production environment. It picks up incidents that never triggered an alert and shows its working for every conclusion it reaches.
Build and observe AI agents where your data already lives. Begin with Elastic Agent Builder. You can also start a free cloud trial or try Elastic on your local machine today.
Today we're announcing the Private Preview of the Elastic® nightshift AI SRE, built into Elastic Observability to find, investigate, and fix production problems alongside your team. The Private Preview on Serverless is free during the promotional period. Sign up for the waitlist here →
Production is outrunning the tools that watch it. Teams ship faster than ever, and more of that code is written by AI. Yet keeping production healthy is still manual work. Someone has to write the alert rules that catch problems and work out why each alert fired, and then they have to apply the fix. Much of what they need to know lives only in the minds of a few engineers. Every release changes what needs watching, and this work has become the bottleneck.
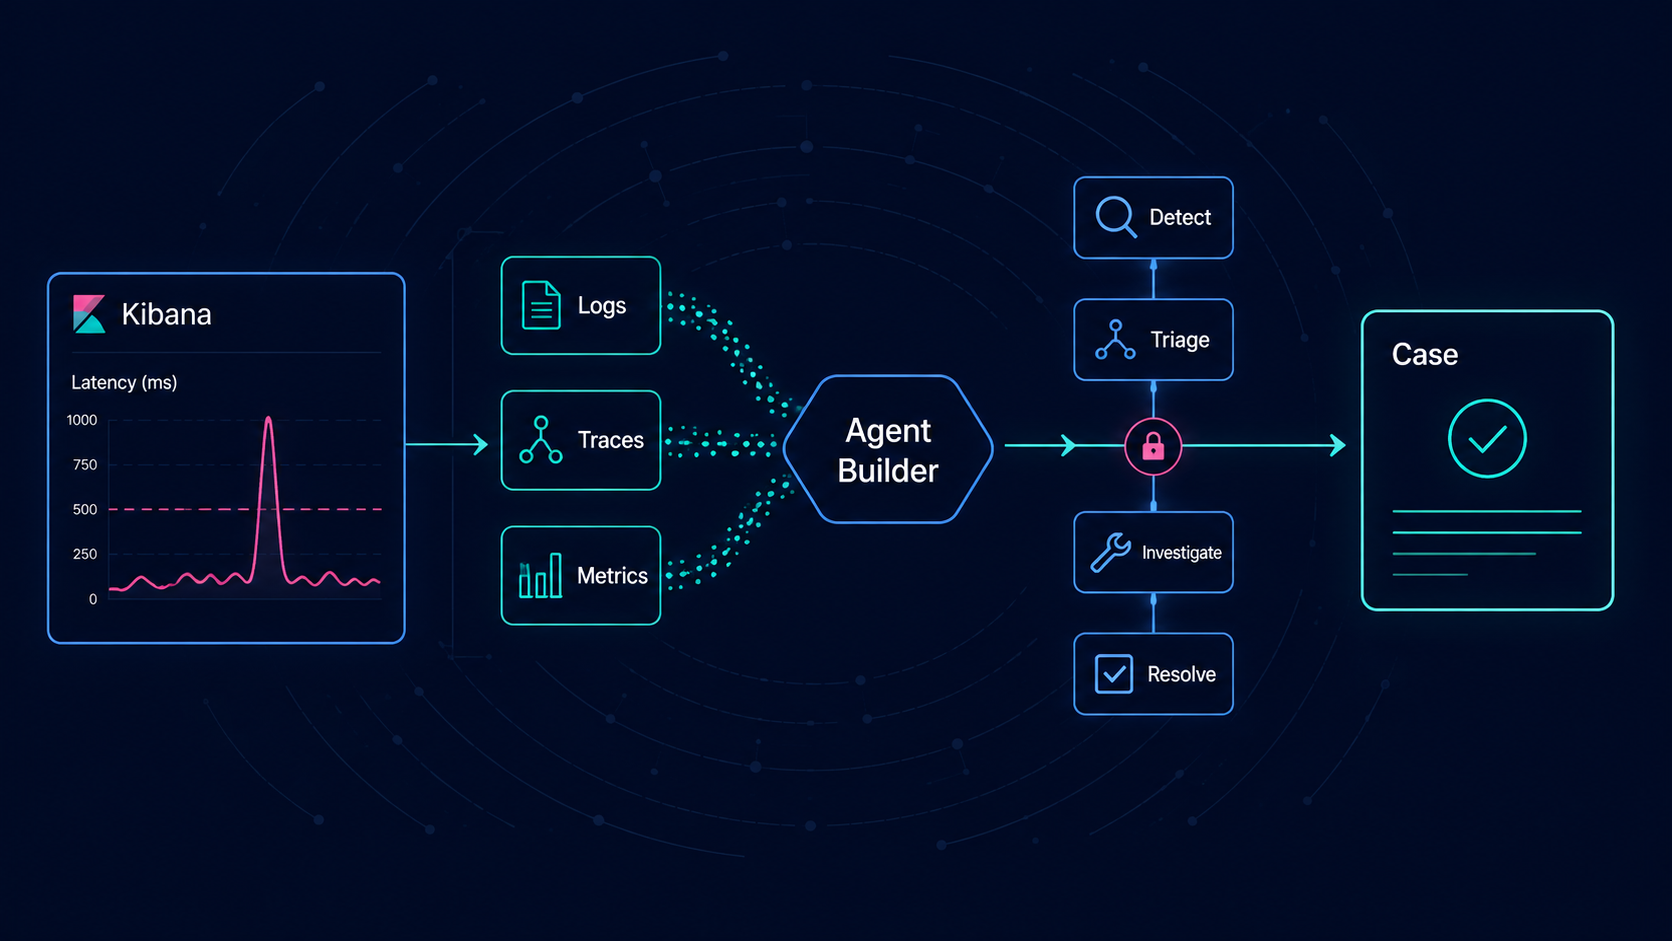
Elastic nightshift AI SRE works alongside your team, with the full context about your systems. It watches your telemetry around the clock and detects problems, including the unknown ones that no alert rule covers. It investigates incidents the way that an experienced site reliability engineer (SRE) would, testing hypotheses against your telemetry data, such as logs, metrics, traces, and profiles, ruling out dead ends and showing you evidence for the root cause. Then it recommends a fix to remediate the problem and applies it automatically, if you want it to.
At every step, it uses the most relevant context about your data and systems, built from your telemetry, code, runbooks, and more. It learns proactively from your data and prior incidents, along with enterprise knowledge. And, like you and your team, it investigates more accurately with every incident it detects or any alert it investigates. Plus, it can work with you in the Kibana UI, a terminal, an agent of your choice, or anywhere else you work.
When we were building this system, it was incredibly important that we earn your trust. If you've been using large language models (LLMs) for a while, you know how overly confident some tend to be. With Elastic nightshift AI SRE, instead of just getting the conclusion, you can follow all the steps that the agent took to get there and even drill down into the raw data, if you need to, as the following animation shows. You can check out the interactive version of this article here.
Elastic nightshift in action.
How Elastic nightshift AI SRE works
Elastic nightshift consists of four engines that work together (or you can use them on their own): Context, Detection, Investigation, and Remediation. For example, you can have it investigate alerts from the monitoring tools that you already use without turning on detection.
Engine | What it does | What triggers it | What you get |
Context | Builds knowledge of your environment from telemetry, code, runbooks, and wikis | Runs continuously from the moment it has access to your data and systems | Entities, relationships, and a long-term memory of past incidents that the other three engines draw on |
Detection | Evaluates telemetry continuously and flags what needs attention, with no alert rules to write or maintain | Always on when configured for data in Serverless | A significant event grouping related signals across services, with the parts of your system that it affects |
Investigation | Tests hypotheses in parallel against logs, metrics, traces, and profiles, separating symptoms from causes | Any alert, fired in Elastic or a connected tool; optionally a significant event | A root cause in plain language, affected services, proposed actions, and the blind spots that it couldn’t verify |
Remediation | Picks a workflow or connector action and fills in the parameters for this incident, or gives you commands to run | A completed investigation | A fix that you review before it runs (or apply automatically, if you choose) |
Telemetry and alerts from anywhere, for detection and investigation.
Most importantly, you don't have to move your data to use it. The agents run on Elastic Observability Serverless and reach out to your telemetry and alerts in the systems where they already live. By technical preview later this year, it will work with:
Data in Elastic Observability Serverless (sending data there is optional).
Elastic Cloud Hosted (ECH) deployments.
Self managed clusters (provided that the Elasticsearch endpoint is exposed appropriately).
Popular third-party observability tools.
Popular telemetry stores and databases.
When you sign up for the waitlist, tell us which third-party tools, telemetry stores, and databases you want most so we can prioritize accordingly. In addition, we’re working toward a plan to deploy all this functionality in self-managed environments. We’ll have more to share later this year.
Context Engine: Giving an AI SRE knowledge of your systems
When an experienced SRE joins a new team, their skills come with them, but their knowledge of the system doesn't. They spend weeks learning the architecture, the runbooks, and the history of past incidents, along with which services are always noisy. What makes an SRE fast is the combination: years of experience plus deep knowledge of the system they run.
The same is true for AI agents. LLMs bring some of the experience but none of the knowledge of your system. Without context, an agent spends time and tokens working out how things fit together before it gets to the actual problem.
The Context Engine gives Elastic nightshift that knowledge before an incident starts. It's the layer that ties the whole system together.
The Context Engine builds its knowledge in three ways:
Ahead of time. As soon as it has access to your data and systems, it extracts knowledge from your telemetry; that is, the entities in your environment, such as services and hosts, and the relationships between them. It can also read your wikis, runbooks, and code from systems like GitHub.
From its own work. Each investigation and detection adds to a long-term memory of what happened and what fixed it.
From your interactions and input. Give it feedback about detections, or feed it a postmortem doc. You can also manually upload important information.
Remembering facts like these is different from the investigation learning described earlier. The Context Engine remembers what's true about your environment, while the Investigation Engine gets better at how it investigates.
Elastic stores telemetry efficiently enough that you can keep it unsampled, and the agent can search everything within your retention period. Because that telemetry and the knowledge built from it live on Elastic alongside the agent, it can go back to the raw data behind its conclusions.
Investigation Engine: AI root cause analysis from any alert
Alerts pile up, and each one that matters still lands on an engineer who has to piece together logs, metrics, traces, and recent changes by hand before they can even consider a fix.
Your new AI SRE coworker takes on that work, using the Investigation Engine. An investigation can start automatically from any alert, whether it’s fired in Elastic or in another tool that you've connected. From there, it does what a good on-call engineer would:
Checks what changed.
Forms hypotheses about the cause.
Tests them in parallel against your logs, metrics, traces, and profiles.
Follows the leads that the evidence supports and drops the ones it doesn't.
Separates symptoms from causes.
Converges on the most likely root cause.
Proposes a fix.
The core logic in our Investigation Engine comes from Deductive AI, which Elastic acquired, and builds on Deductive's three years of work on automated incident investigation.
An investigation evaluates many hypotheses, honing in on the root cause.
The nightshift agent plans a step and runs the tools to carry it out. It observes what comes back and checks its conclusions against the evidence before moving on. Across investigations, it learns which paths lead to useful evidence and successful outcomes, so it gets better at investigating with every incident.
We talked earlier about building trust when using agentic systems, and this is one example of earning it from you. You can expand any step of an investigation to see the reasoning behind it and the queries that the agent ran. You can also see the raw data that it ran them against.
Inspecting evidence of the investigation.
When an investigation finishes, you get:
A conclusion. The root cause, in plain language, and the immediate fix that we’d recommend.
Impact. Which services are affected and how many problems each one has.
Proposed actions. Next steps, each waiting for your review.
Blind spots. What the agent couldn't verify, so you know where its confidence ends.
Detection Engine: How do you catch incidents with no alert rule?
The hardest incidents are often the ones that never triggered an alert to begin with. As a result, the service degrades and users notice. Monitoring stays quiet. No one can write an alert rule for a failure that they haven't imagined, and when something does fire, the related signals are scattered across services, each raising its own alert.
Your new coworker also takes on that work, using the Detection Engine, which continuously evaluates your telemetry and flags what needs attention. You don’t have to write or maintain any alert rules. When related signals show up across several services, it groups them into a single significant event that shows the signals behind it and the parts of your system that it affects. Significant Events can start an investigation automatically, if you choose, so that it’s already underway by the time someone looks.
Remediation Engine: Automated remediation from the diagnosis
Historically, Observability often stopped at the diagnosis. It could tell you that something was wrong, and eventually why, but the fix was up to you. Runbook automation could only replay the fixes that someone had scripted in advance, and real incidents rarely follow the script.
Your same new coworker also takes on this work, using the Remediation Engine, which recommends a fix. It can pick one of your existing workflows or connector actions in Elastic Workflows and fill in the parameters for this incident, or it can give you commands or instructions that you can copy into a terminal or a coding agent. Unlike a runbook script, the action and its parameters come from the diagnosis of the incident in front of it. You decide how much it does on its own; you review each action and the parameters it chose before it runs, or let it apply fixes automatically.
Using the AI SRE from Kibana, your terminal, or Slack
Kibana will always be a first-class home for Elastic nightshift, and we'll keep making it a great experience. The Elastic nightshift home page lists your team’s open and recent investigations, sorted by severity, so whoever is on call can see at a glance what needs attention and what's already been handled.
However, more and more engineers want to use our products from the tools they already live in, like a terminal, a coding agent, or a chat channel, and we're embracing that:
Elastic CLI. You'll be able to pick up an investigation from your terminal or from a coding agent, like Claude, Cursor, or Codex, and carry on from there. Where Model Context Protocol (MCP) is the easier way to connect an agent, you can use that instead.
Slack. We're building a Slack integration that makes Elastic nightshift feel like a coworker in your channels. It will post finished investigations (and answer questions about them) where your team already talks. More importantly, it will learn from any interaction in Slack. Nudge it along with additional context, or post a root cause analysis or postmortem document in the Slack thread to automatically trigger a learning loop that will use all of this information to get better for the next incident.
Elastic nightshift responding in Slack, correlating alerts and investigating automatically.
Join the waitlist for the AI SRE private preview
Elastic's own SRE team already runs Elastic nightshift against our production environment, and what team members learn goes straight back into the product. With the private preview, we're opening it to more teams.
Who can join: Existing Elastic users, at no cost during the early access period.
What's included: A preview of the four engines described above, with more capabilities arriving every week.
What we ask: Honest feedback. We'll work directly with preview teams, and what you tell us will shape what we build next.
What's next: Technical preview in Elastic Cloud Serverless later this year.
How helpful was this content?
Related Content
Automated root cause analysis for AWS: From a CloudWatch alert to a diagnosed incident in 36 seconds
.jpg)
Collecting rootless Podman logs with Elastic Agent: the CRI parser, user-scoped paths, and the Podman socket
Your AI agent needs an alibi: Observability and audit trails for Agent Builder in Elastic
From recommendation to remediation in 4 stages: human-in-the-loop automation with Elastic Workflows