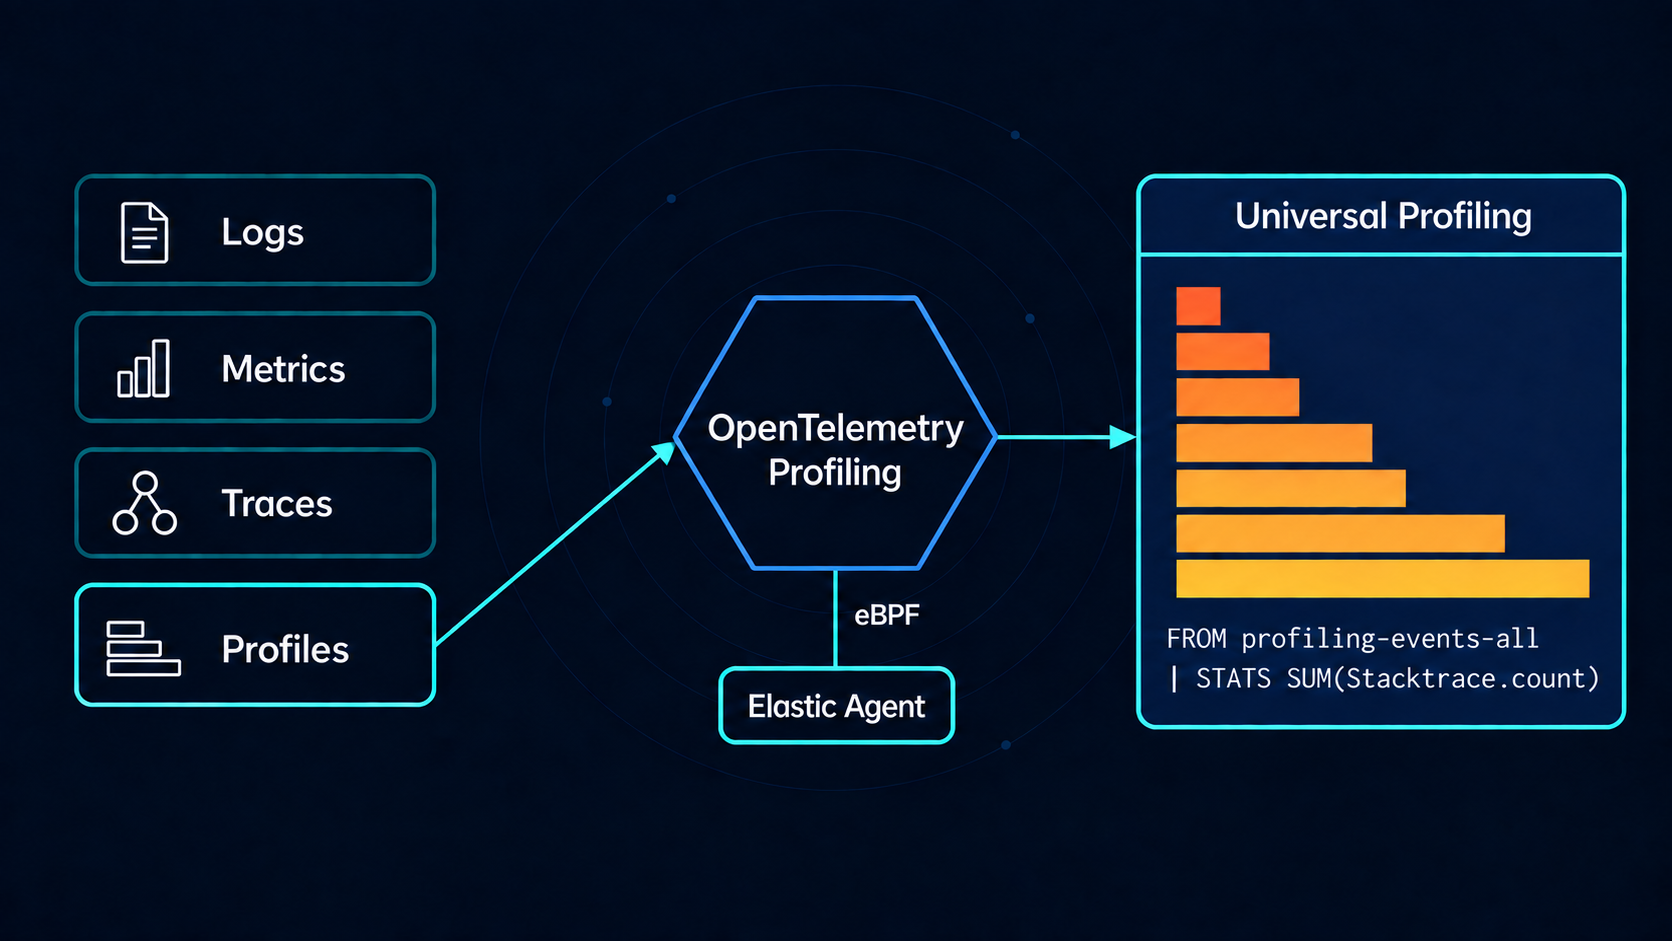
Your trace stops at the span; continuous profiling with OpenTelemetry doesn’t
Continuous profiling sampled an unmodified Java app serving 30,150 requests on a little over half a CPU core, with no code change and no restart.
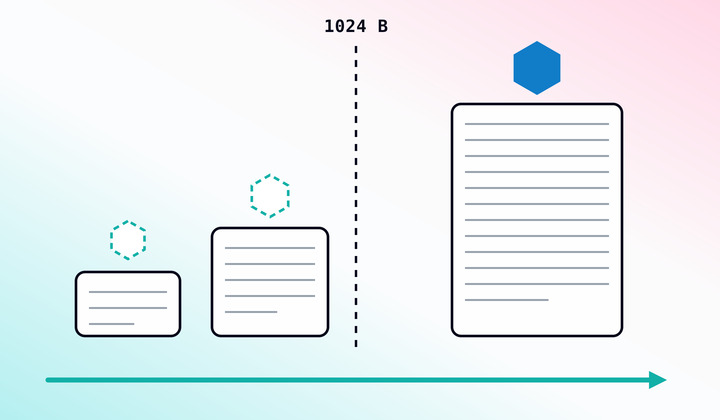
No log file too small: How Elastic Agent tracks files below the 1 KiB threshold
Elastic Agent 9.5 builds a small log file's identity out of the bytes it already has, then re-links it as it grows and crosses 1024 bytes, so it is never re-ingested.
.jpg)
Collecting rootless Podman logs with Elastic Agent: the CRI parser, user-scoped paths, and the Podman socket
Rootless Podman containers write their logs in CRI format. This Fleet policy reads them and attaches container.* fields, with the match_source_index value that rootless paths need.
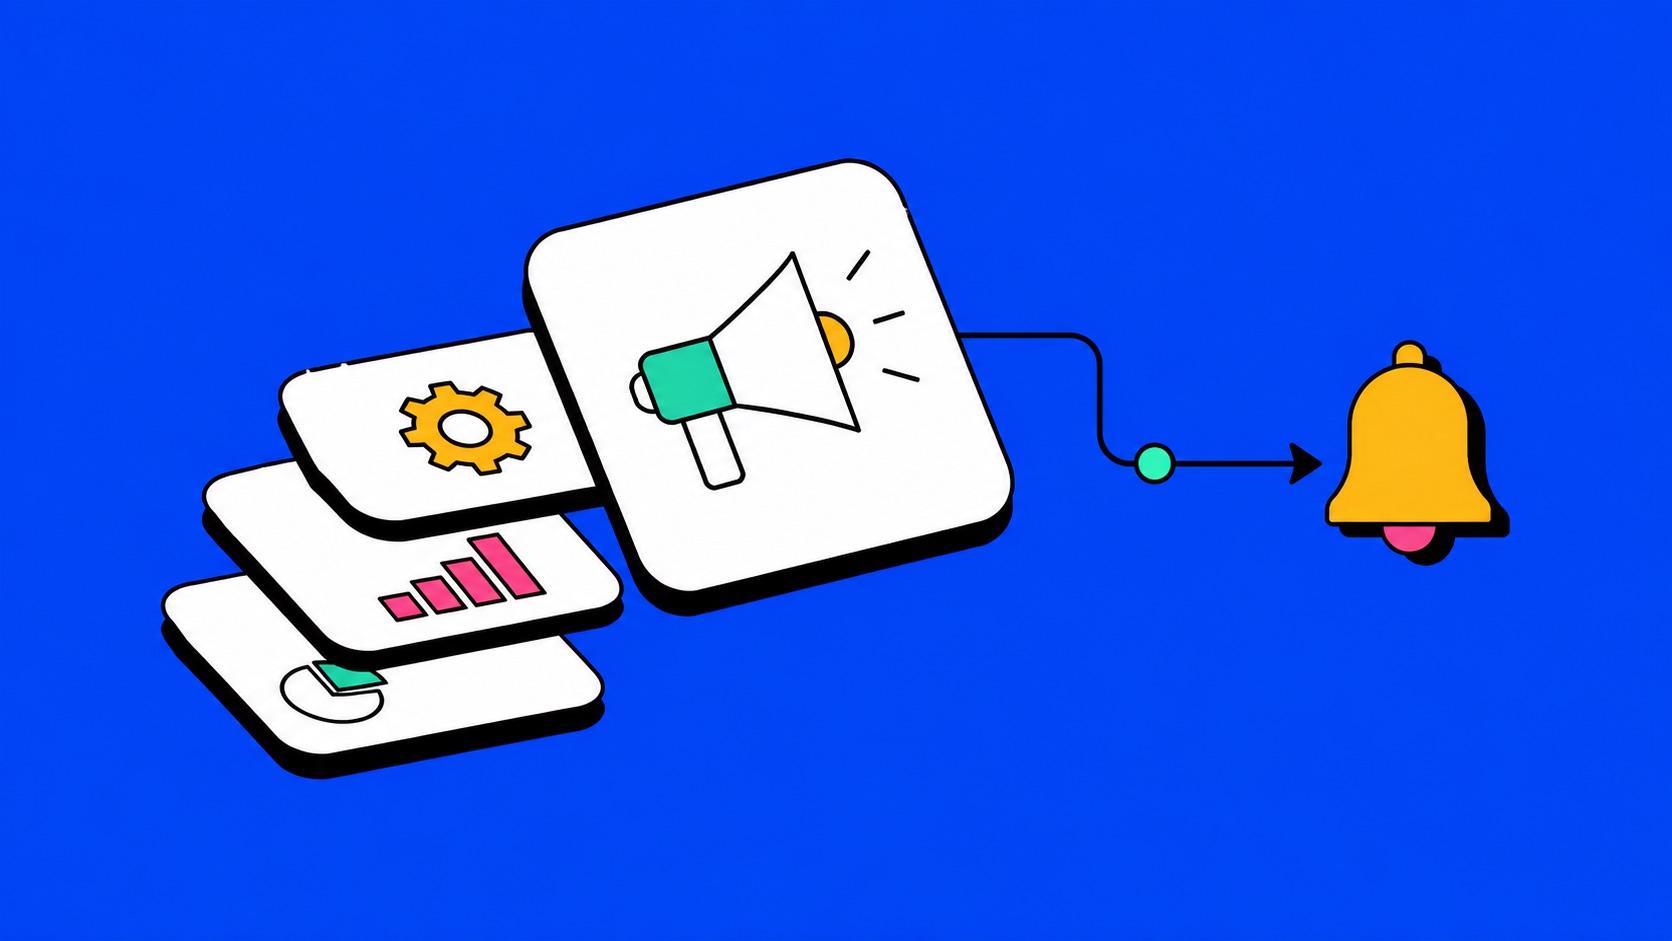
Skip writing alert rules: 6 ready-made ES|QL templates ship inside the NGINX OTel integration
Elastic integrations come with alerting rule templates, each one an ES|QL query with a threshold already set. Create Elasticsearch alert rules in minutes, tune them to your traffic, and catch silent data streams early.
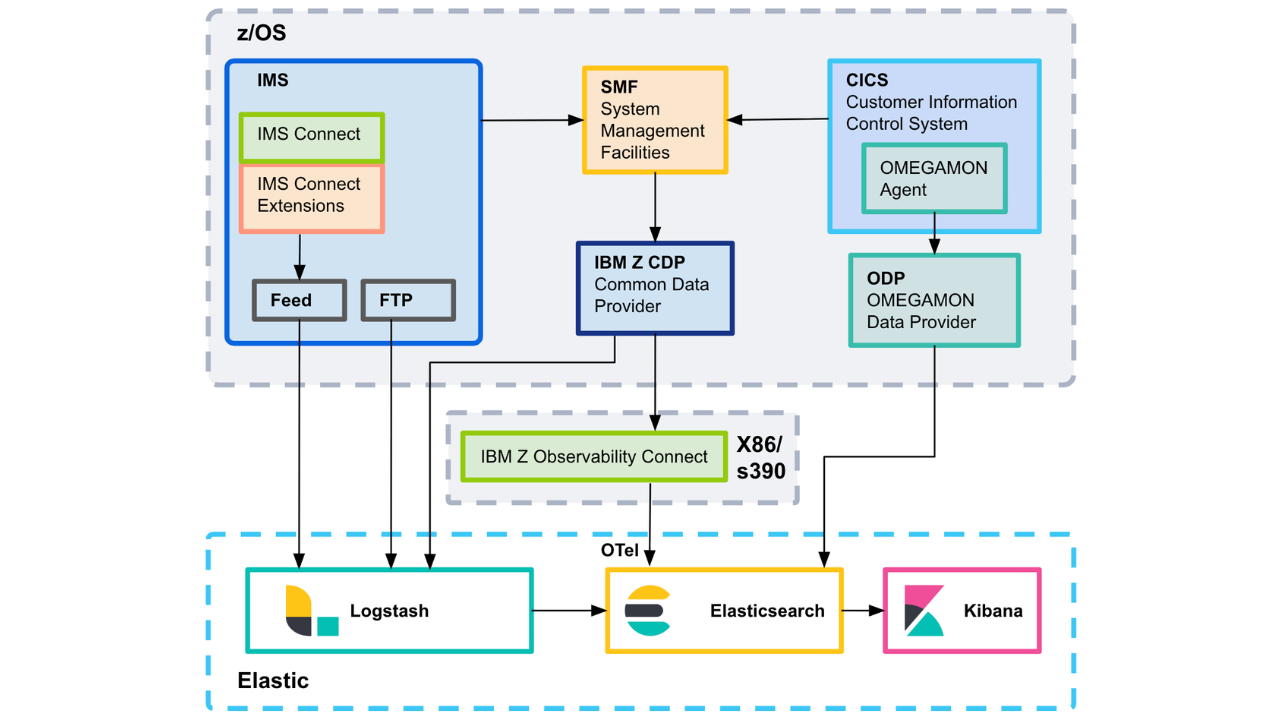
Elastic z/OS ingest: five architectures for mainframe data
This field guide walks through the ingest architectures I've seen work in production, the data quality checks that decide whether your dashboards actually work, and the ECS mapping that makes mainframe data usable to the platform.
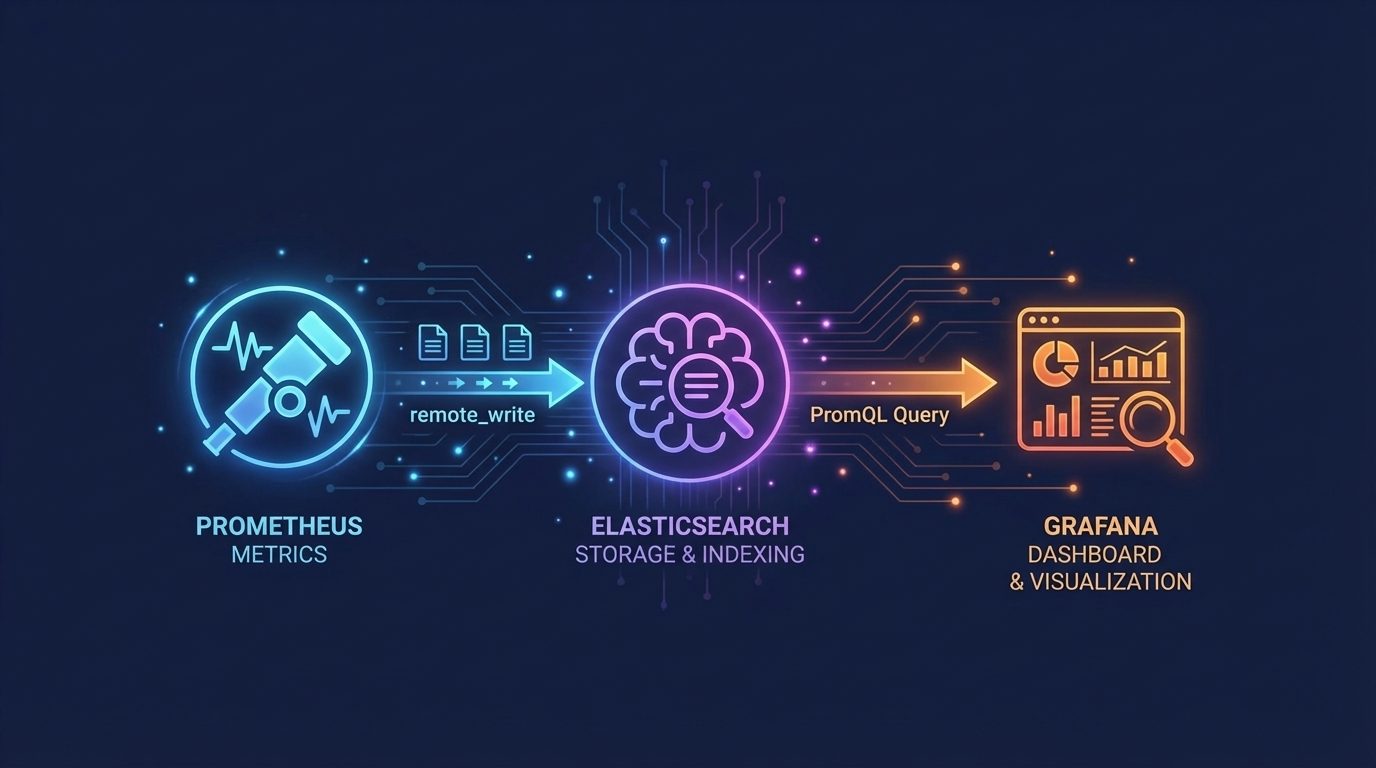
Use Elasticsearch as a Drop-In Prometheus Backend for Grafana
Use Elasticsearch as a Prometheus backend for Grafana dashboards, autocomplete, Metrics Drilldown, and alerting without changing PromQL workflows.
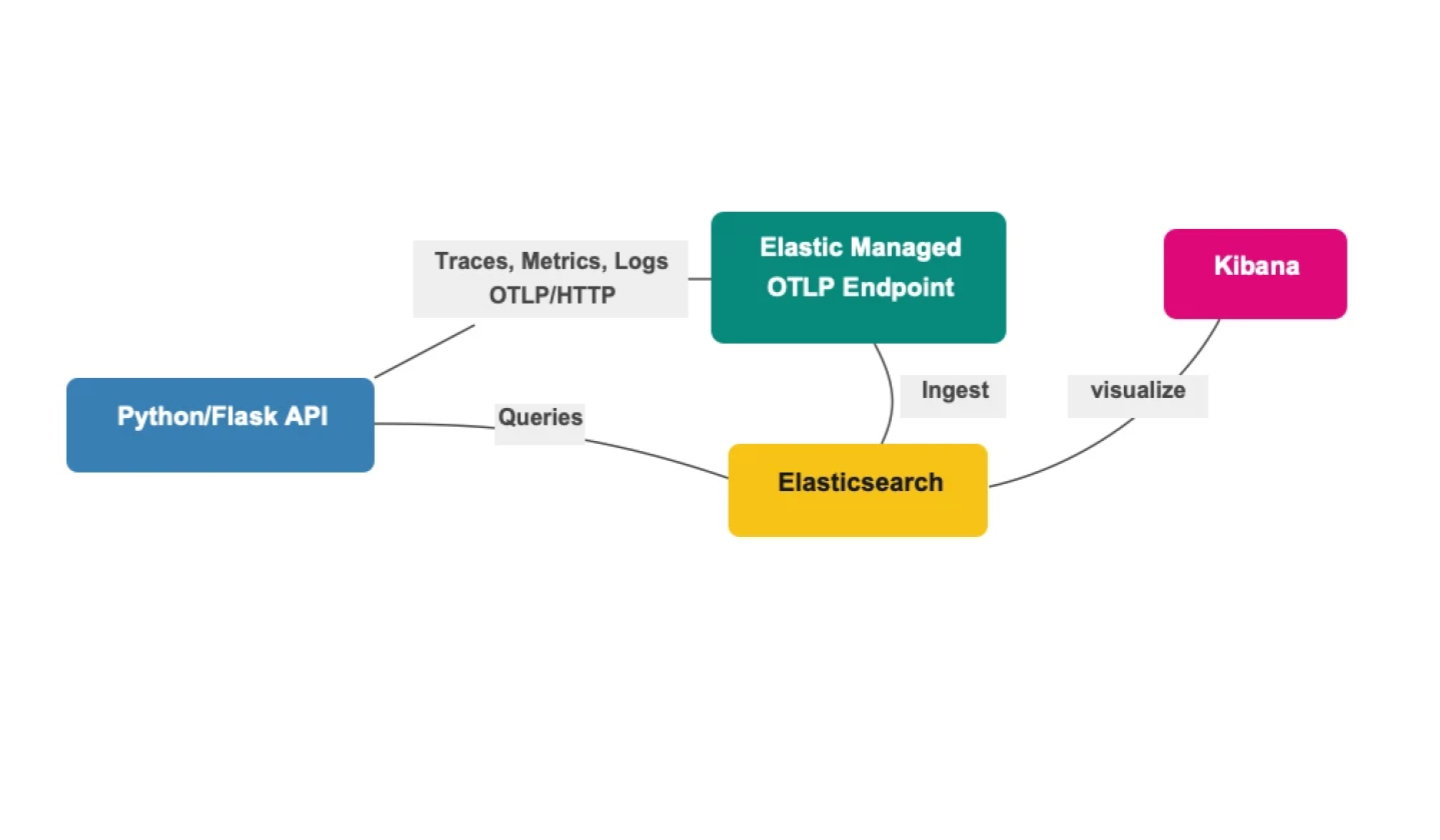
3 signals, 2 env vars, 0 collectors: OpenTelemetry with Python and Elastic's Managed OTLP Endpoint
Instrument a Flask API with OpenTelemetry and ship traces, metrics, and logs to Elastic Cloud using just 2 environment variables, no collector needed.

How Elastic's ML and AI Assistant cut 802.1x triage from 20 minutes to seconds in the NOC
Find out how Network Operations Center (NOC) teams use Elasticsearch, ML, and the Elastic AI Assistant to cut MTTR, tame alert fatigue, and solve network issues fast.
Migrate Logstash Pipelines from Azure Event Hubs to OTel Collector Kafka Receiver
Step-by-step guide to migrating Logstash pipelines from the Azure Event Hubs plugin to the OpenTelemetry Collector Kafka receiver.
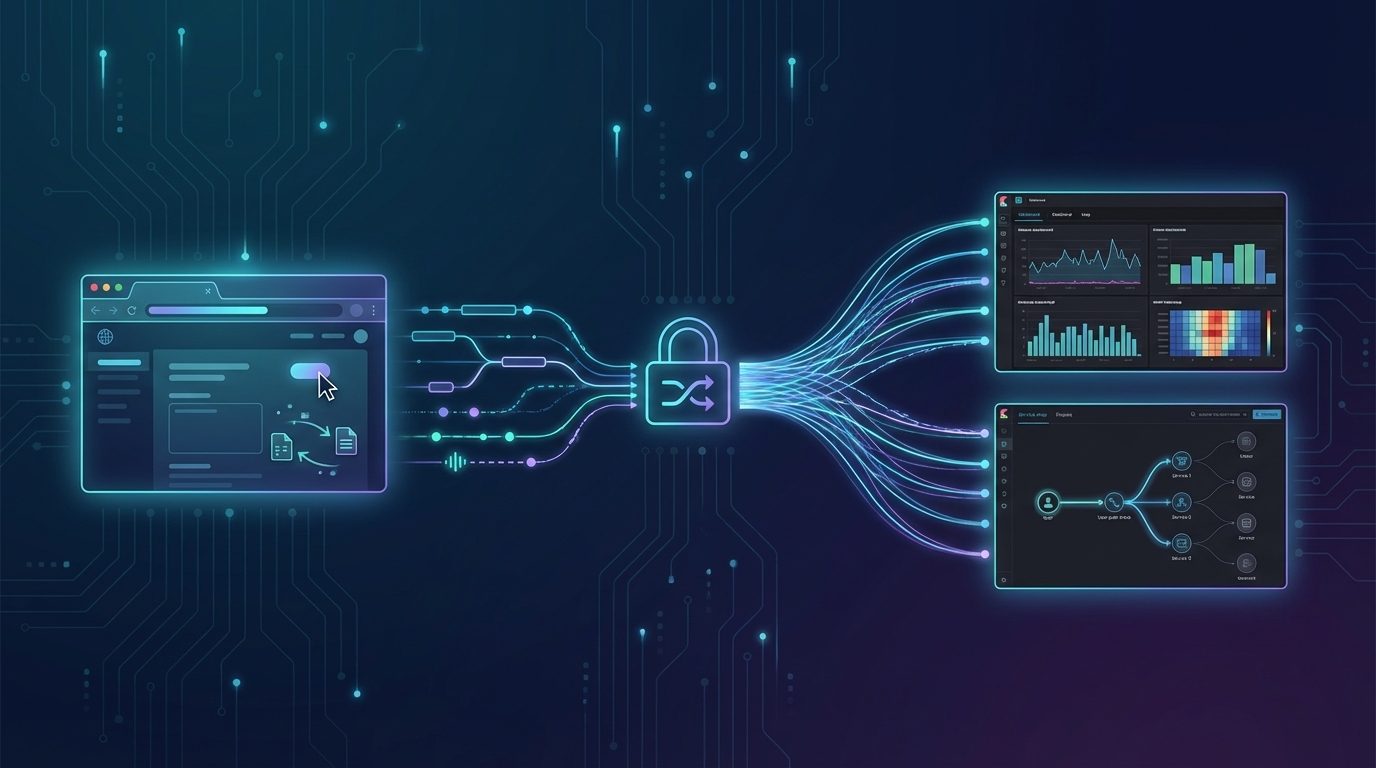
OpenTelemetry browser instrumentation using EDOT Browser & Kibana
A step-by-step guide on OpenTelemetry browser instrumentation. Learn how to add EDOT Browser to a web app, export browser telemetry via OTLP, and verify traces, spans, and service maps in Kibana.
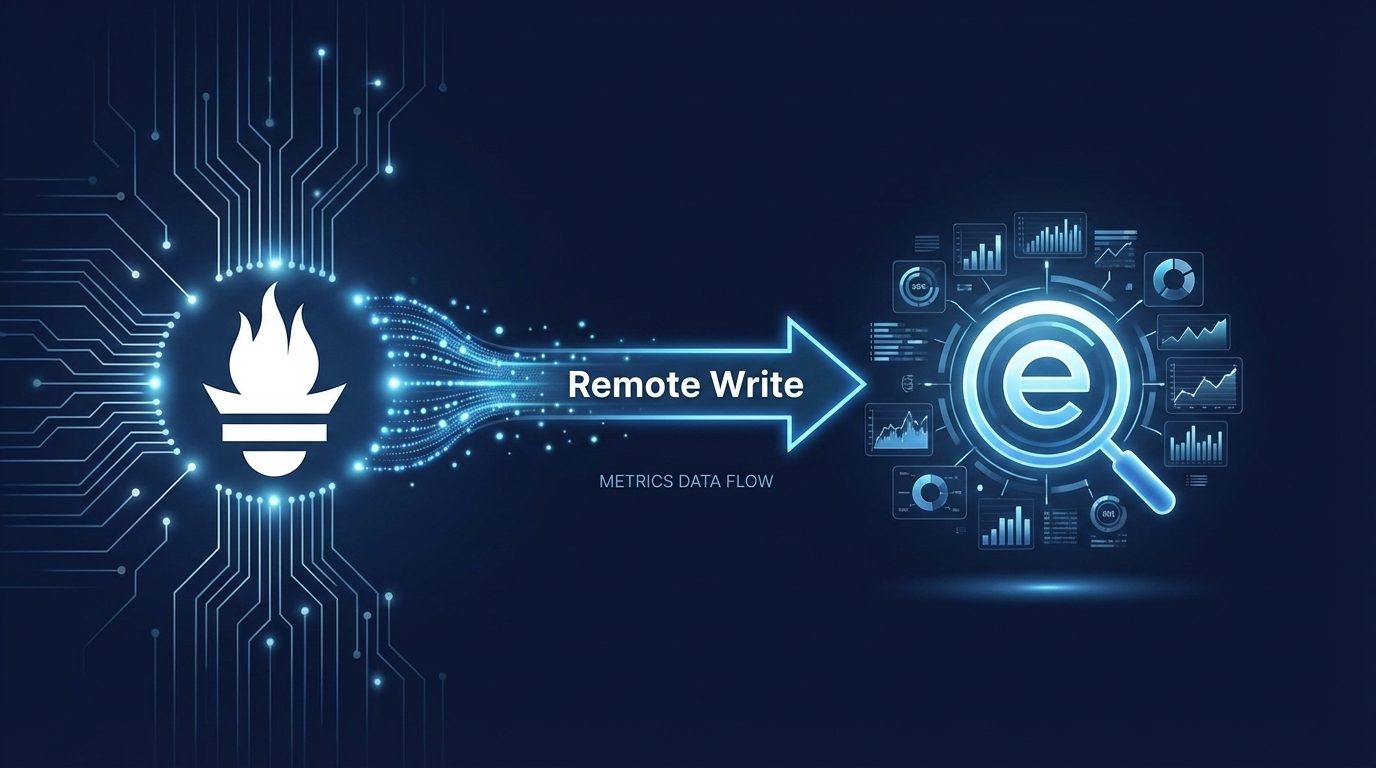
Ship Prometheus Metrics to Elasticsearch with Remote Write
Elasticsearch natively supports Prometheus Remote Write. Add a single remote_write block to your Prometheus config and use Elasticsearch as Prometheus-compatible long-term storage.
Migrate Logstash Pipelines from Azure Event Hubs to Kafka Input Plugin
Step-by-step guide to migrating Logstash pipelines from the Azure Event Hubs plugin to the Kafka input plugin to eliminate offset storage costs and improve performance.