
Managing your applications on Amazon ECS EC2-based clusters with Elastic Observability
Learn how to manage applications on Amazon ECS clusters based on EC2 instances and how simple it is to use Elastic agents with the AWS and docker integrations to provide a complete picture of your apps, ECS service, and corresponding EC2 instances.

Exploring Nginx metrics with Elastic time series data streams
Elasticsearch recently released time series metrics as GA. In this blog, we dive into details of what a time series metric document is and the mapping used for enabling time series by using an existing OOTB Nginx integration.

Using the Elastic Agent to monitor Amazon ECS and AWS Fargate with Elastic Observability
In this article, we’ll guide you through how to install the Elastic Agent with the AWS Fargate integration as a sidecar container to send host metrics and logs to Elastic Observability.
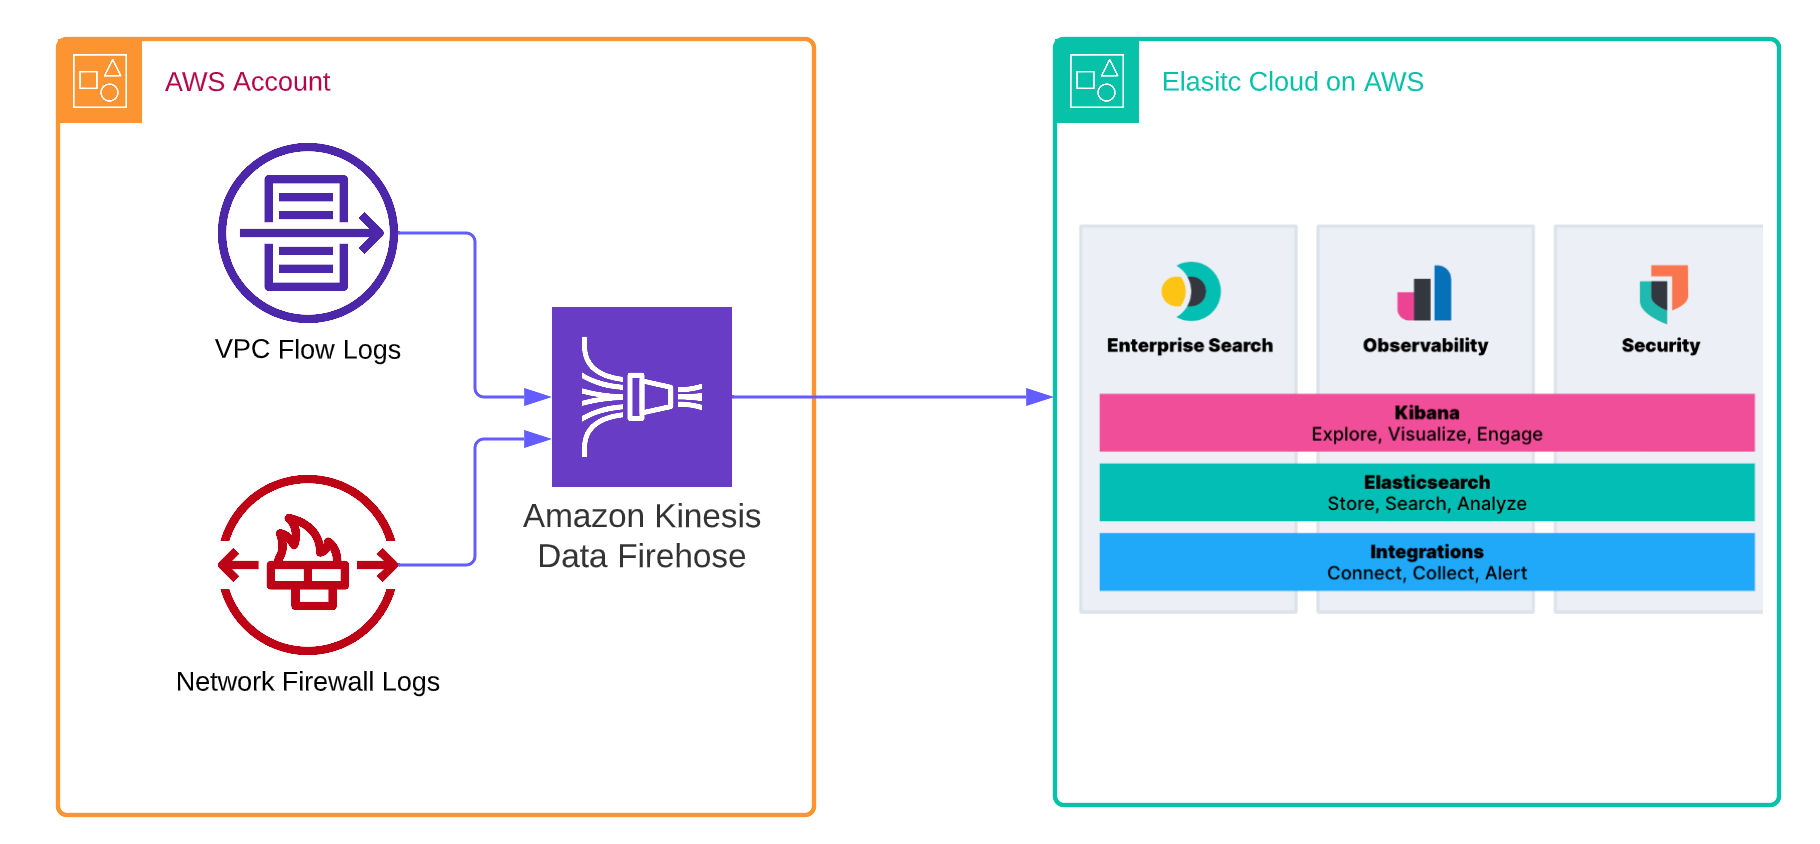
Unleash the power of Elastic and Amazon Kinesis Data Firehose to enhance observability and data analytics
AWS users can now leverage the new Amazon Kinesis Firehose Delivery Stream to directly ingest logs into Elastic Cloud in real time for centralized alerting, troubleshooting, and analytics across your cloud and on-premises infrastructure.
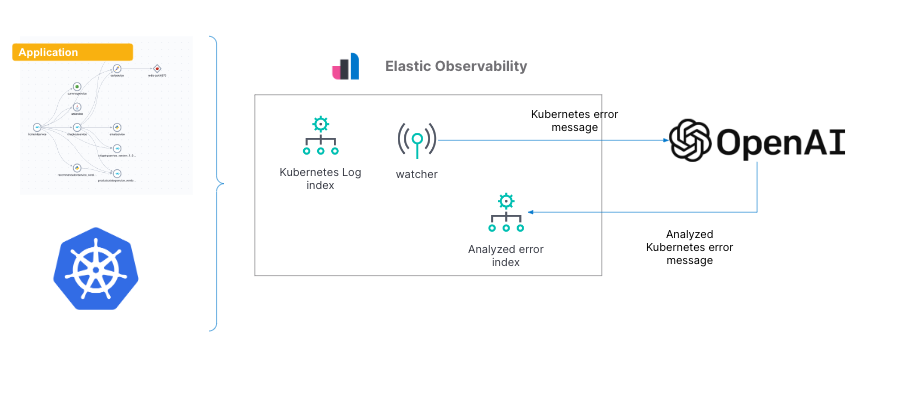
Gain insights into Kubernetes errors with Elastic Observability logs and OpenAI
This blog post provides an example of how one can analyze error messages in Elasticsearch with ChatGPT using the OpenAI API via Elasticsearch.

Trace your Azure Function application with Elastic Observability
Serverless applications deployed on Azure Functions are growing in usage. This blog shows how to deploy a serverless application on Azure functions with Elastic Agent and use Elastic's APM capability to manage and troubleshoot issues.
.png)
How to monitor Kafka and Confluent Cloud with Elastic Observability
This blog post will take you through best practices to observe Kafka-based solutions implemented on Confluent Cloud with Elastic Observability.
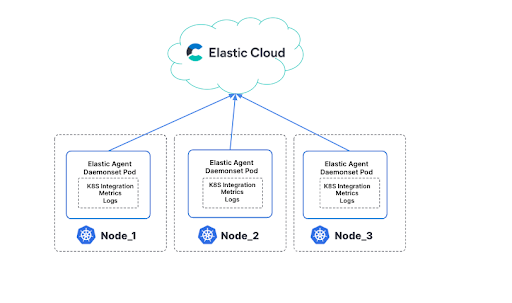
Using Elastic to observe GKE Autopilot clusters
See how deploying the Elastic Agent onto a GKE Autopilot cluster makes observing the cluster’s behavior easy. Kibana integrations make visualizing the behavior a simple addition to your observability dashboards.

Easily analyze AWS VPC Flow Logs with Elastic Observability
Elastic Observability can ingest and help analyze AWS VPC Flow Logs from your application’s VPC. Learn how to ingest AWS VPC Flow Logs through a step-by-step method into Elastic, then analyze it and apply OOTB machine learning for insights.

Wait… Elastic Observability monitors metrics for AWS services in just minutes?
Get metrics and logs from your AWS deployment and Elastic Observability in just minutes! We’ll show you how to use Elastic integrations to quickly monitor and manage the performance of your applications and AWS services to streamline troubleshooting.
.jpg)
Independence with OpenTelemetry on Elastic
OpenTelemetry has become a key component for observability given its open standards and developer-friendly tools. See how easily Elastic Observability integrates with OTel to provide a platform that minimizes vendor lock-in and maximizes flexibility.
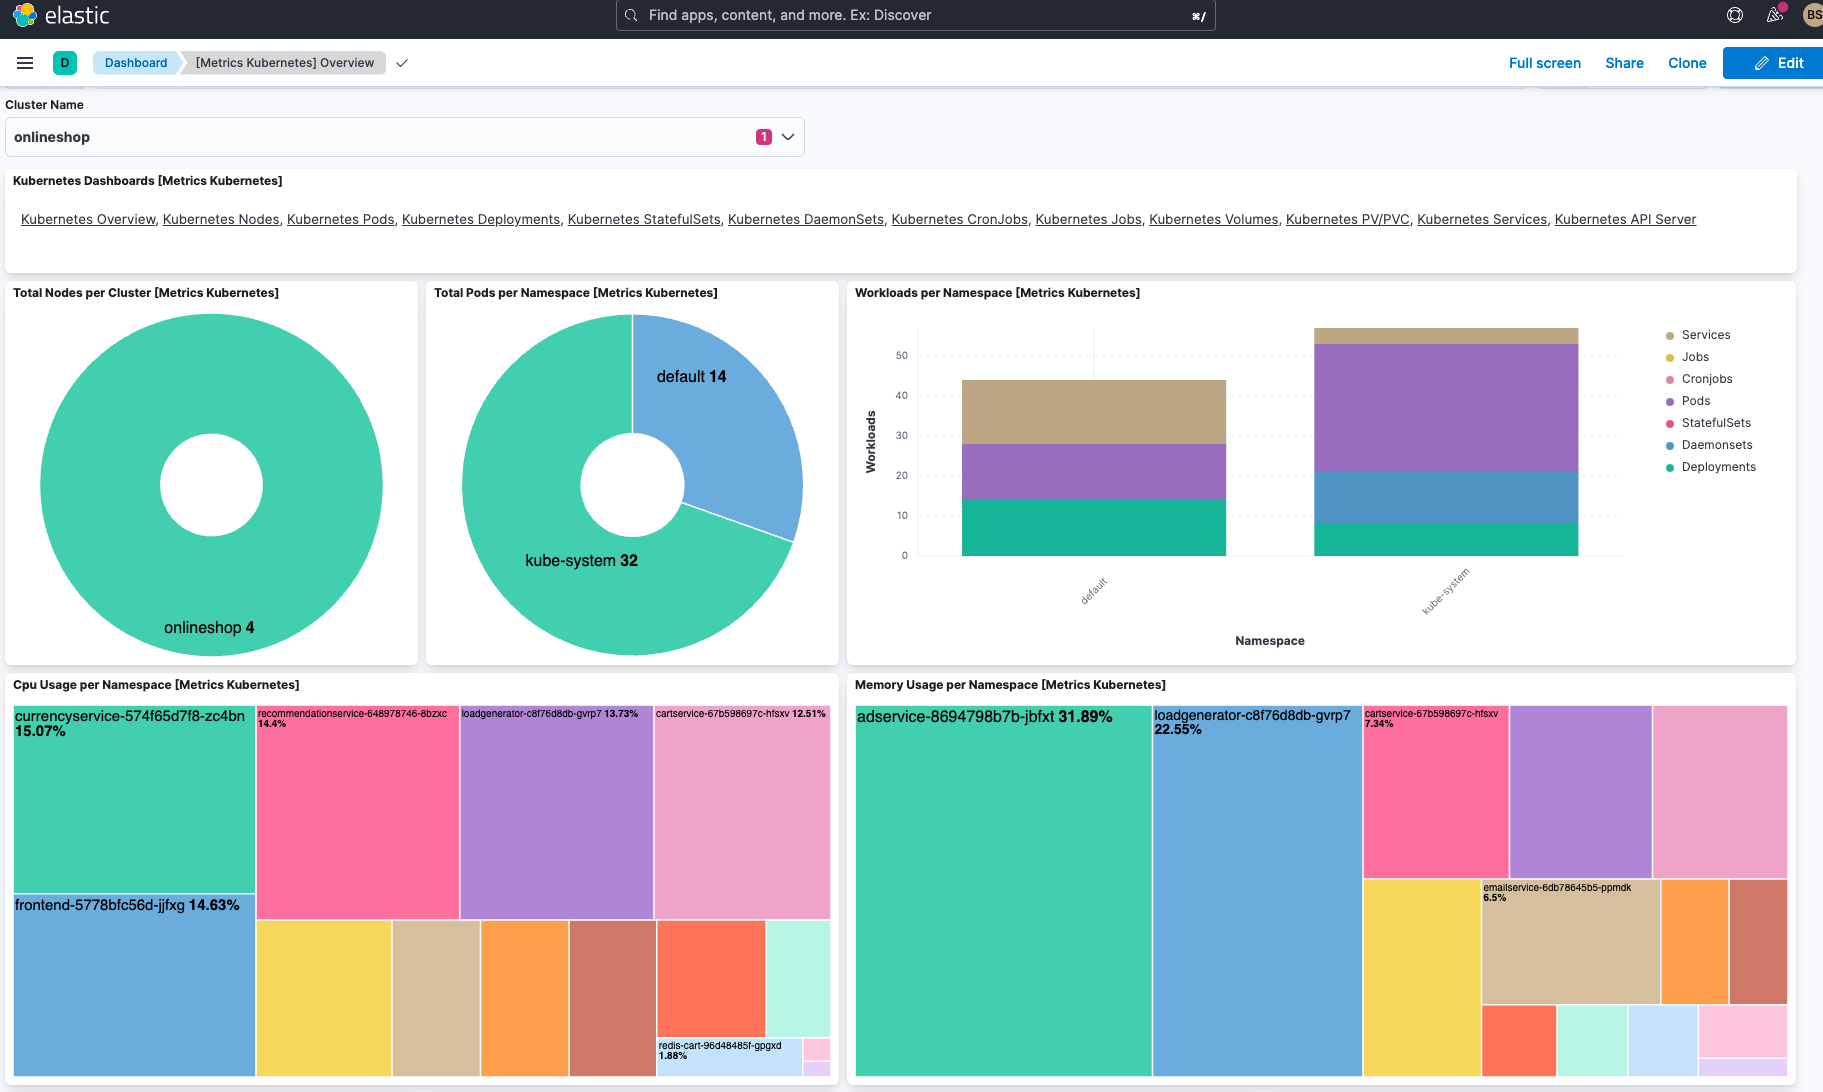
Managing your Kubernetes cluster with Elastic Observability
Unify all of your Kubernetes metrics, log, and trace data on a single platform and dashboard, Elastic. From the infrastructure to the application layer Elastic Observability makes it easier for you to understand how your cluster is performing.