
Author
David Hope
Director, Observability and AIOps Solutions at Elastic
David Hope is a dedicated IT professional with over 16 years of diverse experience spanning from development, DevOps, leadership, sales, and product marketing. David currently lives in the USA with his family and moved here eight years ago from the UK after meeting his wife in Buffalo, NY.
Articles
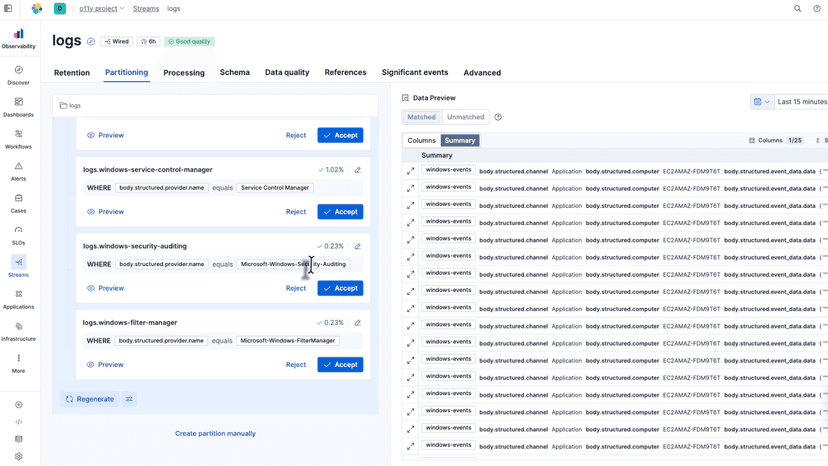
Windows Event Log Monitoring with OpenTelemetry & Elastic Streams
Learn how to enhance Windows Event Log monitoring with OpenTelemetry for standardized ingestion and Elastic Streams for smart partitioning and analysis.

AI-driven incident response with logs: A technical deep dive in Elastic Observability
How Elastic combines ML anomaly detection, ES|QL, and the AI Assistant to accelerate incident response using logs.
Getting more from your logs with OpenTelemetry
Learn how to evolve beyond basic log ingest by leveraging OpenTelemetry for ingestion, structured logging, geographic enrichment, and ES|QL analytics. Transform raw log data into actionable intelligence with practical examples and proactive observability strategies.

The observability gap: Why your monitoring strategy isn't ready for what's coming next
The increasing complexity of distributed applications and the observability data they generate creates challenges for SREs and IT Operations teams. Take a look at how you can close this observability gap with OpenTelemetry and the right strategy.

The next evolution of observability: unifying data with OpenTelemetry and generative AI
Generative AI and machine learning are revolutionizing observability, but siloed data hinders their true potential. This article explores how to break down data silos by unifying logs, metrics, and traces with OpenTelemetry, unlocking the full power of GenAI for natural language investigations, automated root cause analysis, and proactive issue resolution.

2025 observability trends: Maturing beyond the hype
Discover what 500+ decision-makers revealed about OpenTelemetry adoption, GenAI integration, and LLM monitoring—insights that separate innovators from followers in Elastic's 2025 observability survey.

Best Practices for Log Management: Leveraging Logs for Faster Problem Resolution
Explore effective log management strategies to improve system reliability and performance. Learn about data collection, processing, analysis, and cost-effective management of logs in complex software environments.

Tailoring span names and enriching spans without changing code with OpenTelemetry - Part 1
The OpenTelemetry Collector offers powerful capabilities to enrich and refine telemetry data before it reaches your observability tools. In this blog post, we'll explore how to leverage the Collector to create more meaningful transaction names in Elastic Observability, significantly enhancing the value of your monitoring data.

Adding free and open Elastic APM as part of your Elastic Observability deployment
Learn how to gather application trace data and store it alongside the logs and metrics from your applications and infrastructure with Elastic Observability and Elastic APM.

Auto-instrumentation of .NET applications with OpenTelemetry
OpenTelemetry provides an observability framework for cloud-native software, allowing us to trace, monitor, and debug applications seamlessly. In this post, we'll explore how to automatically instrument a .NET application using OpenTelemetry.

Manual instrumentation of .NET applications with OpenTelemetry
In this blog, we will look at how to manually instrument your .NET applications using OpenTelemetry, which provides a set of APIs, libraries, and agents to capture distributed traces and metrics from your application. You can analyze them in Elastic.

Auto-instrumentation of Java applications with OpenTelemetry
Instrumenting Java applications with OpenTelemetry provides insights into application performance, dependencies, and errors. We'll show you how to automatically instrument a Java application using Docker, with no changes to your application code.

Manual instrumentation of Java applications with OpenTelemetry
OpenTelemetry provides an observability framework for cloud-native software, allowing us to trace, monitor, and debug applications seamlessly. In this post, we'll explore how to manually instrument a Java application using OpenTelemetry.

Understanding APM: How to add extensions to the OpenTelemetry Java Agent
This blog post provides a comprehensive guide for Site Reliability Engineers (SREs) and IT Operations to gain visibility and traceability into applications, especially those written with non-standard frameworks or without access to the source code.
.jpeg&w=828&q=75)
Gaining new perspectives beyond logging: An introduction to application performance monitoring
Change is on the horizon for the world of logging. In this post, we’ll outline a recommended journey for moving from just logging to a fully integrated solution with logs, traces, and APM.
Monitor OpenAI API and GPT models with OpenTelemetry and Elastic
Get ready to be blown away by this game-changing approach to monitoring cutting-edge ChatGPT applications! As the ChatGPT phenomenon takes the world by storm, it's time to supercharge your monitoring game with OpenTelemetry and Elastic Observability.
How to monitor Kafka and Confluent Cloud with Elastic Observability
This blog post will take you through best practices to observe Kafka-based solutions implemented on Confluent Cloud with Elastic Observability.