
Author
Felix Barnsteiner
Tech Lead
Felix joined Elastic in 2018 where he built the Elastic APM Java agent from the ground up. Two years in, he took the role of the tech lead for the APM Agents team. Another two years later, he became tech lead of application observability. Since Oct 2023, Felix is a floating tech lead in observability, focusing on strategical initiatives, such as working with other teams to make Elasticsearch the best place to store your observability signals. Felix is also a passionate home barista and loves practicing latte art.
Articles

Use Elasticsearch as a Drop-In Prometheus Backend for Grafana
Use Elasticsearch as a Prometheus backend for Grafana dashboards, autocomplete, Metrics Drilldown, and alerting without changing PromQL workflows.

Don't leave metrics on the table: query them with the ES|QL TS command
Recalibrate your mental model for time series queries: learn why FROM can produce inaccurate results for metrics, how TS fixes that, and when to use each command.
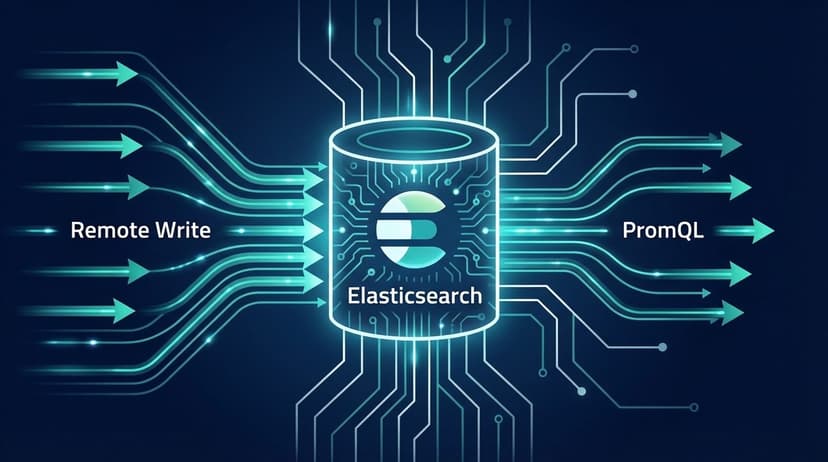
Bringing Fire to Elasticsearch: Adding Native Prometheus API Support
Query Elasticsearch directly from Prometheus-compatible clients via native PromQL, discovery, and metadata endpoints. Send data to Elasticsearch with Prometheus Remote Write.

30x faster than Prometheus: how we rebuilt Elasticsearch as a leading columnar metrics datastore
Elasticsearch now stores OTel metrics at 3.75 bytes per data point and queries them up to 30x faster than Prometheus. Here's how we rebuilt TSDS and ES|QL.

Query Prometheus Metrics in Elasticsearch with Native PromQL Support
Elasticsearch now supports PromQL natively as a first-class source command in ES|QL. Run familiar Prometheus queries on your time series data directly in Kibana.

Your PromQL queries now run in Kibana!
With PromQL now natively supported in Kibana, write and execute PromQL for analyzing metrics in Discover, in Dashboards visualizations, in alerting rules and wherever else ES|QL is supported. PromQL is currently available in Tech Preview for common metrics analytics use cases.

How Prometheus Remote Write Ingestion Works in Elasticsearch
A look under the hood at Elasticsearch's Prometheus Remote Write implementation: protobuf parsing, metric type inference, TSDS mapping, and data stream routing.

Ship Prometheus Metrics to Elasticsearch with Remote Write
Elasticsearch natively supports Prometheus Remote Write. Add a single remote_write block to your Prometheus config and use Elasticsearch as Prometheus-compatible long-term storage.

Improving the Elastic APM UI performance with continuous rollups and service metrics
We made significant improvements to the UI performance in Elastic APM to make it scale with even the most demanding workloads, by pre-aggregating metrics at the service level, and storing the metrics at different levels of granularity.

Simplifying log data management: Harness the power of flexible routing with Elastic
The reroute processor, available as of Elasticsearch 8.8, allows customizable rules for routing documents, such as logs, into data streams for better control of processing, retention, and permissions with examples that you can try on your own.