From alert to root cause in 3 minutes: automated root cause analysis with Elastic Agent Builder
Automated root cause analysis only works if the agent compares the incident window against the last healthy one. Skip that step and you get a summariser. The read-only skill, the scoped role and the Elastic Workflow are all here.
Bring your AI apps under the same lens as everything else. Explore LLM observability and instrument your apps with OpenTelemetry on Elastic. Start a free cloud trial to test it out yourself.
An alert fires on checkout latency. Three minutes and 22 seconds later there's an Elastic Observability case open with the root cause, the evidence behind it, and how confident the agent was. Nobody moved between Kibana, chat, tickets and a terminal to get there.
In this article, we'll build that loop end to end. We'll use Elastic Agent Builder to feed logs, traces, metrics, alerts, and runbook context into an agent that investigates a problem, and Elastic Workflows to execute the known next steps: opening a case, sending a notification, running an enrichment query, or triggering a remediation path.
We'll work through a checkout latency regression as our example, but the same pattern applies to any incident class where your team already knows the manual steps.
Prerequisites
- Elastic Cloud or self-managed cluster running 9.4+
We'll use a checkout latency regression as the running example. If you want to follow along against your own telemetry, point the queries at your service instead. If you'd rather reproduce the exact incident, the supporting notebook simulates it and sets up the role, skill, tool, and workflow for you.
Why dashboards are not enough for incident response
Dashboards show the symptom but cannot choose the next query. A dashboard is still one of the best tools for shared situational awareness, and during an incident the hard work starts after the chart turns red and the engineer still needs to answer a sequence of operational questions.
- What changed? You need access to related deploys, alerts, logs, traces, and metrics from the same time window.
- What is affected? You need visibility into services, hosts, users, regions, SLOs, and dependency paths.
- What is the likely cause? You need evidence from telemetry combined with runbooks or previous incident cases.
- What is safe to do next? You need a bounded action that includes proper permissions, an audit trail, and a rollback path.
That last question is where a dashboard stops. It can show the symptom, but it cannot decide which query to run next, which runbook applies, or which workflow should run. Engineers provide that judgment today by moving between Kibana, chat, tickets, terminals, and internal docs.
An SRE control plane keeps the judgment with the engineer while moving more context and more action into the same operational surface.
How automated root cause analysis works: state, policy and action
Automated root cause analysis needs three things in one place: the telemetry, the permissions that bound it, and the actions it can trigger.
- State: For SRE work, that state is telemetry in Elasticsearch: logs, traces, metrics, alerts, SLOs, and related operational records.
- Policy: Policy defines who can query which data, which tools an agent can call, which workflows can run, and where a human decision is required.
- Action: Action is a set of known tools and workflows that run with explicit inputs, permissions, and outputs.
Agent Builder is useful where the system needs reasoning over messy context, and Workflows are useful where the system needs deterministic execution.
The two can work in both directions; a workflow can call an agent with an ai.agent step when it needs analysis before the next step, and an agent can call a workflow through a workflow tool when a conversation needs a repeatable action.
What Elastic Agent Builder adds to AI incident response
Agent Builder skills are reusable capability packs. A skill can include instructions, tools, and context that guide an agent through a specific task.
Reusable skill packs matter for SRE work because incident response is rarely a single query. A good investigation has a shape, and root cause analysis is a good example. The useful unit is not "ask the model what happened." It's a repeatable investigation path that starts from an alert, scopes the time window, checks the right telemetry, records uncertainty, and hands a case or workflow a structured result. The agent needs to decide which signal to start from, query the right index, compare the right time windows, inspect related services, and explain the evidence without hiding what it doesn't know.
Elastic includes a built-in Elastic AI Agent for this pattern. Built-in skills are scoped by solution, so the one that carries an SRE incident loop is observability.investigation, alongside platform skills such as dashboard-management that any solution can use. The list shows the short name, so look for investigation in the UI.
The skill ships as Markdown instructions, the same format we use for our own skill in the next section.
There are also out-of-the-box tools such as platform.core.search, platform.core.get_document_by_id, platform.core.get_index_mapping, platform.core.list_indices, platform.core.get_workflow_execution_status, and platform.core.resume_workflow_execution.
Skills guide the work, tools perform bounded operations, and the agent chooses what to use based on the task.
The scenario: a checkout latency regression
Deployment 2026.07.09.1 ships a connection pool misconfiguration to checkout-api. Within minutes, p95 latency goes from 180ms to over 2s and HTTP 500s appear for the first time. Nobody knows yet that the pool is the cause.
The evidence is spread across three signals, and no single one answers the question:
| Signal | What it shows |
|---|---|
| Logs | PoolExhaustedException and HTTP 500s, only on the new version |
| Traces | The payment-gateway span goes from ~180ms to ~2500ms |
| Metrics | Connection pool pinned at 20 of 20 right after the deploy |
Correlating those three is the work we want the agent to do. That gives us the contract for the rest of this article:
| Contract | Detail |
|---|---|
| Input | Service name and the alert summary |
| Access | Read-only search over logs-*, traces-*, and metrics-* |
| Output | Likely cause, supporting evidence, confidence, and the next safe action |
| Side effect | One Observability case with the analysis attached |
Everything after this point builds one piece of that contract: the skill shapes the investigation, the tool and role bound the access, and the workflow turns the output into a case.
Build a read-only investigation skill in Elastic Agent Builder
Let's start with a read-only skill that improves investigation quality without touching production:
# Checkout latency investigation

Use this skill when an engineer asks why checkout latency, errors, or failed transactions increased.

Work through the investigation in this order:

1. Identify the affected service, environment, and time range.
2. Query traces for the slowest transactions in that window.
3. Query logs for errors from the same service and dependency path.
4. Compare current error and latency rates with the previous healthy window.
5. Return the likely cause, supporting evidence, confidence level, and the next safe action.

Do not recommend a production change unless there is a workflow tool assigned for that action.

If the evidence is incomplete, say what data is missing.
This kind of skill is a runbook execution guide, and it keeps the agent consistent across incidents. It also helps less experienced engineers ask better follow-up questions, because the agent can show the next query and explain why it matters.
Without step 4, the agent describes what's happening now and stops there. Comparing against the previous healthy window is what makes it an analysis. And the last line lets the agent say the data is missing instead of guessing.
Add AI agent observability tools with narrow permissions
Each tool should expose the smallest operation the agent needs, with the smallest data access that still supports the task.
For a read-only investigation agent, the required privileges usually start with searching observability data and inspecting index structure. The Agent Builder permissions documentation calls out that tools run against Elasticsearch data as the current user, and that read-oriented tools need index privileges such as read and view_index_metadata.
Run this in Dev Tools to create an investigation-scoped role:
POST /_security/role/agent-builder-observability-investigator
{
  "cluster": ["monitor_inference"],
  "indices": [
    {
      "names": ["logs-*", "metrics-*", "traces-*"],
      "privileges": ["read", "view_index_metadata"]
    }
  ],
  "applications": [
    {
      "application": "kibana-.kibana",
      "privileges": ["feature_agentBuilder.read", "feature_actions.read"],
      "resources": ["space:default"]
    }
  ]
}
This role gives the agent enough access to inspect telemetry while keeping production-changing actions out of scope. The monitor_inference cluster privilege is what lets the agent use the inference endpoints behind Agent Builder, and it grants no data access on its own.
When you add a custom tool, describe it in operational language, because the tool description is part of how the agent decides when to call it. Prefer descriptions like this:
Use this tool to search checkout service logs for errors in a bounded time range.

Required inputs:
- service_name
- environment
- start_time
- end_time

Return:
- matching log samples
- error counts by message
- affected host and pod names when present
A narrow tool description is much safer than a broad tool that says "search all logs for anything relevant." The agent gets a clear contract, and reviewers can reason about what the tool can and cannot do.
Use Elastic Workflows for incident response automation
Once the investigation path is useful, we can add Workflows for the actions that should be repeatable. With Workflows the control plane becomes operational because it can query more context, ask an agent to summarize evidence, open a case, notify a channel, or call a remediation endpoint. The key is that each step is explicit.
The Workflows editor gives you a validation loop before you save or run anything. Use it to catch syntax issues before the workflow writes to Cases or calls any action.
Go to Workflows > Create workflow and paste the following:
name: obs-labs-checkout-control-plane
description: Checkout regression investigation with Agent Builder and case creation.
tags: ["sre-control-plane", "agent-builder", "workflows"]

triggers:
  - type: manual

inputs:
  - name: service_name
    type: string
    default: "checkout-api"
  - name: alert_summary
    type: string
    default: "Checkout API p95 latency increased above 2s and HTTP 500s rose in the last 15 minutes after deployment 2026.07.09.1."

steps:
  - name: rca_analysis
    type: ai.agent
    agent-id: elastic-ai-agent
    create-conversation: true
    with:
      message: |
        Investigate this checkout incident as an SRE would.

        Service: {{ inputs.service_name }}
        Alert: {{ inputs.alert_summary }}

        Search the available logs, traces, and metrics for this service.
        Compare the window before and after the most recent deployment.

        Return a concise likely cause, supporting evidence, confidence, and next safe action.
        If the evidence is incomplete, say what data is missing.

  - name: case_title
    type: ai.agent
    agent-id: elastic-ai-agent
    with:
      conversation_id: "{{ steps.rca_analysis.output.conversation_id }}"
      message: "Produce a short case title for this incident. Output only the title."

  - name: case_description
    type: ai.agent
    agent-id: elastic-ai-agent
    with:
      conversation_id: "{{ steps.rca_analysis.output.conversation_id }}"
      message: "Produce a concise case description. Output only the description."

  - name: create_case
    type: cases.createCase
    with:
      title: "{{ steps.case_title.output.message }}"
      description: "{{ steps.case_description.output.message }}"
      owner: "observability"
      severity: "medium"
      tags: ["sre-control-plane", "agent-builder", "workflows"]

  - name: add_agent_analysis
    type: cases.addComment
    with:
      case_id: "{{ steps.create_case.output.case.id }}"
      comment: |
        ## Agent Builder RCA

        {{ steps.rca_analysis.output.message }}

        Agent conversation: {{ kibanaUrl }}/app/agent_builder/conversations/{{ steps.rca_analysis.output.conversation_id }}
Each step feeds the next one through its output. ai.agent steps emit a message with the model's text and a conversation_id, and cases.createCase emits the new case.id. Those three fields are the whole contract:
This workflow doesn't restart anything. It asks Agent Builder to investigate, reuses the same conversation to generate the case title and description, creates an Observability case, and writes the agent analysis back as a case comment.
Two details are worth calling out. The create-conversation: true flag on the first step is what makes the next two steps cheap: case_title and case_description pass the same conversation_id, so the agent already has the investigation in context and doesn't repeat the queries. And we use a manual trigger with a default alert_summary so you can run the sequence before attaching it to a live alert rule. In production, you'd switch the trigger to alert and attach the workflow to the rule that owns that incident class.
Run the workflow with the play button. Our run took 3 minutes and 22 seconds, with rca_analysis, case_title, case_description, create_case, and add_agent_analysis all marked as successful. Almost all of that is the investigation itself: rca_analysis alone took 3 minutes and 5 seconds, while the two case writes finished in about a second each.
The workflow then wrote an Observability case. The case list shows one open case with the generated checkout title, our tags, medium severity, and one comment.
The case detail is the audit artifact for the investigation. It records the evidence considered, the affected hosts and deployment version, the likely error type, the agent's confidence, and any missing signals.
A useful operational control plane surfaces the limits of its evidence instead of turning uncertainty into a confident claim. If your agent never reports missing data or a lower confidence, that's a signal to tighten the skill instructions, not a sign that every investigation went well.
The read-only automated root cause analysis pattern improves response quality without changing the affected service. Add remediation only when the action is well understood, narrowly scoped, and paired with verification and rollback: clearing one cache key, restarting one worker, shifting traffic away from one unhealthy instance, or running a pre-approved maintenance task.
Turn Elastic Workflows into agent tools
Workflow tools let an Agent Builder conversation trigger an Elastic Workflow and use its output. This is the bridge from "the agent recommended a next step" to "the agent can offer a known action."
A workflow tool should have a narrow description:
Use this tool only when checkout errors are caused by connection pool exhaustion on a single worker.

The workflow drains and recycles the connection pool for one worker, then verifies that the worker resumes successful requests.

Required input:
- host_name

Do not use this tool for database outages, deploy regressions affecting all hosts, or multi-host failures.
The description matters because it sets the agent's selection boundary. Note how the last line excludes the very scenario we just investigated: our incident hit both hosts and was caused by a deploy, so the agent should not offer this tool. That's the point. A workflow tool that matches every incident is a workflow tool with no boundary.
The workflow still owns execution. The agent doesn't need to know how to recycle the pool. It only needs to recognize when a known workflow may apply, collect the required input, and present the action to the engineer.
How do you stop an AI agent from changing production?
An SRE control plane should be built around blast-radius control, which means every action path needs a clear boundary. Use these checks before exposing a workflow as an agent tool:
| Check | Importance |
|---|---|
| Read-only first | Proves the investigation path before adding production action |
| Narrow input schema | Prevents vague prompts from becoming vague actions |
| Explicit permissions | Keeps the agent limited to the current user's allowed data and actions |
| Dry-run or case-only mode | Lets teams review outputs before enabling remediation |
| Human review for risky steps | Keeps judgment in the loop where impact is high |
| Post-action verification | Confirms that the workflow improved the service instead of only executing a command |
For the review boundary itself, Workflows gives you wait steps, timeouts, and execution history, so a risky path can pause for an approval and still leave an audit trail.
An agent can help gather evidence and propose the next step, but production action should stay inside known workflow paths.
Validate against one incident class first
For a real rollout, validate the control plane against one recurring incident class. Track whether the agent finds the right evidence, whether the workflow output is complete enough for review, and whether engineers trust the recommended next step.
Use a simple validation plan:
- Pick one alert type with a known runbook.
- Build a read-only investigation skill for that alert.
- Add one or two query tools with scoped index permissions.
- Run the agent against historical incidents and compare its summary with the actual case notes.
- Add a case-creation workflow and review the output with the owning SRE team.
- Only then consider a workflow tool that performs a bounded remediation step.
The main failure mode is not that the model gives an imperfect summary. It's granting broad action before the investigation path is proven. Keep the first version boring, scoped, and reviewable.
Conclusion
What we covered:
- An SRE control plane combines state (telemetry in Elasticsearch), policy (permissions and review boundaries), and action (known tools and workflows).
- Agent Builder handles reasoning over messy context, while Workflows handles deterministic execution, and the two can call each other.
- A read-only investigation skill turns a runbook into a repeatable investigation path that records uncertainty instead of hiding it.
- Scoped roles with
readandview_index_metadataonlogs-*,metrics-*, andtraces-*keep the agent useful without letting it change production. - Reusing a
conversation_idacrossai.agentsteps lets later steps build on the investigation instead of repeating it. - A case-only workflow gives you the full audit artifact before you enable any remediation.
- Tool descriptions are a security boundary, not documentation, because they decide when the agent offers an action.
Resources
How helpful was this content?
Related Content
Meet Elastic nightshift AI SRE, your always-on SRE coworker
Two dependencies and one config block: Spring Boot metrics to Elasticsearch over Prometheus remote write
Sleep through the 3am page: automated incident response with Elastic on Red Hat OpenShift
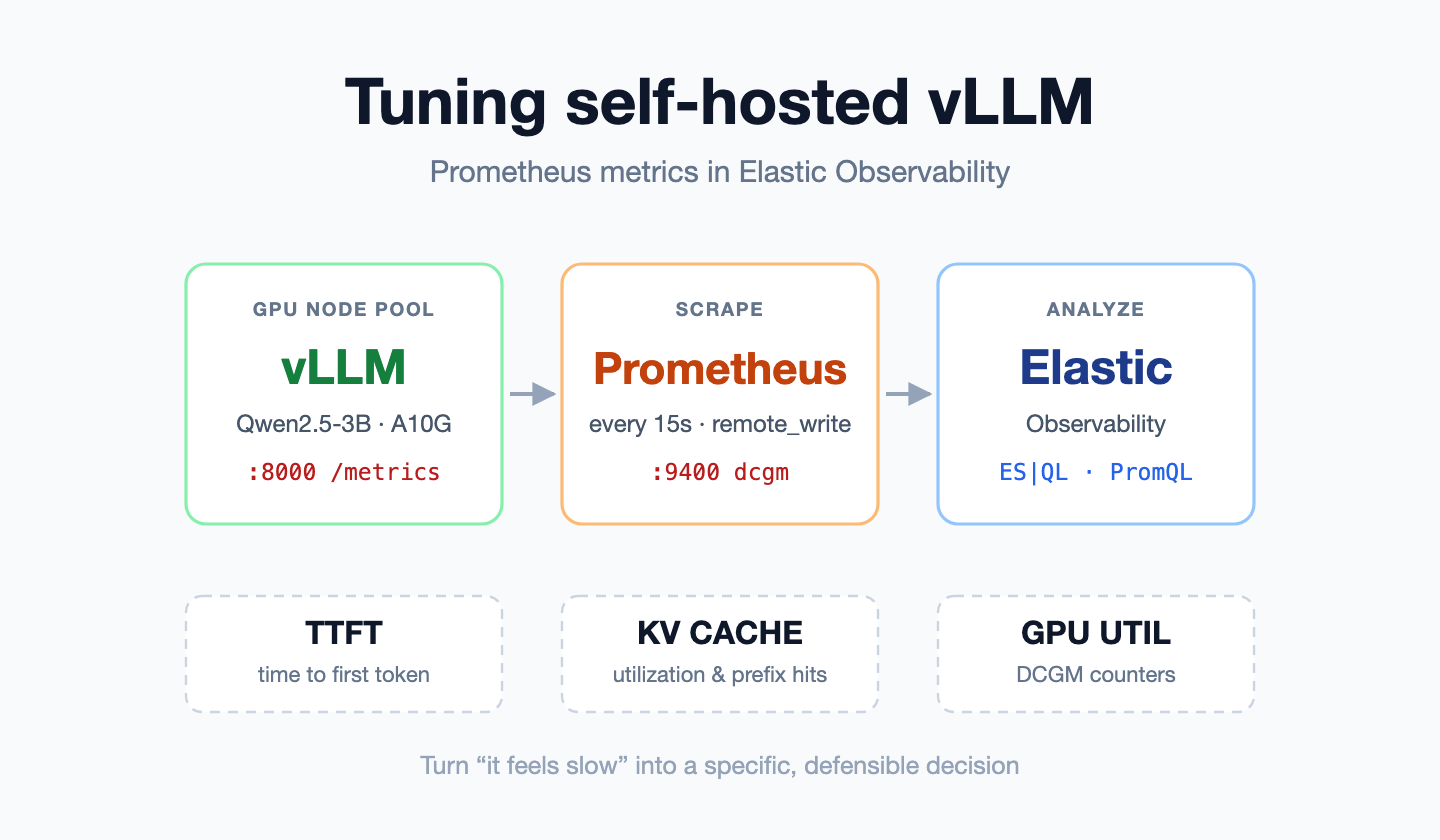
vLLM Prometheus metrics for self-hosted LLM tuning: TTFT, KV Cache, and GPU Utilization