

Cross-project search for Elastic Observability: one query across every linked project
Keep your observability data where it lives, and still search, alert, and monitor across every linked Serverless project, easily!
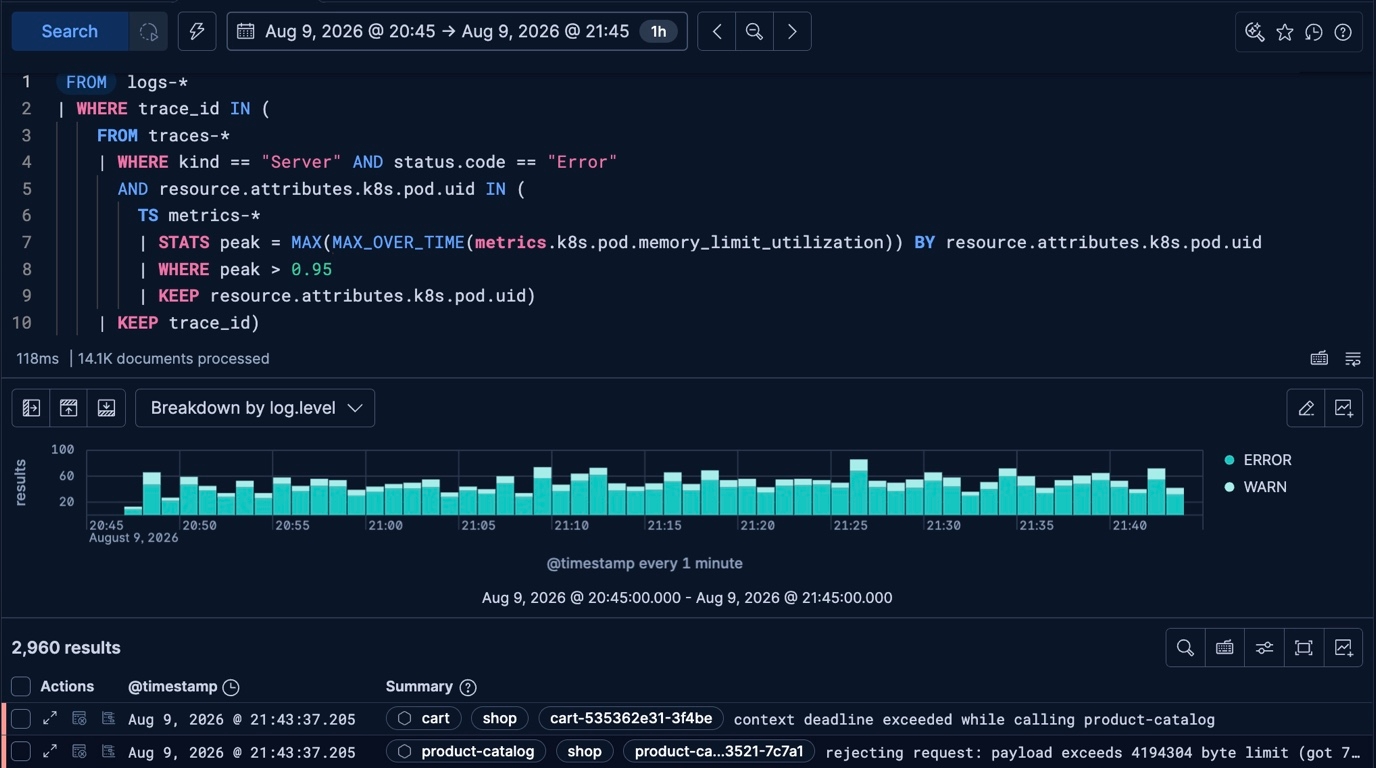
Correlate logs, metrics, and traces in one ES|QL query
Walk through four investigations, from CPU saturation to pod memory pressure, each answered by a single query across signal types.
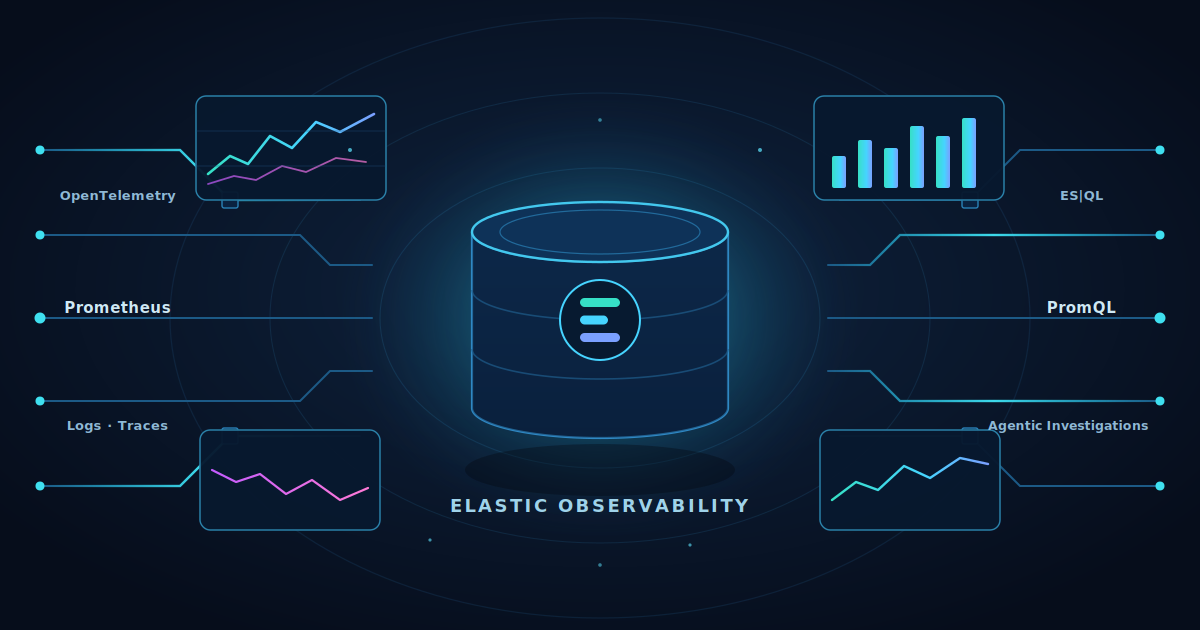
Elasticsearch: best-in-class for logs, now best-in-class for metrics
Elasticsearch is now best-in-class for metrics: 30× faster than Prometheus, up to 2.5× more storage-efficient, 50% less than Datadog. Learn about all the capabilities we’ve added.

Migrating Datadog and Grafana dashboards and alerts to Kibana with the Observability Migration Platform
Learn how to migrate supported Datadog and Grafana dashboards and alerts to Kibana with the Observability Migration Platform.
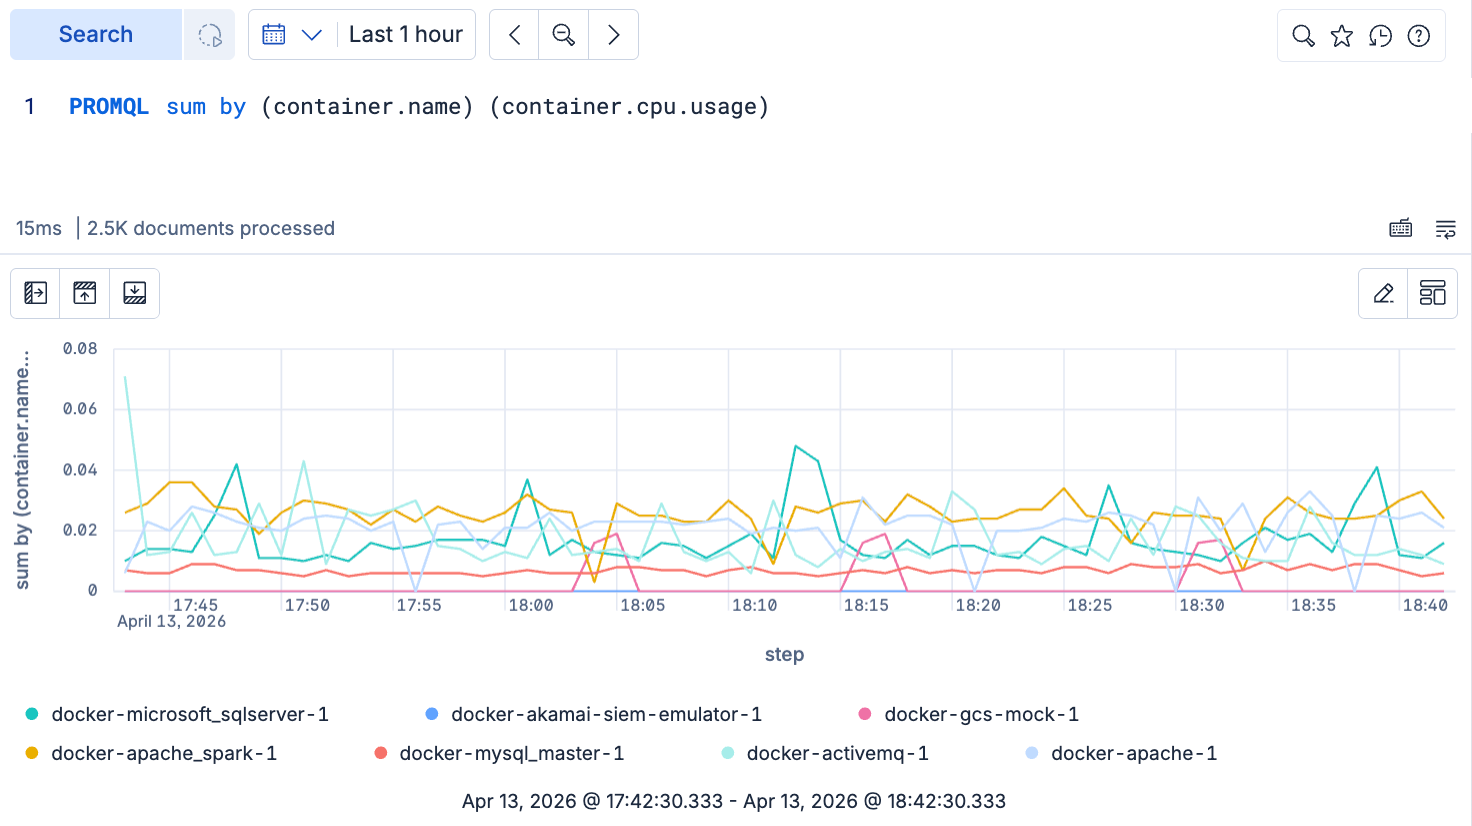
Your PromQL queries now run in Kibana!
With PromQL now natively supported in Kibana, write and execute PromQL for analyzing metrics in Discover, in Dashboards visualizations, in alerting rules and wherever else ES|QL is supported. PromQL is currently available in Tech Preview for common metrics analytics use cases.

Elastic's metrics analytics gets 5x faster
Explore Elastic's metrics analytics enhancements, including faster ES|QL queries, TSDS updates and OpenTelemetry exponential histogram support.

Explore and Analyze Metrics with Ease in Elastic Observability
The latest enhancements to ES|QL and Discover based metrics exploration unleash a potent set of tools for quick and effective metrics analytics.

LLM Observability: Azure OpenAI
We are excited to announce the general availability of the Azure OpenAI Integration that provides comprehensive Observability into the performance and usage of the Azure OpenAI Service!