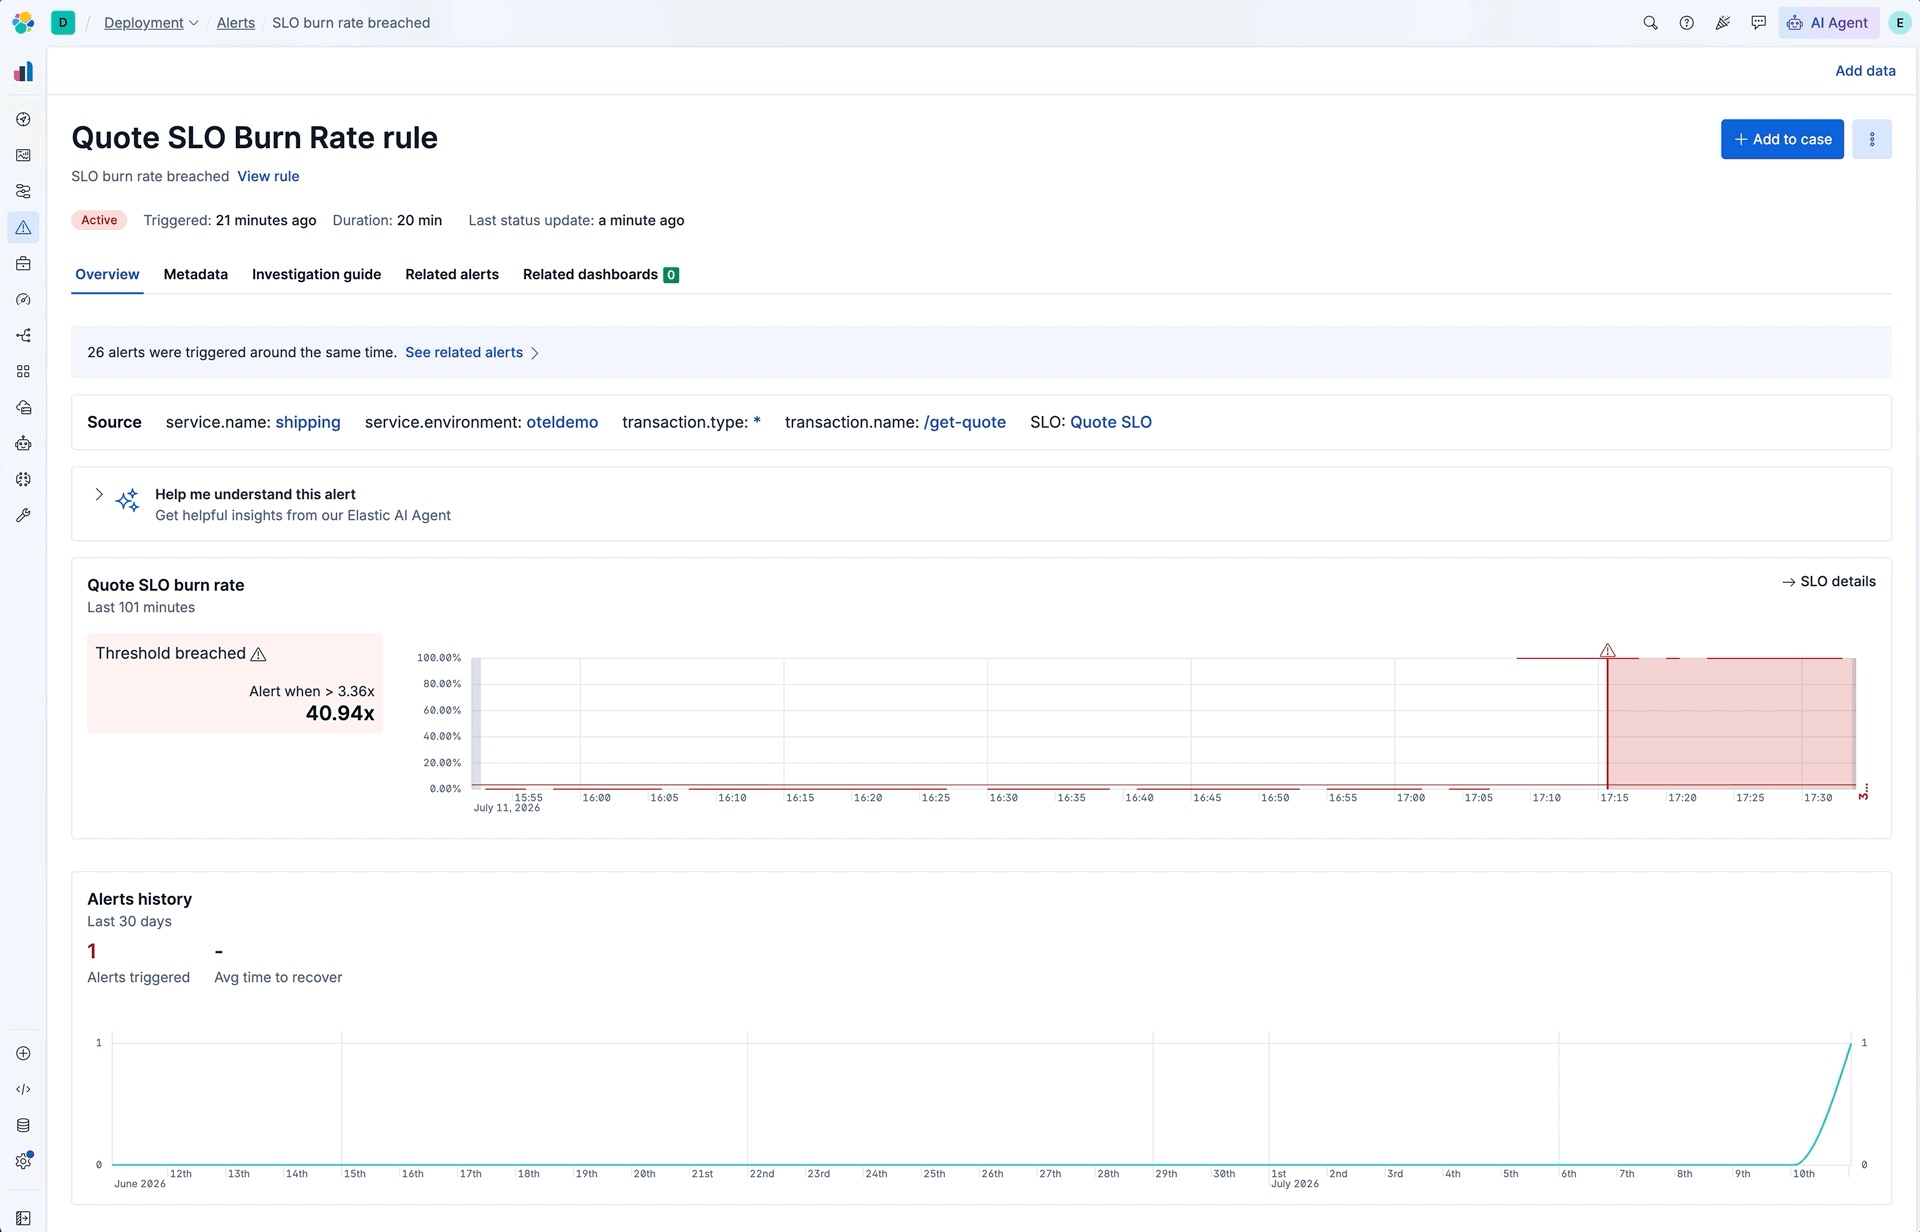
Your SLO is on fire; here's how to find the arsonist in Elastic Observability
When SLO alerting flags a burn rate spike, follow the SLI from the alert detail page through bad event spans and trace waterfalls to find the exact dependency burning your SLO error budget, all without leaving the investigation.
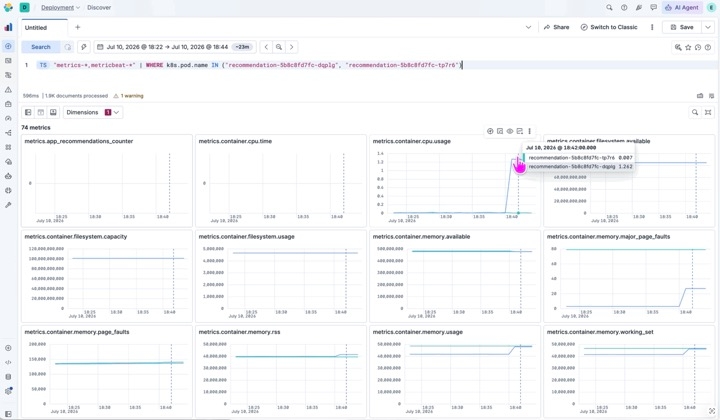
Four clicks from alert to root cause: how Elastic Observability links APM services to Kubernetes infrastructure
Check service dependencies and compare per-pod CPU, memory and network trends on the Infrastructure tab to find which instance is causing trouble, all without leaving the alert investigation.
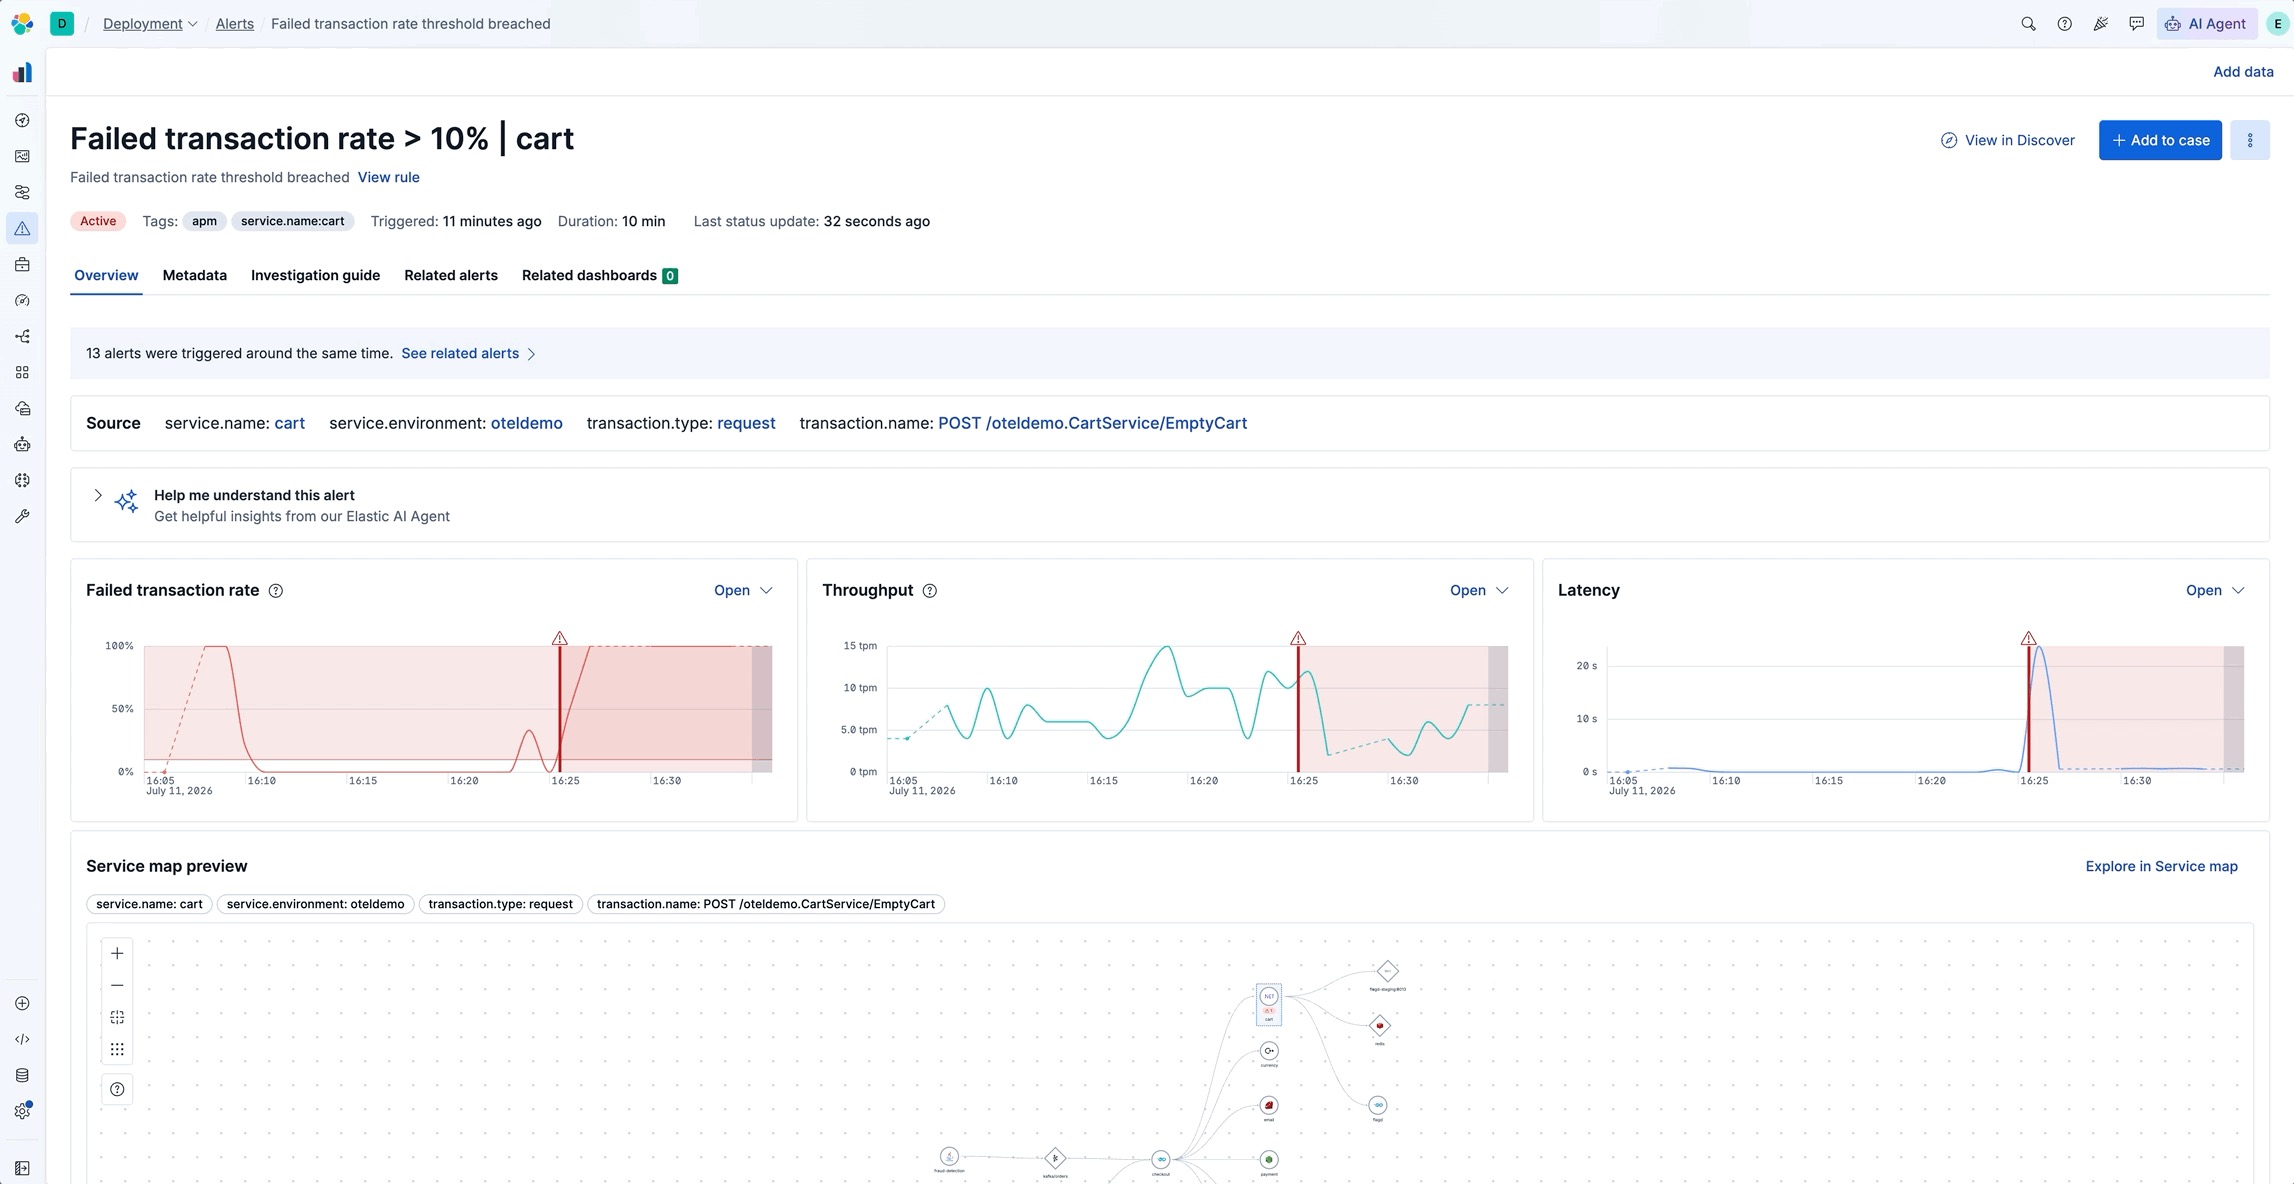
Three clicks from alert to error log: breaking down RED metrics by any span attribute in Elastic Observability
See which pod, deployment or version is driving a RED metrics change by breaking down span attributes in Discover, then trace a failing span to the error log behind it.
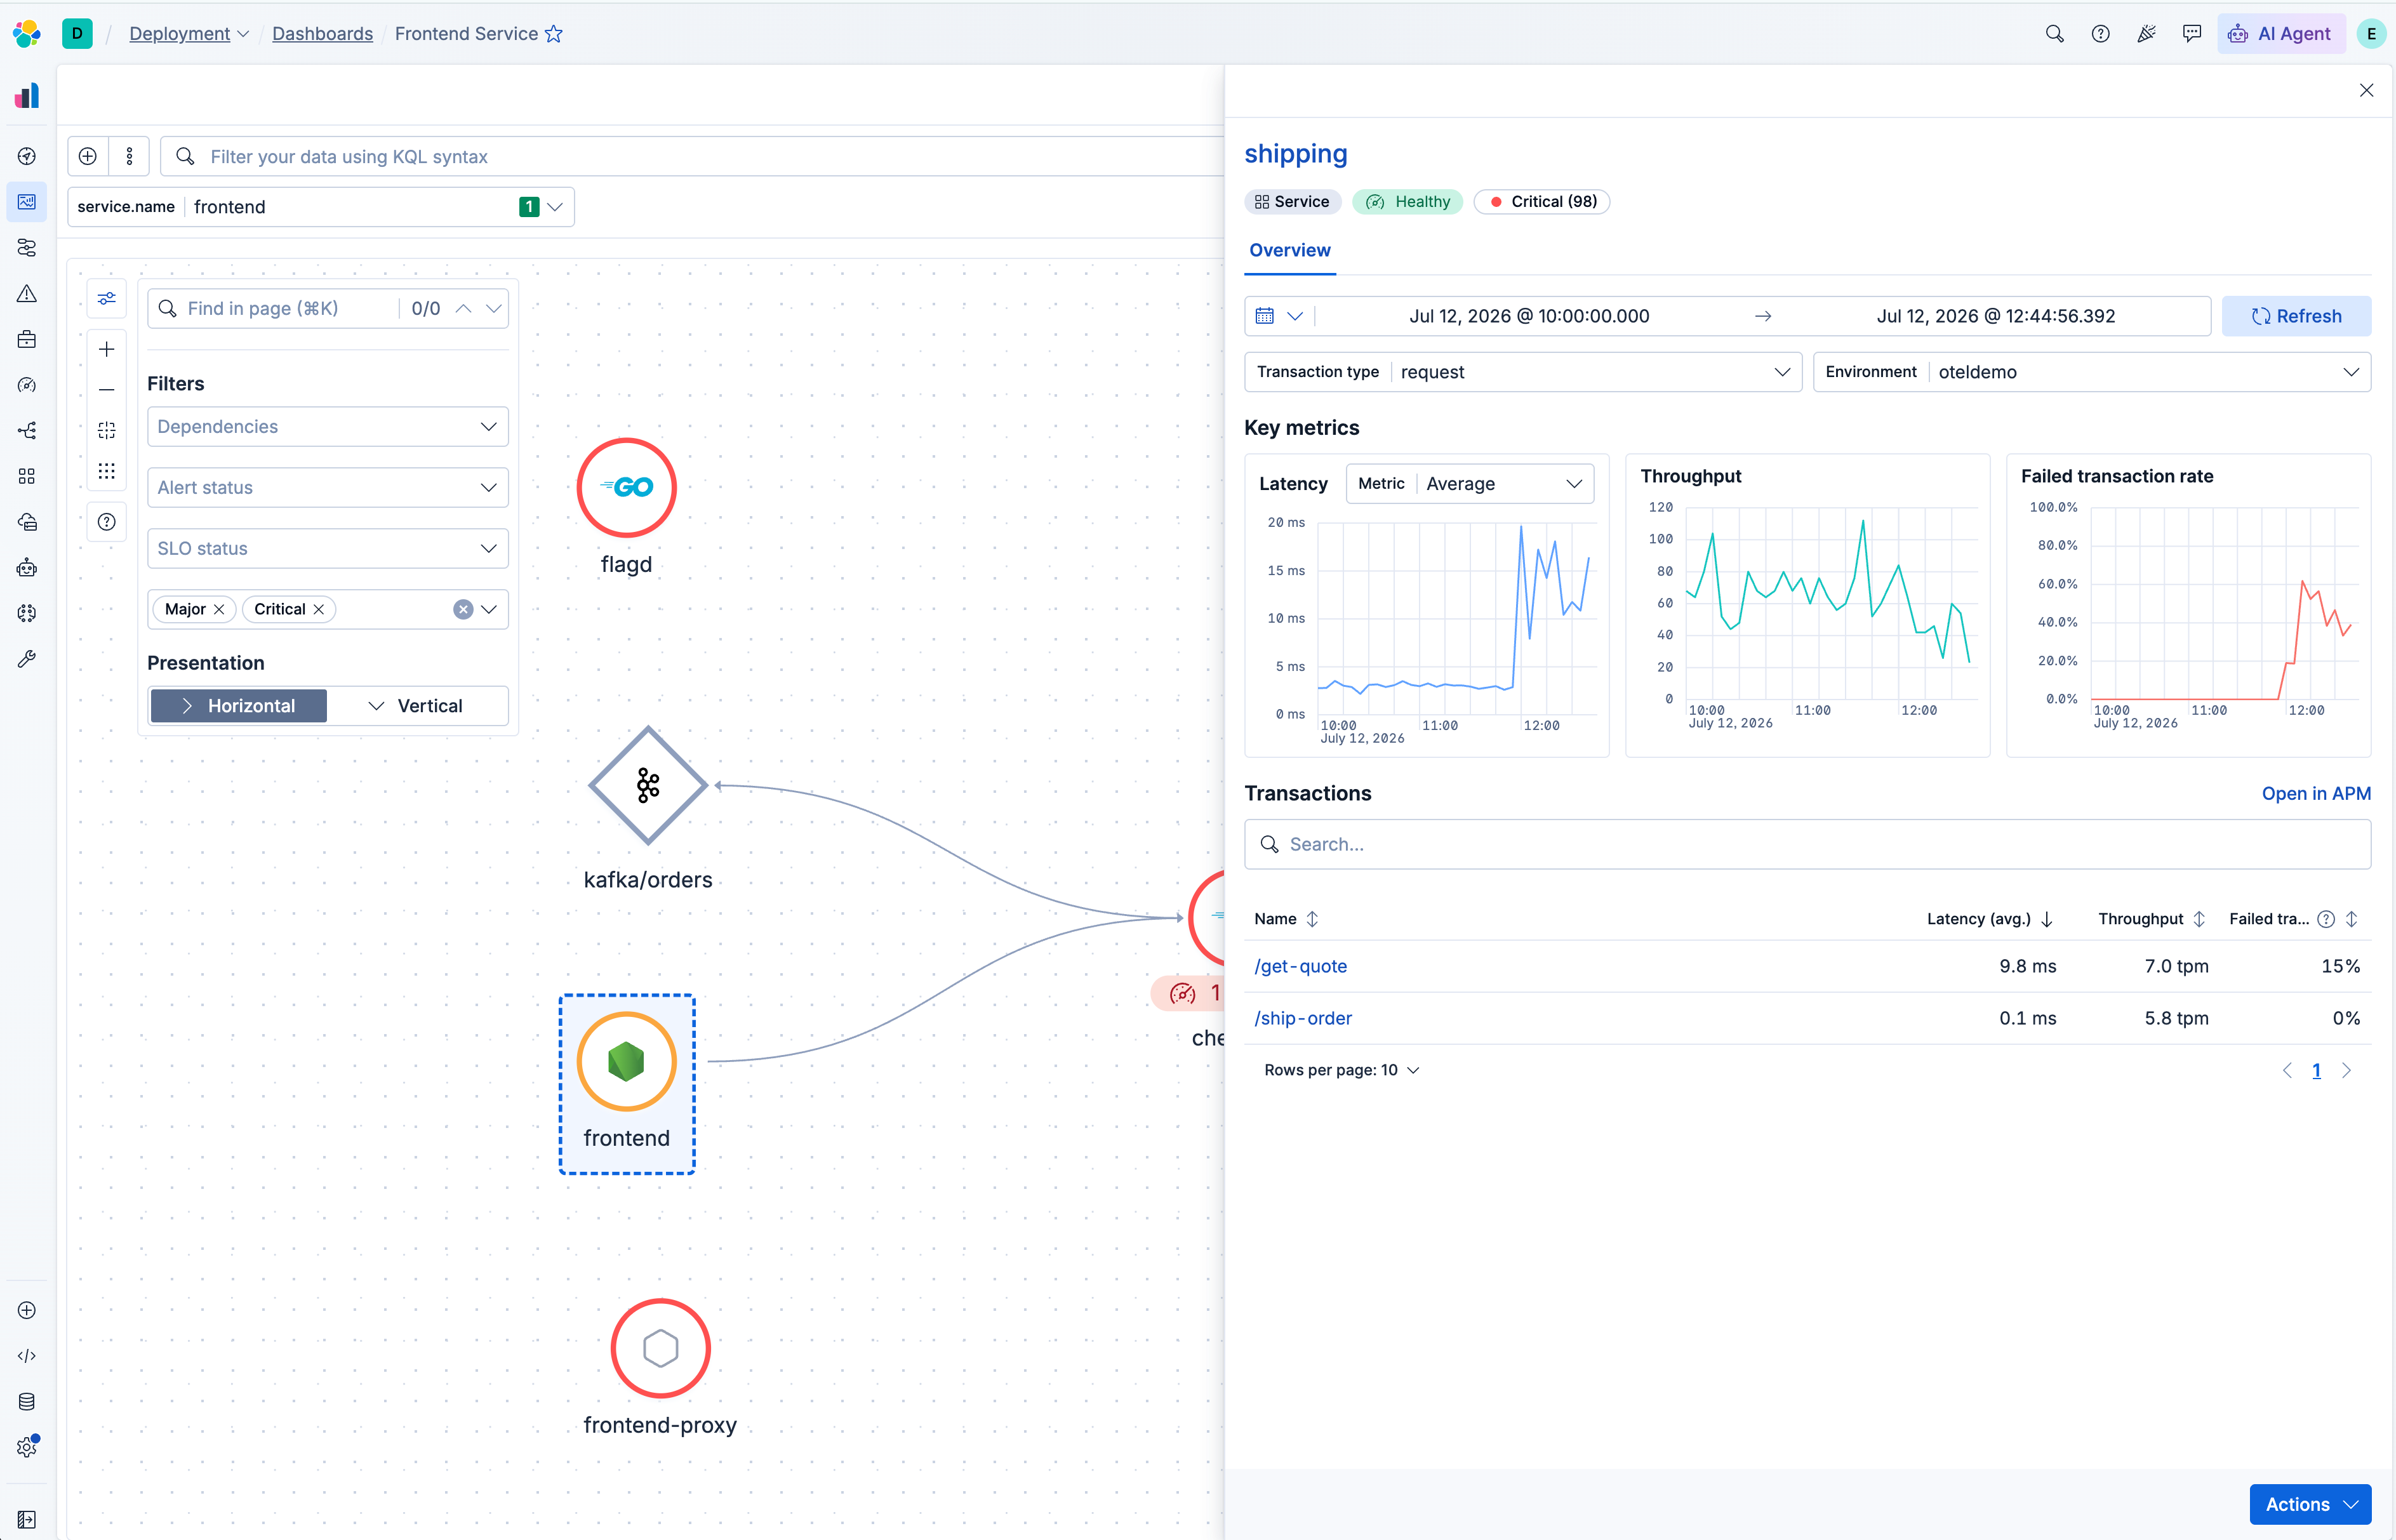
From alert to failing dependency in four clicks: Elastic APM's embedded service map
The APM service map is now embedded on alert pages with filters, connection metrics and a service fly-out so you can analyse dependencies and find the root cause without leaving the alert.