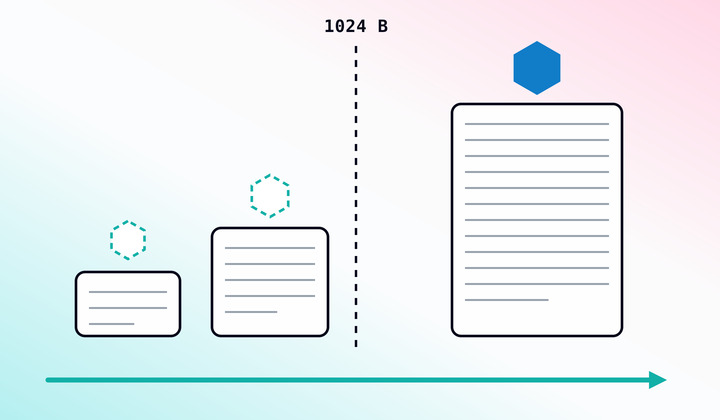
Not every log deserves 90 days: per-stream retention in Elastic Streams
AI Partitioning reads your data and proposes child streams. Retention, drops and downsampling then become per-stream settings, so the noisy ones expire on their own schedule.
Elasticsearch turns raw logs into structured, searchable data at ingest. Follow the collect and analyze logs tutorial to see it end-to-end. Start a free cloud trial or try Elastic on your local machine now.
Elastic Streams lets you set observability data retention per stream, so a payments API stream can keep 90 days while a notifications worker keeps 7. AI Partitioning reads the incoming firehose and proposes the child streams. Drops, retention and downsampling are then settings in the Streams UI, not routing rules you maintain somewhere else. Teams moving off a single 30-day policy typically cut 20–40% of log volume at ingest and downsample metrics after the first few days.
The controls work the same on Elastic Cloud Serverless, Elastic Cloud Hosted (ECH), and self-managed clusters. Elasticsearch uses dynamic mapping (schema-on-write with automatic type detection), so the same Streams controls apply to logs, metrics, traces, and any other signal you ingest over OpenTelemetry or native shippers, with no fixed schema required up front.
UI note (Stack 9.5+): the Streams Retention tab was renamed Data lifecycle. This article uses Data lifecycle for current GA. Screenshots captured on earlier builds may still show the old label; the controls themselves are unchanged. See Configure data lifecycle with Streams.
Why observability data storage costs get out of hand
Most teams start with one retention policy for everything. That is simple until:
- Debug logs from a load generator sit next to payment audit events in the same data stream.
- High-cardinality metrics keep growing while only a handful of dimensions matter after a week.
- Trace volume spikes during deploys, but you still pay to store every span at full resolution for 90 days.
The usual fixes (sampling everything globally, turning off logging, or maintaining brittle routing rules in ingest pipelines) trade away visibility for cost. Streams takes a different path: identify patterns first, then apply the right storage policy to each pattern.
Observability data retention controls in Elastic Streams
Streams sits on top of Elasticsearch data streams. Each stream gets its own Data lifecycle tab, processing pipeline, and (for wired streams) a place in a parent/child tree. That structure is what turns generic "reduce observability spend" goals into concrete settings you can audit.
Streams-native controls (configure these in the Streams UI):
| Control | What it does | Typical signal |
|---|---|---|
| Drop | Stop indexing matched documents before they hit storage | Noisy debug logs, health checks |
| Retention (DSL or ILM) | Delete or tier data after a defined age via the Data lifecycle tab | Short-lived app logs vs compliance logs |
| Downsample | Replace high-resolution metrics with fixed intervals (from Elastic 9.4) | Infrastructure metrics after 7 days |
Adjacent Elasticsearch capabilities that compound the savings (not separate Streams actions, but important for TCO):
| Capability | What it does | Typical signal |
|---|---|---|
| TSDS storage efficiency | Dimension-based routing, _tsid/@timestamp sorting, and synthetic _source improve compression; identical _tsid + timestamp data points are rejected | OTel or Prometheus metrics |
| Ingest processors / transforms | Processors reshape or drop individual documents before indexing; transforms pivot already-indexed data into summary destinations on a schedule | High-volume counters, enrichment |
| ILM tiering | Move older data to warm, cold, or frozen storage (exposed in Streams Data lifecycle on ECH/on-prem) | Long-lived logs and metrics |
On Elastic Cloud Serverless, you also benefit from storage optimizations built into the platform (for example, LogsDB index mode for logs and efficient TSDB storage for metrics). Streams helps you reduce what you store by routing and trimming data before Serverless bills reflect the volume.
On ECH and self-managed deployments, you get the full Elasticsearch lifecycle toolkit: ILM phases, data stream lifecycle (DSL), searchable snapshots, and downsampling. Streams exposes those policies in the UI so you are not hunting through JSON policy files.
Which control to use
Drop, retention and downsampling solve different problems, and the cost of each is paid at a different point.
| Control | What you still pay for | What you give up | Best fit |
|---|---|---|---|
| Drop | Nothing. Matched documents are never indexed. | The data, permanently. No reindex, no recovery. | Health checks, load generator output, debug namespaces |
| Retention (DSL) | Full storage until the age limit, then nothing. | Any query beyond the retention window. | Short-lived application logs, anything with a compliance floor |
| Retention (ILM tiering) | A lower cost per GB as data moves to warm, cold, or frozen. | Query speed on older data. Frozen needs searchable snapshots. | Long-lived logs and metrics on ECH or self-managed |
| Downsample | One data point per interval instead of every sample. | Resolution. Original samples are replaced, not kept alongside. | Infrastructure metrics and other high cardinality metrics after the first week |
Step 1: Find log patterns with AI Partitioning
You cannot right-size retention until you know what is in the firehose. Streams AI Partitioning analyzes incoming documents and proposes child streams based on field patterns, service names, log shapes, or plain-English instructions.
A common starting point is the wired logs.otel stream created when you send OpenTelemetry logs to the Managed OTLP endpoint. The same idea applies to metrics and traces wired streams as your deployment ingests them.
How to run AI Partitioning
- Open Observability > Streams and select a parent wired stream.
- Run AI Partitioning on a representative time range.
- Review suggested child streams (for example per team, service, or log level).
- Refine partitions in natural language if the first pass merges things you want separated.
- Apply partitions so each child stream inherits processing and retention from the parent, with per-child overrides.
Once partitioned, a payments API stream can keep 90 days while a notifications worker keeps 7. You set that in the UI instead of maintaining reroute processors in Logstash or the OTel Collector.
For a full walkthrough, see One OTLP endpoint, three teams, zero routing rules.
Step 2: Log filtering in Streams instead of your telemetry pipeline
Partitioning tells you who the data belongs to. Processing tells you what to keep.
In the Streams Processing tab you can:
- Add conditional blocks scoped to one child stream or log shape.
- Use AI-generated Grok patterns to parse samples instead of hand-writing regex.
- Add a drop processor for documents that should never be indexed.
This preview-first workflow matters for TCO. You inspect matched, parsed, and dropped samples before anything goes live. That is safer than a pipeline change that silently discards the wrong field.
Example: drop load-generator logs inside a Kubernetes containers stream while keeping application errors. The Kubernetes logs processing walkthrough shows the full flow with the Dropped tab preview.
Drops are the most direct control when the data has zero long-term value. You pay nothing to store what never gets indexed.
Step 3: Set log retention per stream in the Data lifecycle tab
After partitioning, open the Data lifecycle tab (formerly Retention prior to Stack 9.5) on each child stream.
You will see:
- Current storage size and projected ingestion rates.
- Lifecycle phase breakdown when ILM is active (hot, warm, cold, frozen).
- Options to switch between DSL (simple age-based retention) and ILM (tiered storage).
Wired streams support inheritance: set retention on a parent stream and let children inherit it, or override specific children that need longer or shorter lifetimes. Classic streams can follow existing index template policies while still giving you Streams visibility.
For DSL and ILM editing in the UI, see How Streams simplifies retention management and Configure data lifecycle with Streams.
Step 4: Downsample high cardinality metrics and roll up time series
Logs are often about retention length and drops. Metrics are often about resolution over time.
Starting in Elastic 9.4, you can configure downsampling directly in the Streams Data lifecycle tab for both ILM-backed and DSL-managed streams. Pick a phase, set a fixed_interval, and preview the timeline before you save.
Example ILM policy with hot and cold downsampling
{
  "phases": {
    "hot": {
      "min_age": "0ms",
      "actions": {
        "rollover": { "max_age": "1d" },
        "downsample": {
          "fixed_interval": "5m",
          "wait_timeout": "1d"
        }
      }
    },
    "cold": {
      "min_age": "4d",
      "actions": {
        "downsample": {
          "fixed_interval": "10m",
          "wait_timeout": "1d"
        }
      }
    },
    "delete": {
      "min_age": "30d",
      "actions": { "delete": {} }
    }
  }
}
How TSDS reduces metrics storage
Elasticsearch Time Series Data Streams (TSDS) cuts storage for OTel and Prometheus metrics through dimension-based routing (each time series lands on one shard), index sorting by _tsid and @timestamp that co-locates repeated values for better compression, and synthetic _source. TSDS also rejects duplicate data points with an identical _tsid and timestamp. Pair TSDS with downsampling for metrics that only need minute-level granularity after the first week.
See Configure downsampling directly in Elastic Streams for UI steps and shared-policy warnings.
Storage tiers by deployment type
Observability data retention on Elastic Cloud Serverless
Serverless removes cluster sizing work, but you still control what lands in storage. Streams partitioning, drops, and per-stream retention directly affect ingest volume and retention duration, which drives Serverless observability costs.
Platform-level optimizations (LogsDB for logs, columnar TSDB improvements for metrics) stack on top of the policies you set in Streams. You get efficient storage and intentional data lifecycle management.
If you only need log analytics at a lower price point, Logs Essentials on Serverless is another option. Streams TCO controls still apply when you need per-team retention on Complete.
Storage tiers on Elastic Cloud Hosted and self-managed
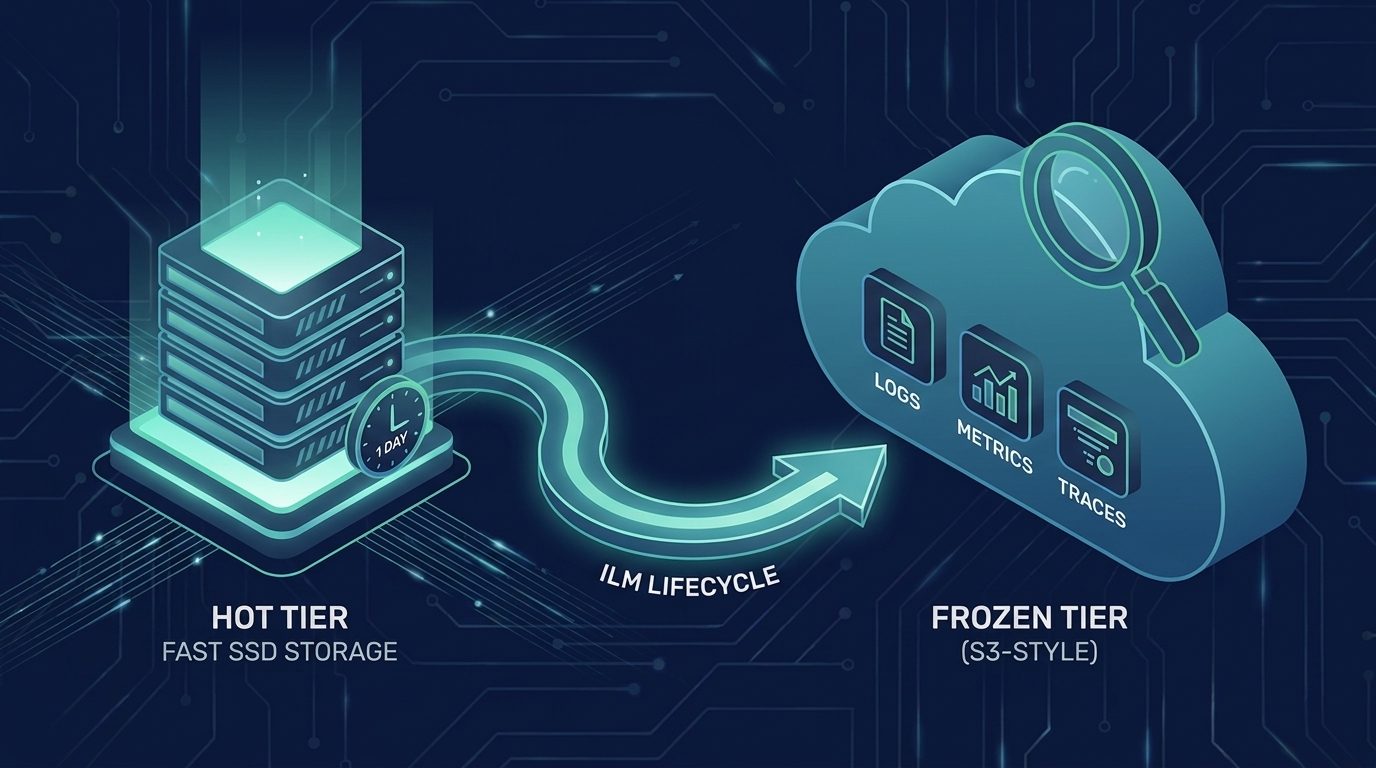
ECH and on-prem deployments add storage tiering: hot SSD, warm, cold, frozen, and searchable snapshots. ILM moves streams across tiers automatically. DSL offers a simpler delete-after-N-days model when you do not need tiering.
The same Streams UI and APIs apply. The difference is you also choose hardware profiles and snapshot repositories behind the policies.
How retention differs for logs, metrics and traces
Elasticsearch does not require a fixed schema at ingest. OpenTelemetry logs, metrics, and traces can land in wired streams, get partitioned by AI on whatever fields appear in your data, and pick up stream-specific retention.
That matters for TCO because observability signals are not isolated cost lines:
- Logs: drop noise, shorten retention on verbose services, keep audit trails longer.
- Metrics: use TSDS storage efficiency, downsample after incident windows pass.
- Traces: partition by service or environment, align retention with sampling policies.
You are not maintaining three different cost systems. You are applying the same Streams primitives to each signal type.
Suggested observability data retention workflow
- Ingest to wired streams (for example
logs.otel, metrics, or traces OTel endpoints). - Partition with AI so each team or service gets its own stream.
- Drop known noise (health checks, load tests, debug namespaces).
- Set retention per stream based on compliance and debugging needs.
- Downsample or tier metrics and high-volume logs on ECH/on-prem.
- Review the Data lifecycle tab monthly using ingestion graphs to catch drift.
How much storage can you actually save?
Exact savings depend on your workload. Teams that previously kept everything for 30 days often see the largest wins from:
- Dropping 20–40% of debug or duplicate logs at ingest.
- Shortening retention on high-volume, low-value streams.
- Downsampling metrics after the first few days.
Combine those controls with Elasticsearch storage modes (LogsDB, TSDS) for compounding effects. Measure before and after using the storage size metric on each stream's Data lifecycle tab and cluster-level _stats where you have access.
Try per-stream retention on one noisy stream
- Enable wired streams and send sample OTel data to
logs.otel. - Run AI Partitioning on a busy parent stream.
- Set one aggressive retention policy on a noisy child stream and compare storage after 48 hours.
- Read the Streams documentation for API options (
Upsert stream, ingest settings) when you want to automate policies in GitOps.
Observability TCO is not about collecting less data by default. It is about storing the right data for the right duration. Streams gives you the map, the scissors, and the dial.
How helpful was this content?
Related Content
The service with the most errors was healthy: root cause analysis from logs with ES|QL
14 alerts, 1 incident: Measuring alerting rule noise with ES|QL in Elasticsearch
Cross-project search for Elastic Observability: one query across every linked project