Cut log storage costs with two Elasticsearch data tiers instead of four
Elastic benchmarked one day of logs on SSD with everything older moved to frozen searchable snapshots, and it came out 16x cheaper than keeping all of it hot. The ILM policy and the cost model are both in the post.
Elasticsearch turns raw logs into structured, searchable data at ingest. Follow the collect and analyze logs tutorial to see it end-to-end. Start a free cloud trial or try Elastic on your local machine now.
For years, the standard Elastic storage story moved data through four tiers: hot, warm, cold, and frozen. Each step traded performance for cost. That model works, but at petabyte scale it adds operational overhead you do not need.
The simpler path is hot → frozen: one day on SSD for live troubleshooting, then Index Lifecycle Management (ILM) moves everything else to the frozen tier as searchable snapshots on blob storage. No warm tier. No cold tier. Frozen indices are partially mounted and read-only. You do not keep indexing into them. You do search them in Kibana and ES|QL, without a restore-then-query workflow.
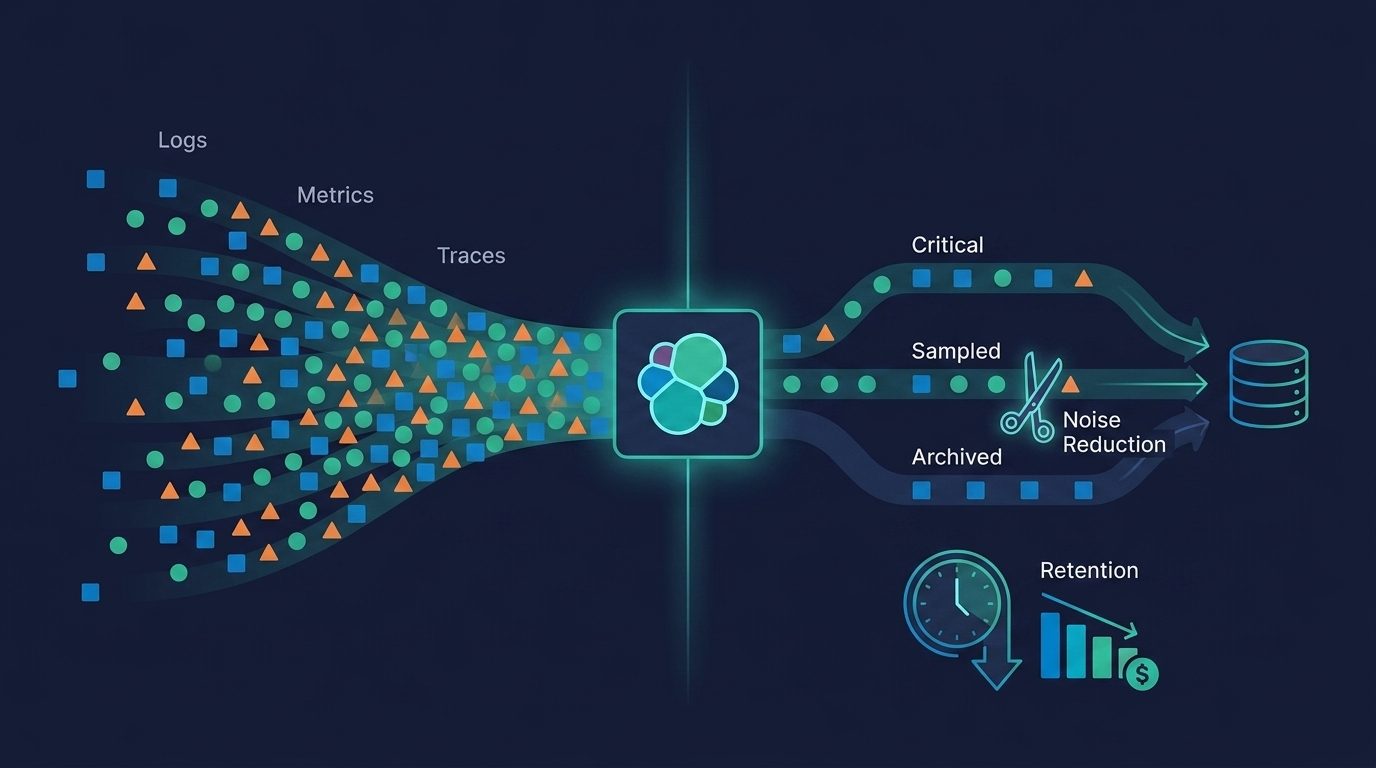
Elasticsearch maps fields dynamically at ingest, so you do not need a rigid schema before you send logs, metrics, traces, or security logs. The same two-tier ILM policy can cover those data streams. Layer Elastic Streams on top when you need per-stream processing, drops, aggregation, downsampling, or retention. For the companion cost walkthrough, see Not every log deserves 90 days: per-stream retention in Elastic Streams.
When four data tiers is more than log storage needs
Traditional Elastic Cloud Hosted deployments often follow a ladder like this:
Each transition requires ILM policy tuning, node sizing for warm and cold hardware profiles, and replica management across tiers. Frozen still depends on a snapshot repository, but you pass through warm and cold first.
At hundreds of terabytes or multiple petabytes per day, those middle tiers become expensive to operate and hard to explain to finance teams. You pay for spinning disks and replica shards on data that nobody queries at second-level latency anymore.
How hot-to-frozen log storage works
A two-tier hot/frozen architecture collapses the ladder:
| Phase | Storage | Purpose |
|---|---|---|
| Hot (1 day) | SSD, high IO | Active incidents, alerting, SLO burn rates, ongoing ingest |
| Frozen | Blob plus cache nodes | Audit, compliance, historical search (read-only searchable snapshots) |
After the first 24 hours, ILM converts indices to searchable snapshots on the found-snapshots repository that Elastic Cloud Hosted provisions against cloud object storage. Data stays queryable. You omit warm and cold entirely.
The hot-to-frozen pattern matches how Elastic documents large time-series Observability and Security deployments that do not require updates after ingest. New events continue to land on hot. Aged backing indices move to frozen.
Elastic benchmarked a related hot-frozen pattern on ECH with 105 TB of logs over 90 days. Frozen-tier Discover queries stayed within single-digit seconds at p99.9 for most tasks, and holding one day in hot plus the rest in frozen cost roughly 16x less than keeping the full dataset on hot nodes alone. See Measuring searchable snapshots performance.
What petabyte-scale log storage costs on Elastic Cloud Hosted
The figures below are an illustrative example based on a telco-scale workload model, not a quote or pricing commitment from Elastic. Your costs will vary with ingest volume, retention, query patterns, cloud region, hardware profile, and licensing tier. Use Elastic Cloud Hosted pricing and your account team for project-specific estimates.
How does Elastic Cloud Hosted pricing differ from Serverless?
Elastic Cloud Hosted (ECH) bills primarily on the memory footprint of the resources you run: hot and frozen tier node capacity (GB RAM-hour), plus snapshot storage and data transfer. Even with a two-tier hot-to-frozen ILM policy, you still size and pay for the Elasticsearch nodes and frozen cache tier that execute queries against blob-backed data.
Elastic Cloud Serverless bills on ingest volume and stored data, not provisioned cluster RAM. That model removes node sizing, capacity planning, and most lifecycle administration. You pay for what you send and what you keep.
This example models ECH only. Serverless is not included in the tables below because Observability Serverless does not yet support writing aged data out to S3 or blob storage for long-term frozen retention. When that capability ships, the same hot-to-blob pattern on Serverless should reduce administration further while keeping ingest-plus-storage pricing. Until then, ECH with hot-to-frozen ILM is the path for petabyte-scale audit and compliance on blob.
The example assumes 1-day hot, then ILM to blob (frozen searchable snapshots) for long-term retention. Treat the per-PB figures as a planning block for mixed telemetry, not as a claim that 1 PB of raw logs occupies the same disk as 1 PB of raw metrics. Time series data streams store metrics far more efficiently than a regular data stream. Calculations use published ECH capacity, snapshot storage, and data transfer rates with Enterprise licensing.
Log storage cost at 1 PB per day without Streams
At 1 PB/day ingest in this example, ECH alone is modeled at $178K/month ($2.14M/year) using published rates from elastic.co/pricing/cloud-hosted.
Scaling linearly:
| Daily ingest | ECH monthly | ECH annual |
|---|---|---|
| 1 PB/day | $178K | $2.14M |
| 2 PB/day | $357K | $4.28M |
| 3 PB/day | $535K | $6.42M |
| 4 PB/day | $713K | $8.56M |
| 5 PB/day | $891K | $10.70M |
| 6.5 PB/day | $1.16M | $13.90M |
| 8.45 PB/day | $1.51M | $18.07M |
Even without Streams optimization, the two-tier model is built for petabyte-per-day scale: short hot retention, blob-backed frozen search, and no warm or cold hardware profiles. Competitor TCO depends on ingest mix, retention length, and whether other vendors bill long-term searchability as premium hot storage. Compare published ECH rates to your current quotes rather than treating any single percentage as a universal saving.
How Elastic Streams cuts log retention costs by 28%
Adding Elastic Streams controls (drop, aggregate, downsample, retention) on top of the same hot-to-frozen ILM foundation reduces the example run rate by roughly 28%:
| Daily ingest | Streams optimized monthly | Streams optimized annual |
|---|---|---|
| 1 PB/day | $127K | $1.52M |
| 2 PB/day | $254K | $3.04M |
| 3 PB/day | $380K | $4.56M |
| 4 PB/day | $507K | $6.08M |
| 5 PB/day | $634K | $7.60M |
| 6.5 PB/day | $824K | $9.88M |
| 8.45 PB/day | $1.07M | $12.85M |
At 5 PB/day with 30% year-over-year growth, the three-year comparison looked like this:
| Year | Daily volume | ECH annual | Streams optimized annual |
|---|---|---|---|
| Year 1 | 5 PB/day | $10.70M | $7.60M |
| Year 2 | 6.5 PB/day | $13.90M | $9.88M |
| Year 3 | 8.45 PB/day | $18.07M | $12.85M |
In this example, that is $12.3M lower over three years with Streams optimization compared to ECH alone. Use that delta as a sensitivity check, then adjust for telemetry mix. Metrics in a TSDS, downsampled series, and verbose logs do not share one storage multiplier.
When Serverless adds blob-tier retention for observability data, rerun this comparison on Serverless pricing. Ingest-plus-storage billing plus zero node administration should make Serverless the simpler operational choice for long-retention workloads at scale.
ILM policy example: one day hot, frozen retention for compliance
On ECH, attach a policy that rolls daily on hot and transitions to frozen searchable snapshots. Omit warm, cold, and delete phases when audit requirements call for indefinite retention on blob.
PUT _ilm/policy/obs-hot-frozen
{
  "policy": {
    "phases": {
      "hot": {
        "min_age": "0ms",
        "actions": {
          "rollover": {
            "max_age": "1d",
            "max_primary_shard_size": "50gb"
          }
        }
      },
      "frozen": {
        "min_age": "1d",
        "actions": {
          "searchable_snapshot": {
            "snapshot_repository": "found-snapshots"
          }
        }
      }
    }
  }
}
The searchable_snapshot action in the frozen phase mounts a read-only, partially mounted snapshot (partial-*). Keep ingest on hot. Point historical Discover and ES|QL at frozen.
Apply the policy through index templates, Kibana Index Management, or the Streams Retention tab. Frozen tier nodes cache frequently queried blob regions locally. First access to a new time range may be slower; repeat queries hit cache and perform closer to hot-tier latency.
For regulated workloads, pair indefinite frozen retention with Streams AI Partitioning so compliance-heavy streams (payments audit, security events) inherit longer lifetimes while verbose debug streams get shorter DSL delete policies on child streams.
Why Elasticsearch data tiers work for petabyte-scale log storage
Among managed observability platforms, Elastic Cloud Hosted is the only option we are aware of that combines:
- Petabyte-scale telemetry ingest on one platform for logs, metrics, traces, security logs, and more.
- Two-tier ILM from hot to frozen without warm or cold hardware profiles.
- Searchable snapshots that query blob storage directly, with no rehydration step.
- Published-rate TCO modeling you can run against ECH pricing before you talk to finance.
Competing observability SaaS tools often charge premium rates for long hot retention, bill per telemetry type, or move aged data to archives that are not searchable with the same query tools you use for live incidents. At petabyte-per-day ingest, those pricing models widen the gap. Elastic built tiering into the search engine itself, which is why Discover, ES|QL, and APM views work across hot and frozen data transparently.
How to size hot and frozen nodes for petabyte-scale log storage
Exact node counts depend on daily ingest, query concurrency, and hardware profile. A practical starting ratio from Elastic benchmarks:
- Hot nodes sized for one day of ingest plus indexing headroom.
- Frozen cache nodes sized for concurrent query patterns, not total blob volume.
Before production rollout:
- Measure daily telemetry ingest (logs, metrics, traces, security logs).
- Pilot the one-day hot policy on a representative data stream.
- Run Discover and ES|QL queries against frozen data to validate cache sizing.
- Apply Streams drops and partitioning to reduce volume entering hot.
Keep alert evaluation and SLO burn-rate queries on hot. Plan incident workflows that start on the last 24 hours, then expand into frozen for historical context. Frozen queries can show higher latency on first access after cache eviction.
Searchable snapshots and the frozen tier require appropriate Elastic Cloud capabilities. Review Elastic Cloud pricing and your deployment tier before enabling frozen at scale.
How to move your log retention policy to hot-to-frozen
- Replace warm and cold phases with a hot-to-frozen ILM policy on observability data streams.
- Model TCO at your ingest rate using published ECH pricing, then add Streams optimization scenarios.
- Send OpenTelemetry telemetry to wired streams and apply Streams TCO controls.
- Read the searchable snapshots documentation and data tiers guide.
Petabyte observability does not require four storage tiers or choosing between cost and searchability. One day on hot, everything else in frozen searchable snapshots on blob, and Streams dials on top: that is how Elastic Cloud Hosted keeps full history queryable at a TCO finance teams can approve.
How helpful was this content?
Related Content

One ES|QL query, 365 days of audit logs: Same search on hot data and searchable snapshots
The service with the most errors was healthy: root cause analysis from logs with ES|QL
14 alerts, 1 incident: Measuring alerting rule noise with ES|QL in Elasticsearch