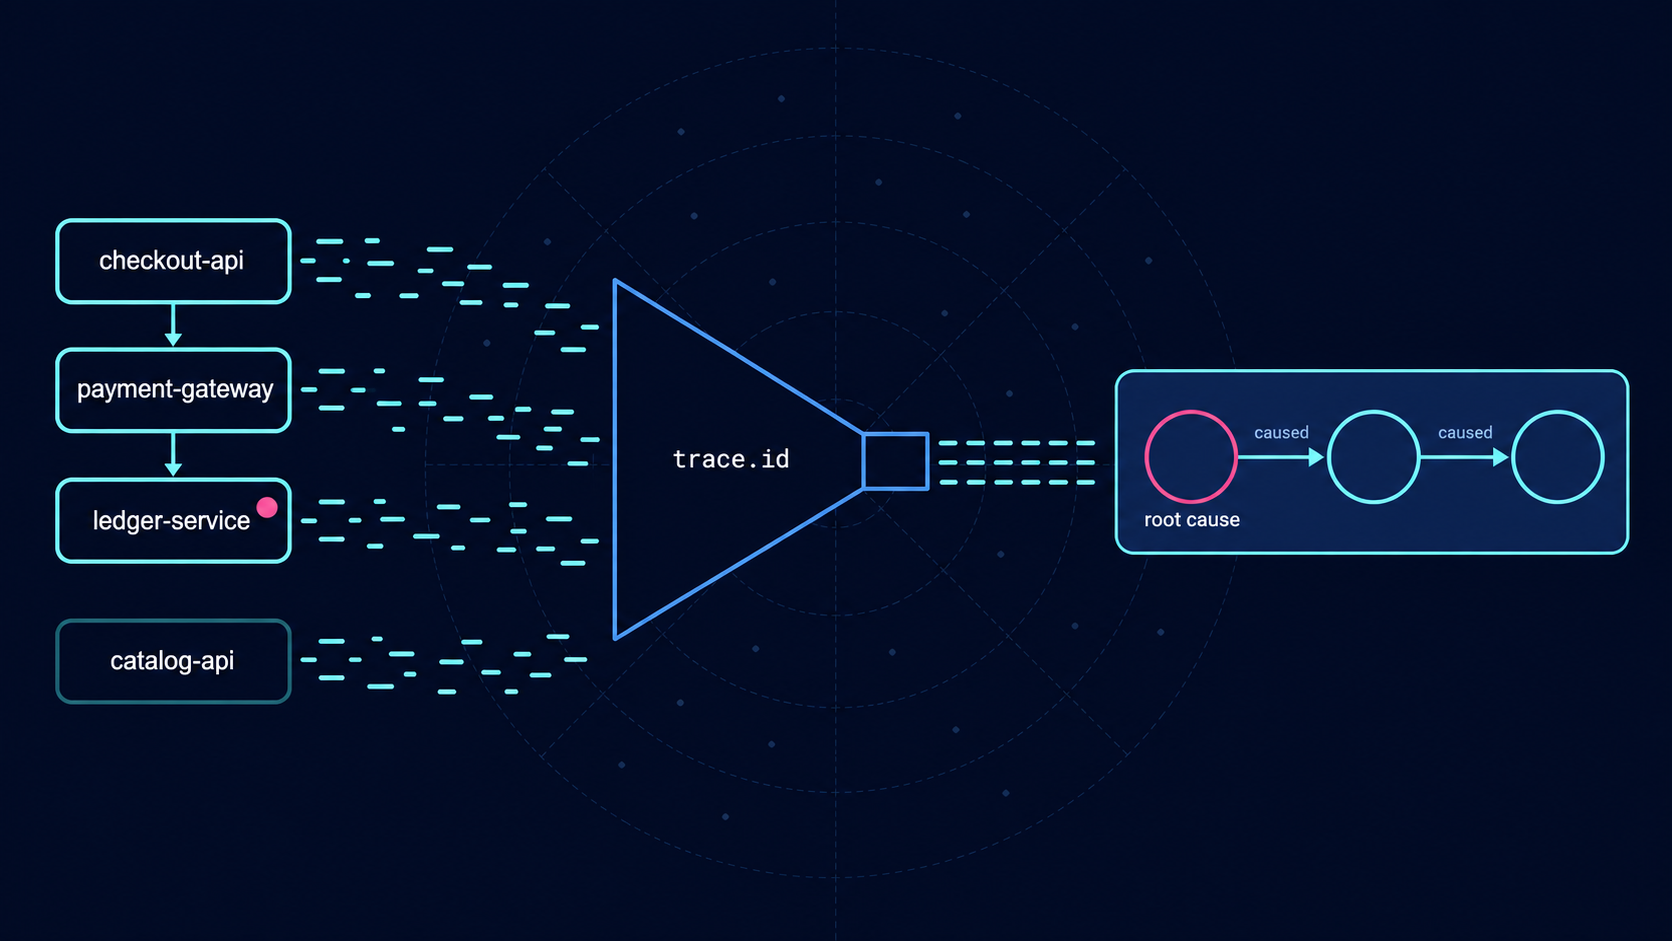
From a checkout alert to the failing span: Investigating with the Elastic AI Agent and Elastic APM flyouts
We didn’t take the agent’s root cause on trust. The service map and the trace backed it up, and one ES|QL query put a number on it: 80 of 138 gold-tier charges failed, and no other tier did.
Trace every request end-to-end with Elastic. Get hands-on with application performance monitoring, explore the APM docs, or start a free cloud trial today.
A checkout alert fired at a 25% failure rate, two services upstream of the root cause. The Elastic AI Agent read the alert and moved the problem off the front end. The payment service was rejecting card charges with “Invalid token,” which passed up through checkout as a failed order. So we looked into it.
Selecting payment on the agent’s service map opened the Elastic APM service flyout and then the failing transaction, the full trace, and the span that threw. The stack trace pointed at line 37 of charge.js. One Elasticsearch Query Language (ES|QL) query settled the part that the agent was unsure about: over 30 minutes, 80 of 138 gold-tier charges failed, and no other tier did.
In this blog post, we follow that investigation end to end on the OpenTelemetry (OTel) Demo and Elastic Observability 9.6.
The following diagram shows the three ways in. An alert or the full service map sends its context to the AI Agent, which answers with a service map of its own. Selecting a service there or a service.name value in Discover opens the service flyout.
Investigation flow in Elastic Observability 9.6: an alert, the service map, or Discover leads to the AI Agent and the Elastic APM flyouts, from service down to span.
Set up a payment fault in the OTel Demo
The OTel Demo is an online shop built from services written in many languages and instrumented with OTel SDKs. We ran Elastic's fork of the demo (version 2.2.1) against a local Elastic Stack 9.6 deployment. It sends its traces, metrics, and logs through the Elastic Agent 9.5.5 running in OpenTelemetry mode.
The demo ships with feature flags that inject faults, served by its feature flag service, flagd. We set the paymentFailure flag to 25%. The payment service then fails a quarter of its charge requests, and it marks every request it fails with app.loyalty.level=gold.
Shoppers don't see the payment service. They see orders that fail at checkout, so our alert watches checkout from the shopper's side: a failed transaction rate threshold rule on the front end's POST /api/checkout transaction that fires above 10% over five minutes. A few minutes after we turned on the flag, it fired with the reason "Failed transactions is 25% in the last 5 mins for service: frontend, type: request. Alert when > 10%."
Alert details for the checkout failures alert on the front end's POST /api/checkout transaction. Add to chat in the header opens the AI Agent with the alert attached.
How do you find the root cause of an Elastic APM alert?
This investigation ran in four steps, and each one checked the step before it.
1. Start with the alert in the Elastic AI Agent
The alert details page has an Add to chat button in its header. It opens the AI Agent with the alert attached and sends Investigate this alert for you. The agent retrieves the rule, status, reason, and related entities with your permissions, so you don't have to describe the problem at the outset.
A few seconds later, the agent had moved the problem off the front end: "Failed checkouts are not a frontend problem: the payment service is rejecting card charges with 'Invalid token', and the error passes up through checkout to the frontend." It found the same error in the payment, checkout, and frontend logs, and it noted that the three services had nearly the same failure rate, so payment failures accounted for almost all of the failed checkouts. The agent ran on Anthropic Claude Opus 5.5 through the Elastic Inference Service (EIS). Its answers vary between runs, so expect different wording and numbers on yours.
The AI Agent's findings next to the alert. The payment service rejects card charges with "Invalid token," and the error passes up through checkout to the front end.
The agent also listed what it wasn't sure about. Every error message that it sampled contained app.loyalty.level=gold, so it suggested that only one customer tier was affected, with medium confidence: "Every sample says gold. I haven't checked whether all gold-tier requests fail or only some." The next sections check that lead.
2. Check the AI Agent’s answer on the Elastic APM service map
We told the agent, Show me the service map for payment. It responded with the same interactive map that service pages show, centered on payment: checkout calls payment, and payment calls flagd. The map carries alert, Service Level Objective (SLO), and anomaly badges. It also records when it was captured (as "Topology as of") and links to the full map with Explore in Service map. Along with the map, the agent pointed out that "calls from checkout fail quickly, in about 2.3ms on average. Requests are being rejected right away rather than timing out."
The AI Agent answers "Show me the service map for payment" with an interactive service map. Checkout calls payment, and payment calls flagd.
Selecting payment on that map opens its service flyout next to the conversation, with the service's latency and failed transaction rate, along with throughput. The failed transaction rate chart jumps when the fault starts, which confirms what the agent said without leaving the conversation.
Payment service flyout opened from the agent's map, with latency, failed transaction rate, and throughput. The failed transaction rate jumps when the fault starts.
3. Drill from the service flyout to the failing span
The service flyout lists payment transactions. Selecting grpc.oteldemo.PaymentService/Charge opens the transaction flyout on top of it, with the transaction's metrics, a latency distribution that shows failed transactions separately, and trace samples. A failed sample shows an Error badge on the charge.
Transaction flyout for grpc.oteldemo.PaymentService/Charge. The latency distribution shows failed transactions separately, and a failed trace sample has an Error badge.
Selecting the transaction in the sample's timeline opens the full trace. It follows one order from the load generator through frontend-proxy and frontend to checkout, which calls cart, product catalog, currency, shipping, and finally payment. Every span on the path from the load generator's POST request down to payment's charge span is marked as a failure, and checkout's call to payment failed after 3.3 ms.
Full trace of one failed order, from the load generator through front end and checkout to payment's charge span. Every span on that path is marked as a failure.
Selecting payment's charge span opens its document. The Errors section shows the cause: "Payment request failed. Invalid token. app.loyalty.level=gold." View error opens the exception itself, with a stack trace that points at line 37 of the payment service's charge.js.
Span document for payment's charge span. The Errors section shows "Payment request failed. Invalid token. app.loyalty.level=gold."
The exception behind the failed charge, with a stack trace that points at line 37 of the payment service's charge.js.
Following are the four flyouts and what each one gives you:
Fyout | Opens from | Shows | Drills to |
|---|---|---|---|
Service | The AI Agent’s map, the service map, or a service name in Discover | Latency, failed transaction rate, throughput, transactions list | Transaction |
Transaction | Selecting a transaction in the service flyout | Transaction metrics, latency distribution with failures separated, trace samples | Trace |
Trace | Selecting a transaction in a sample’s timeline | The full span timeline across every service on the path | Span |
Span | Selecting a span in the trace | The span document, including the Errors section and View error | Exception and stack trace |
Back returns you through the trace, the transaction, and the service, one flyout at a time. The flyouts keep the service's environment and time range as you go. If you change the environment on the service flyout, the transaction flyout follows it when the transaction exists there. If you change the transaction type or choose an environment without that transaction, the transaction flyout keeps the previous data and shows a warning.
4. Confirm the root cause with one ES|QL query
The trace explains one failed order. The agent's open question was about all of them: do only gold-tier customers fail, and do all of them fail? One ES|QL query over payment's charge spans answers it. We ran it in Discover, where the time picker sets the time range:
FROM traces-*
| WHERE service.name == "payment" AND span.name == "charge"
| STATS charges = COUNT(*), failed = COUNT(CASE(event.outcome == "failure", 1, null))
    BY attributes.app.loyalty.level
| EVAL failure_rate = ROUND(failed * 100.0 / charges, 1)
| SORT failure_rate DESC
Over the last 30 minutes, 80 of 138 gold-tier charges failed, and none of the platinum, silver, or bronze charges did. The agent's lead holds. Only gold-tier customers are affected, but not every gold-tier charge fails. In this demo, the answer is built in, because the fault marks the requests it fails as gold. On real services, the same query is how you tell a pattern apart from a coincidence before you act on it. The attributes. prefix is where Elastic Agent stores OTel span attributes, so data from Elastic APM agents needs different field names.
An ES|QL query in Discover groups payment charges by loyalty level. Eighty of 138 gold-tier charges failed, and no other tier had failures.
Two other 9.6 changes help when you reach a failing service without an alert.
View service dependencies on the Service map panel
The service overview and transaction details pages, including those for mobile services, now include a Service map panel. On the payment service overview, it shows checkout as the caller that depends on payment and flagd as the service payment calls. Hops sets how many connections to follow (1 by default), and Max visible caps the number of nodes (8 by default). The small defaults keep the panel readable when a service has many dependencies.
Service map panel on the payment service overview. Checkout depends on payment, and payment calls flagd. Hops and Max visible control how much of the map it shows.
Explore in Service map opens the full map with the time range, environment, and Kibana Query Language (KQL) query preserved and with the service selected. On the full map, you can select several services at once in the service.name control of the search bar, for example, checkout and payment, and the map highlights both with their connections. When you copy the map to a dashboard, the panel keeps those highlights and filters, and View in Service map on the panel brings them back.
The panel replaces the per-service Service map tab.
Start an investigation from the Service map page or Discover
If there's no alert yet, start from the full Service map page. Investigate map in the toolbar sends the current view to the AI Agent: the time range, environment, KQL query, service group, and highlighted services.
The agent surveys every service in that view and orders what it finds by severity:
Active alerts.
Violated or degrading SLOs.
Machine learning anomalies.
Unusual error rates or latency.
On our map, it reached the same conclusion without the alert as a starting point: "The main problem is that payment is rejecting charges for gold-tier loyalty customers."
Investigate map on the full Service map page sends the current view to the AI Agent. The agent finds that payment is rejecting charges for gold-tier customers.
If you're already in Discover, the same flyout stack is one click away. Open a trace document, and select the service name in its Overview tab. That opens the service flyout, and the transaction, trace, and span flyouts follow from there. The service flyout opens with the document's environment and the time range you set in Discover.
A failed payment span in Discover with its Overview tab open. Selecting the service name, payment, opens the service flyout.
Clicking service.name on a failed payment span in Discover opens the payment service flyout, with the document's environment and the Discover time range.
Current limitations of the Elastic APM flyouts and Investigate map
Services with unprocessed OTel data, for example, data sent straight from a contrib Collector, show key metrics in the service flyout, with Error rate in place of Failed transaction rate, but no Transactions table, so the transaction drilldown is unavailable. You can still open their spans from the document's expanded trace timeline in Discover.
Investigate map action is available on the full Service map page only. Maps embedded in alert details and dashboards don't show it.
Investigate map sends, at most, 50 highlighted services to the agent.
The service flyout opened from Discover doesn't inherit the Discover query or filter pills.
Service map connections for gRPC calls that use the current remote procedure call (RPC) semantic conventions (
rpc.system.name) need EDOT Collector 9.3.3 or later, or Elastic Agent 9.5 or later in OpenTelemetry mode. With EDOT Collector 9.3.0, the map didn't connect checkout to payment.
Requirements: Elastic Stack version, license, and privileges
These features need the following.
Version: Elastic Stack 9.6 or later, or Elastic Observability Serverless.
License: Enterprise on the Elastic Stack, or the Observability Complete feature tier on Elastic Observability Serverless.
Model: The AI Agent needs a model, through EIS or a generative AI (GenAI) connector.
Role privilege: Users need the AI Agent privilege in their role, listed as Agent Builder, to see Add to chat and Investigate map.
Advanced setting: Chat Experience must be set to Agent, which is the default in 9.6. (Deployments that chose the AI Assistant earlier keep that choice.)
Availability: The investigation flyouts are generally available (GA). The rest of the traces experience in Discover remains in technical preview.
Run this investigation on your own services
Pick a service that alerted recently, and open the alert. Then select Add to chat. When the agent answers, select a service on its map and follow the flyouts down to a span. The docs cover each piece:
To share feedback, reach out through the Elastic community forums or open an issue in the Kibana repository.
Frequently Asked Questions
Can the Elastic AI Agent investigate an Elastic APM alert?
Yes. Add to chat on an alert details page opens the AI Agent with the alert attached and starts the investigation. The agent can answer with an interactive service map, and each node opens the service's flyout so you can check its conclusion against the trace data.
Can I investigate a trace from Discover without switching to the Elastic APM app?
Yes. Open a trace document in Discover, and select the service name in its Overview tab to open the service flyout. From there, you can open a transaction, the full trace, and a single span or error in a stack of flyouts with Back navigation.
How helpful was this content?
Related Content

Three regions, three Kibanas, one view: Cross-cluster search comes to Elastic Synthetics

How we moved the OpenTelemetry Java agent to invokedynamic in 70+ pull requests

YAML meets IConfiguration: Declarative configuration for the OpenTelemetry .NET SDK
Your trace stops at the span; continuous profiling with OpenTelemetry doesn’t