Response actions history
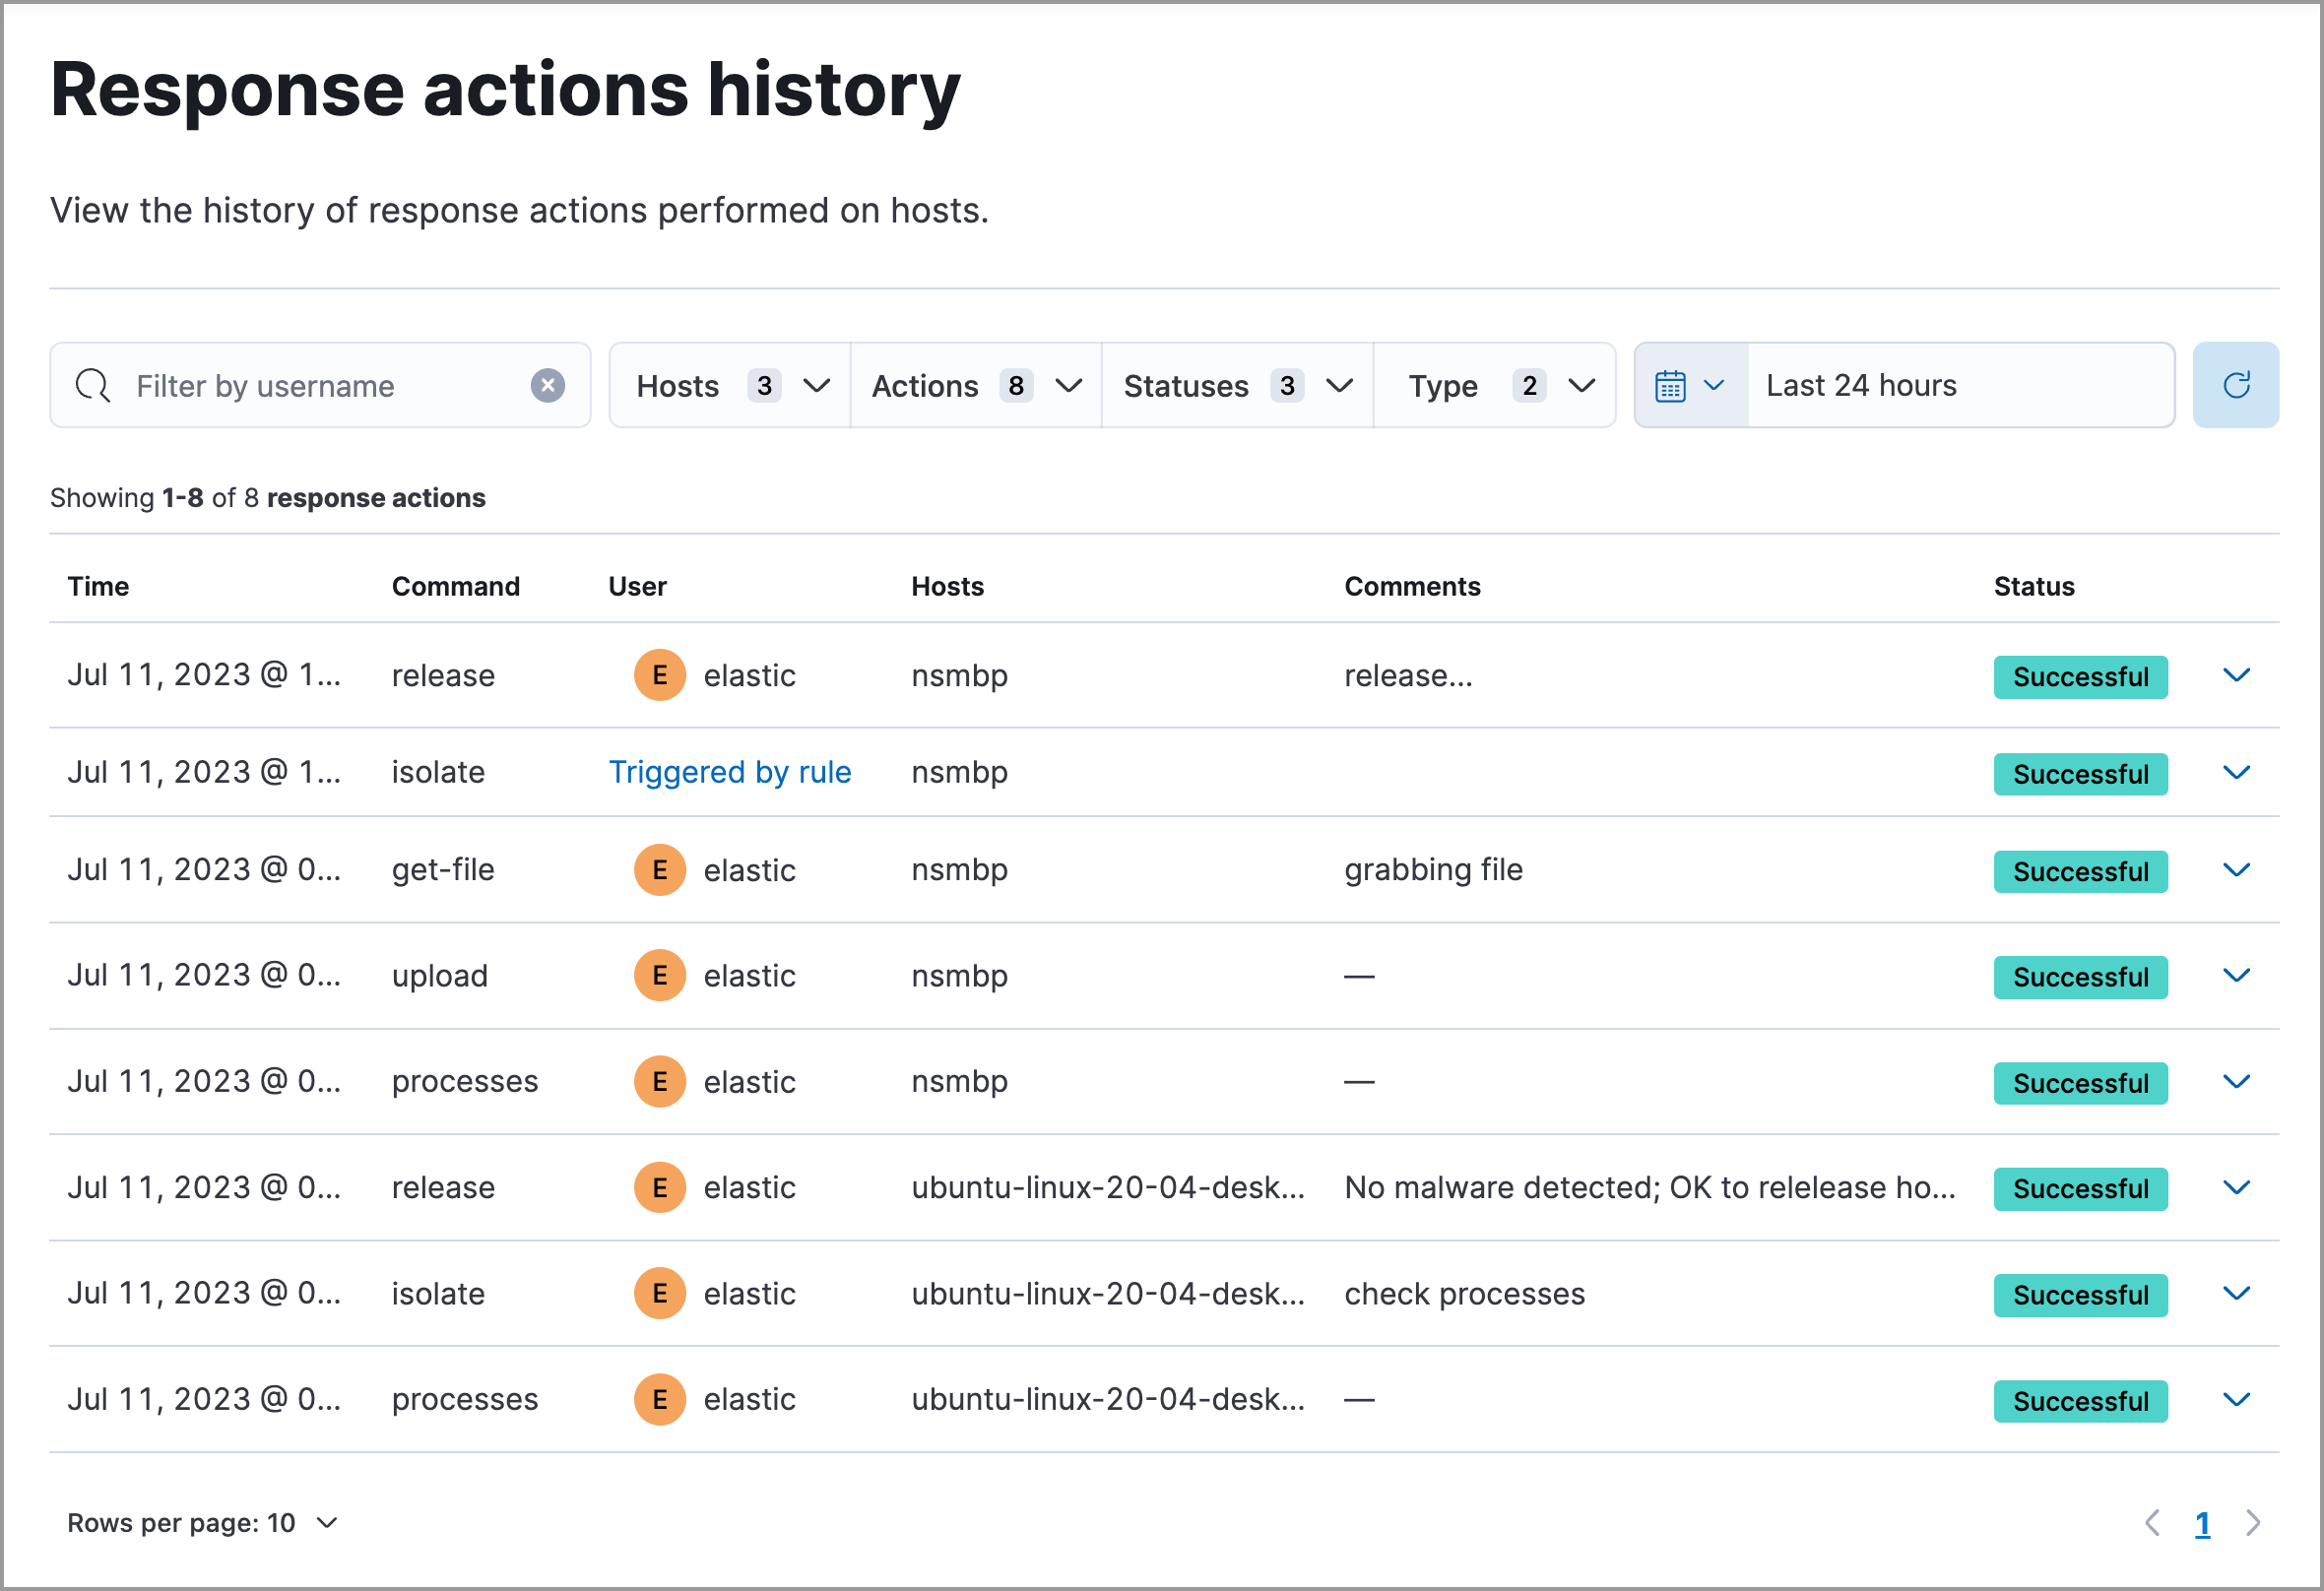
Elastic Security keeps a log of the response actions performed on endpoints, such as isolating a host or terminating a process. The log displays when each command was performed, the host on which the action was performed, the user who requested the action, any comments added to the action, and the action’s current status.
You must have the Response Actions History privilege or the appropriate user role to access this feature.
To access the response actions history for all endpoints, find Response actions history in the navigation menu or use the global search field. You can also access the response actions history for an individual endpoint from these areas:
- Endpoints page: Click an endpoint’s name to open the details flyout, then click the Response actions history tab.
- Response console page: Click the Response actions history button.
All of these contexts contain the same information and features. The following image shows the Response actions history page for all endpoints:

To filter and expand the information in the response actions history:
Enter a user name or comma-separated list of user names in the search field to display actions requested by those users.
Use the various drop-down menus to filter the actions shown:
- Hosts: Show actions performed on specific endpoints. (Only available on the Response actions history page for all endpoints.)
- Actions: Show specific actions types.
- Statuses: Show actions with a specific status.
- Types: Show actions based on the endpoint protection agent type (Elastic Defend or a third-party agent), and how the action was triggered (manually by a user or automatically by a detection rule).
Use the date and time picker to display actions within a specific time range.
Click the expand arrow on the right to display more details about an action.