Monitor Virtual Private Cloud (VPC) Flow Logs
In this section, you’ll learn how to monitor and analyze the VPC flow logs you sent to Elastic with Amazon Data Firehose. You can choose among the following monitoring options:
- Elastic Analytics Discover capabilities to manually analyze the data
- Elastic Observability’s anomaly feature to identify anomalies in the logs
- Out-of-the-box dashboard to further analyze the data
We assume that you already have:
- An Elastic Cloud Hosted deployment. The deployment includes an Elasticsearch cluster for storing and searching your data, and Kibana for visualizing and managing your data. AWS Kinesis Data Firehose works with Elastic Stack version 7.17 or greater, running on Elastic Cloud only.
Make sure the deployment is on AWS, because the Firehose delivery stream connects specifically to an endpoint that needs to be on AWS.
- An AWS account with permissions to pull the necessary data from AWS.
- VPC flow logs enabled for the VPC where the application is deployed and configured to send data to Kinesis Data Firehose.
- A three-tier web architecture in AWS, which can ingest metrics from several AWS services.
In Elastic Analytics, you can search and filter your data, get information about the structure of the fields, and display your findings in a visualization. You can also customize and save your searches and place them on a dashboard. For more information, check the Discover documentation.
For example, for your VPC flow logs you want to know:
- How many logs were accepted or rejected
- Where potential security violations occur (source IPs from outside the VPC)
- What port is generally being queried
You can filter the logs on the following:
- Delivery stream name:
AWS-3-TIER-APP-VPC-LOGS - VPC flow log action:
REJECT - Time frame: 5 hours
- VPC network interface: Webserver 1 and Webserver 2 interfaces
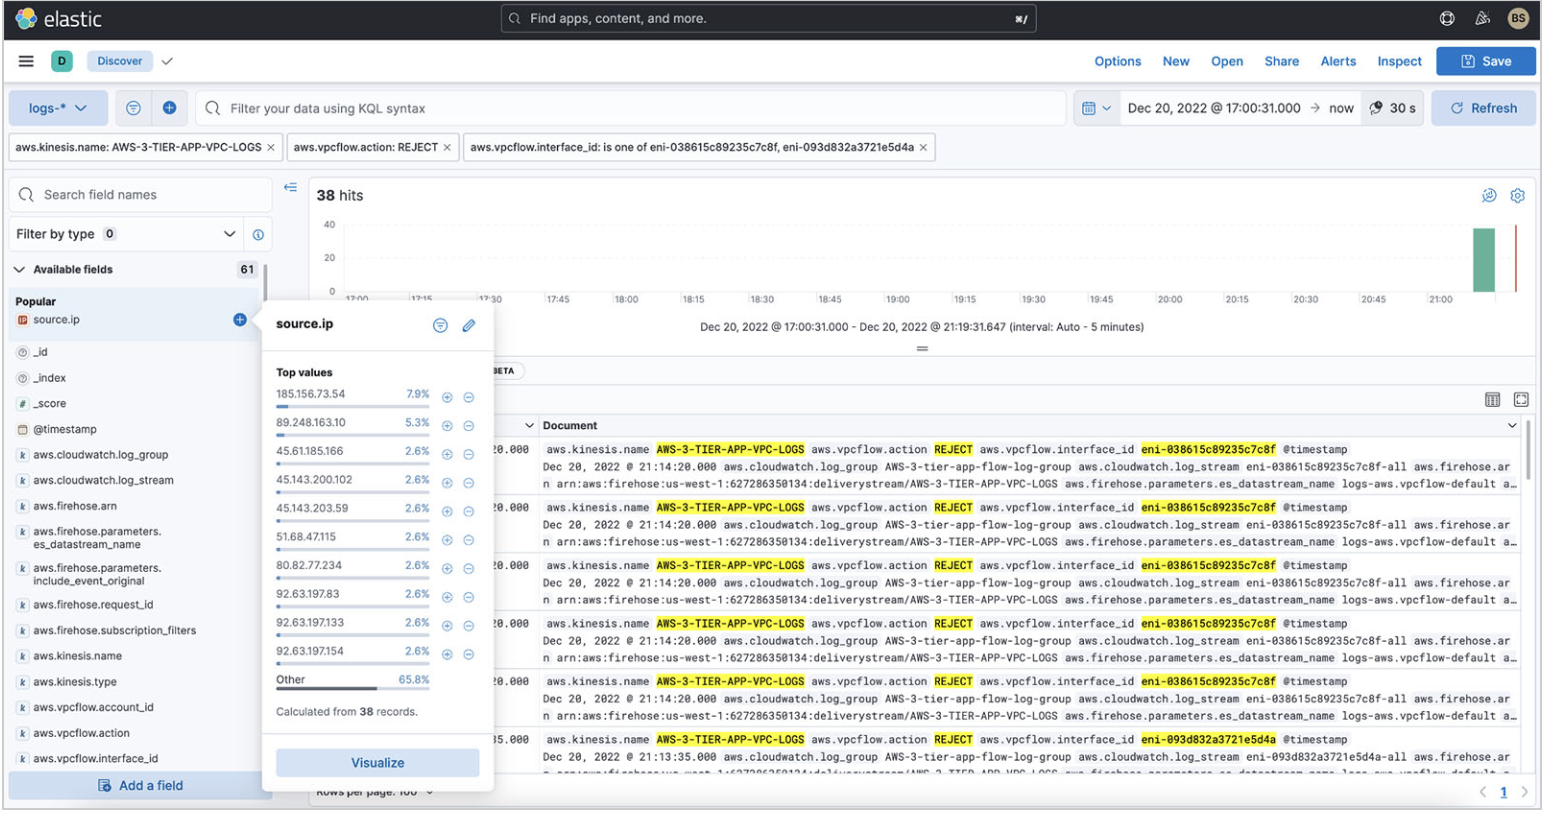
You want to see what IP addresses are trying to hit your web servers. Then, you want to understand which IP addresses you’re getting the most REJECT actions from. You can expand the source.ip field and quickly get a breakdown that shows 185.156.73.54 is the most rejected for the last 3 or more hours you’ve turned on VPC flow logs.
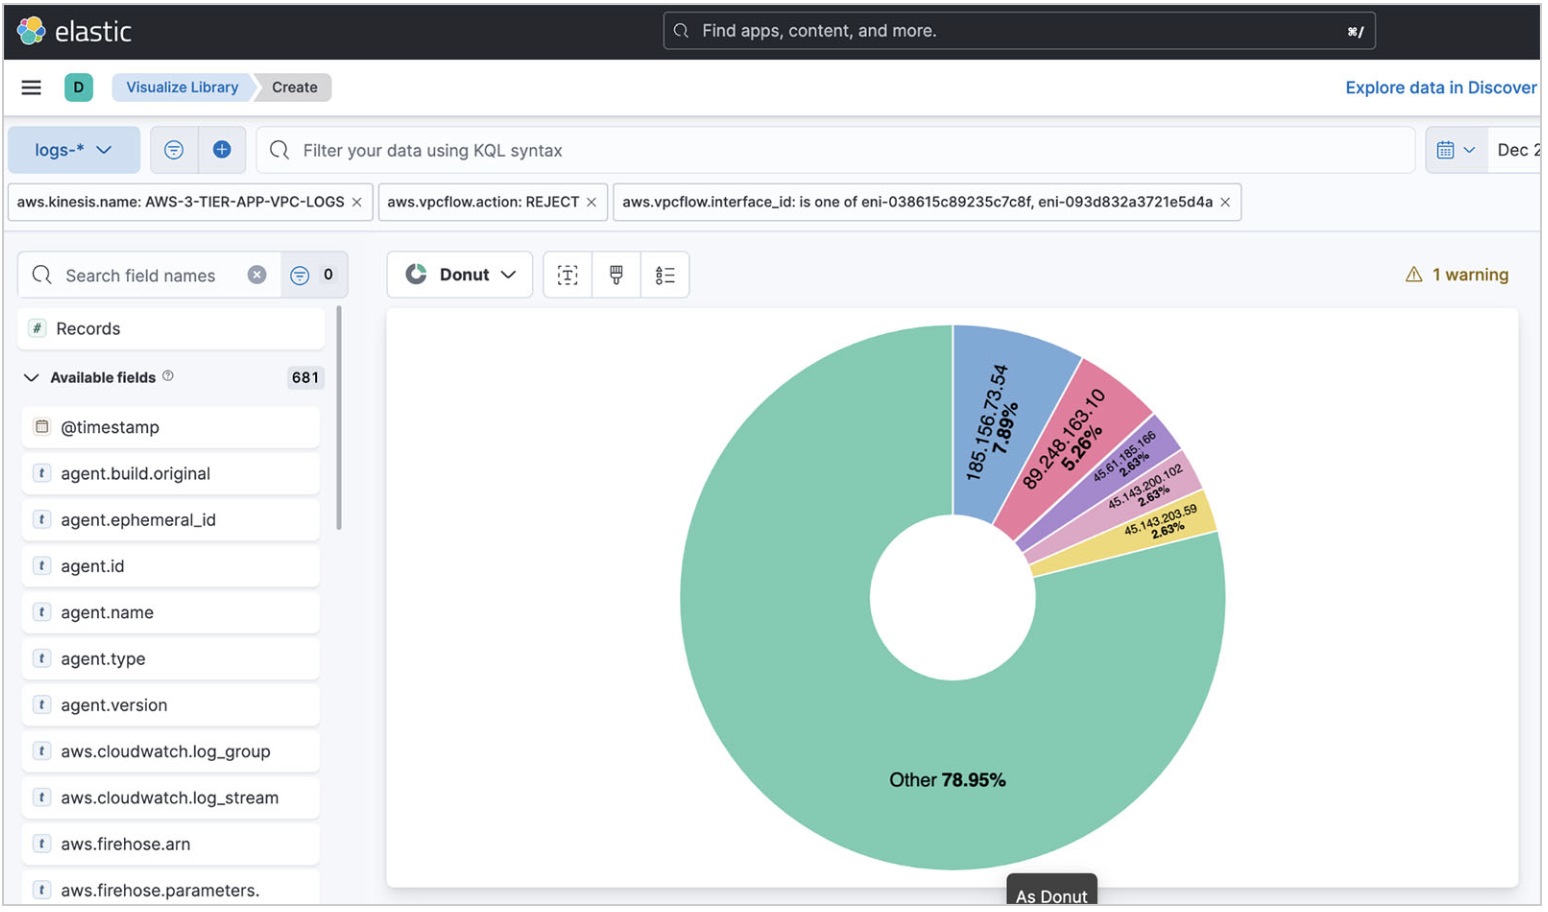
You can also create a visualization by choosing Visualize. You get the following donut chart, which you can add to a dashboard.
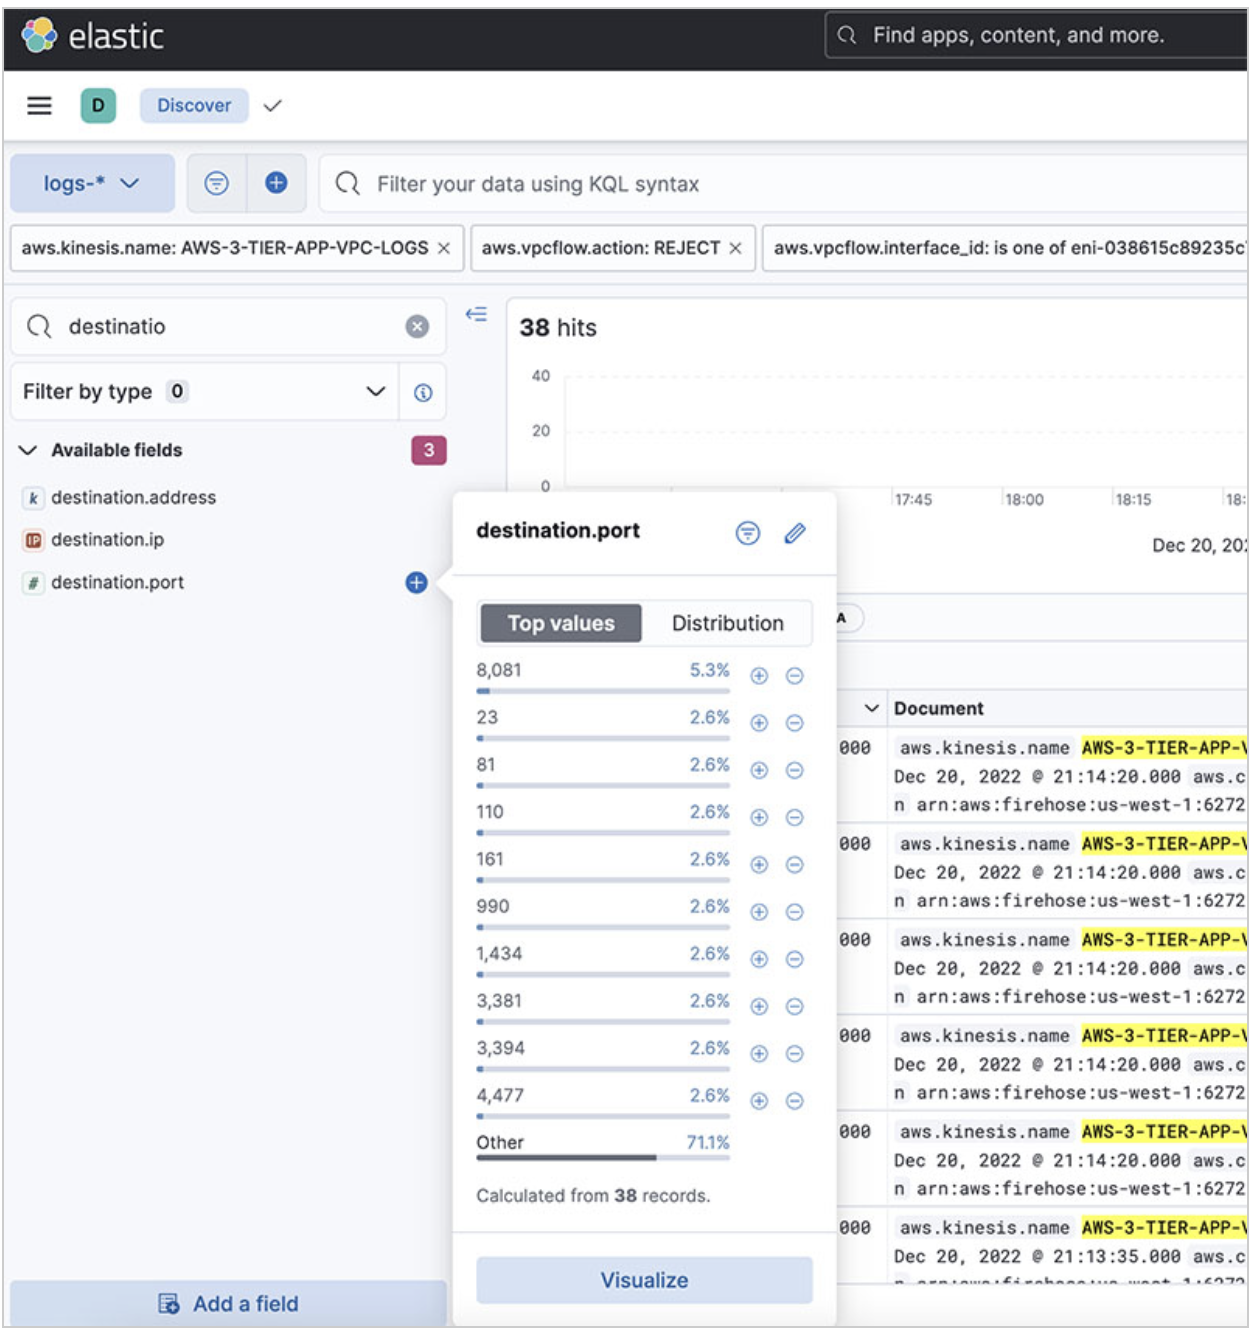
On top of the IP addresses, you also want to know what port is being hit on your web servers.
If you select the destination port field, the pop-up shows that port 8081 is being targeted. This port is generally used for the administration of Apache Tomcat. This is a potential security issue, however port 8081 is turned off for outside traffic, hence the REJECT.
Elastic Observability provides the ability to detect anomalies on logs using Machine Learning (ML). To learn more about how to use the ML analysis with your logs, check the Machine learning documentation. You can select the following options:
- Log rate: Automatically detects anomalous log entry rates
- Categorization: Automatically categorizes log messages
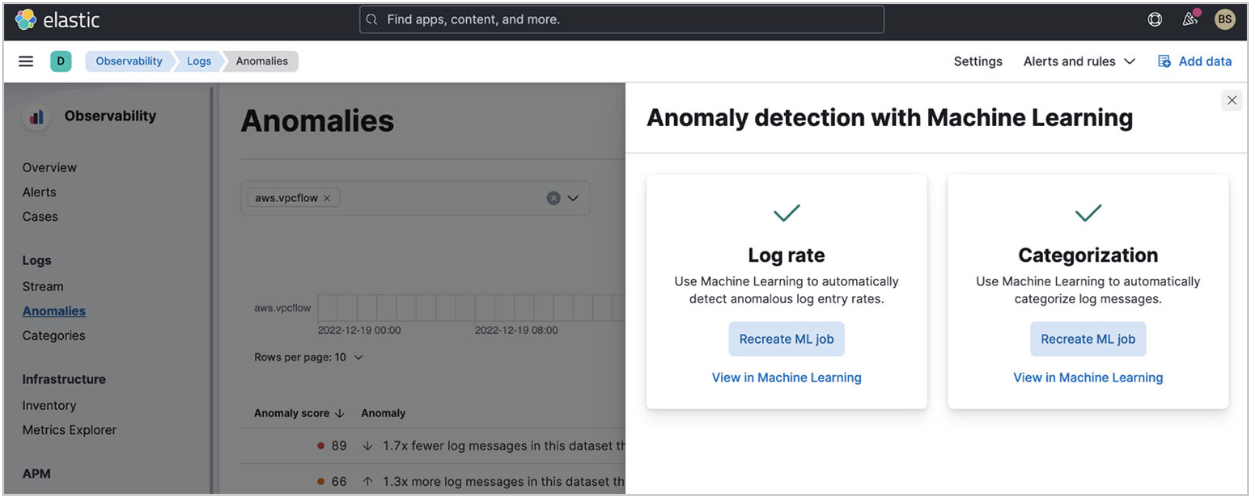
For your VPC flow log, you can enable both features. When you look at what was detected for anomalous log entry rates, you get the following results:
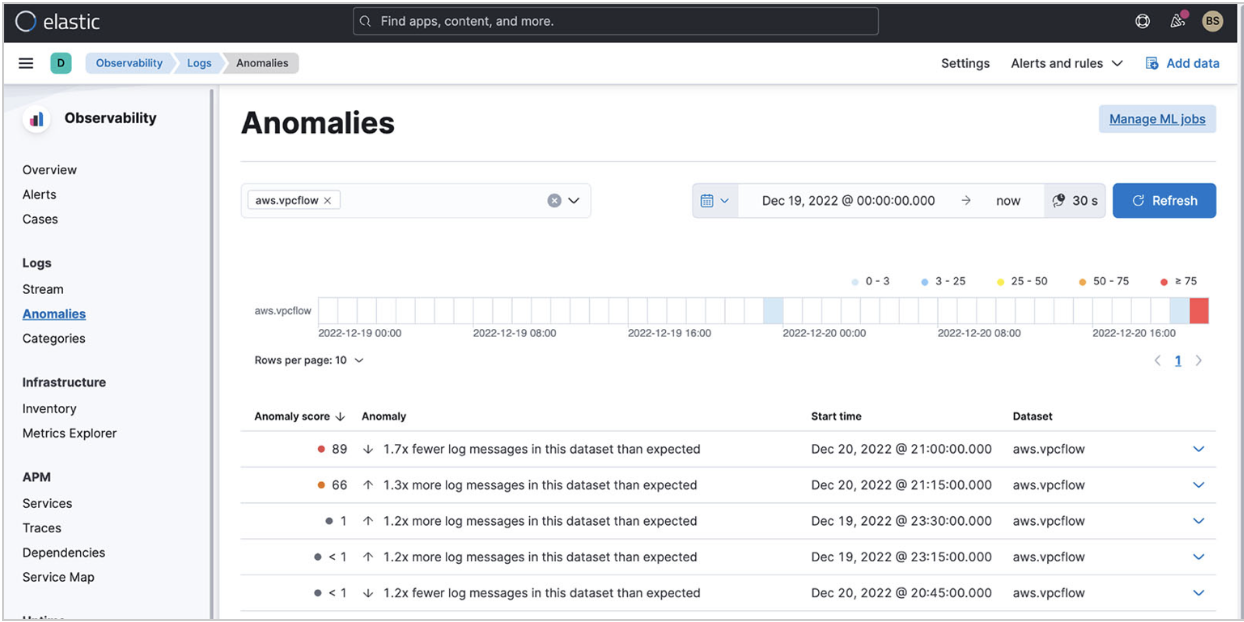
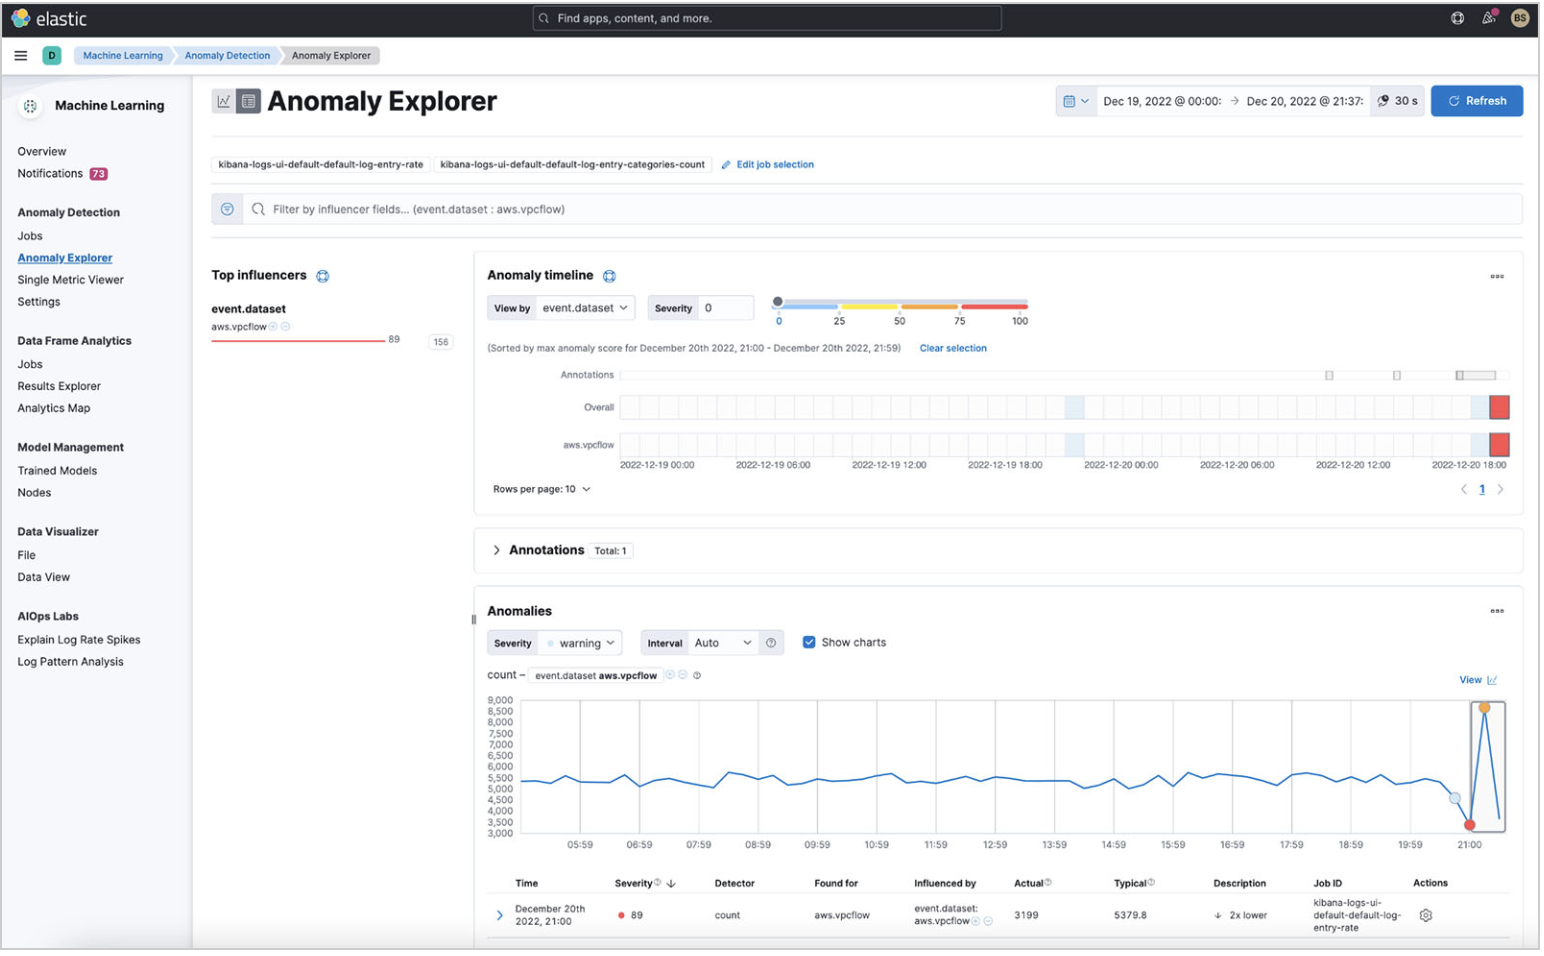
Elastic detected a spike in logs when you turned on VPC flow logs for your application. The rate change is being detected because you’re also ingesting VPC flow logs from another application.
You can drill down into this anomaly with ML and analyze further.
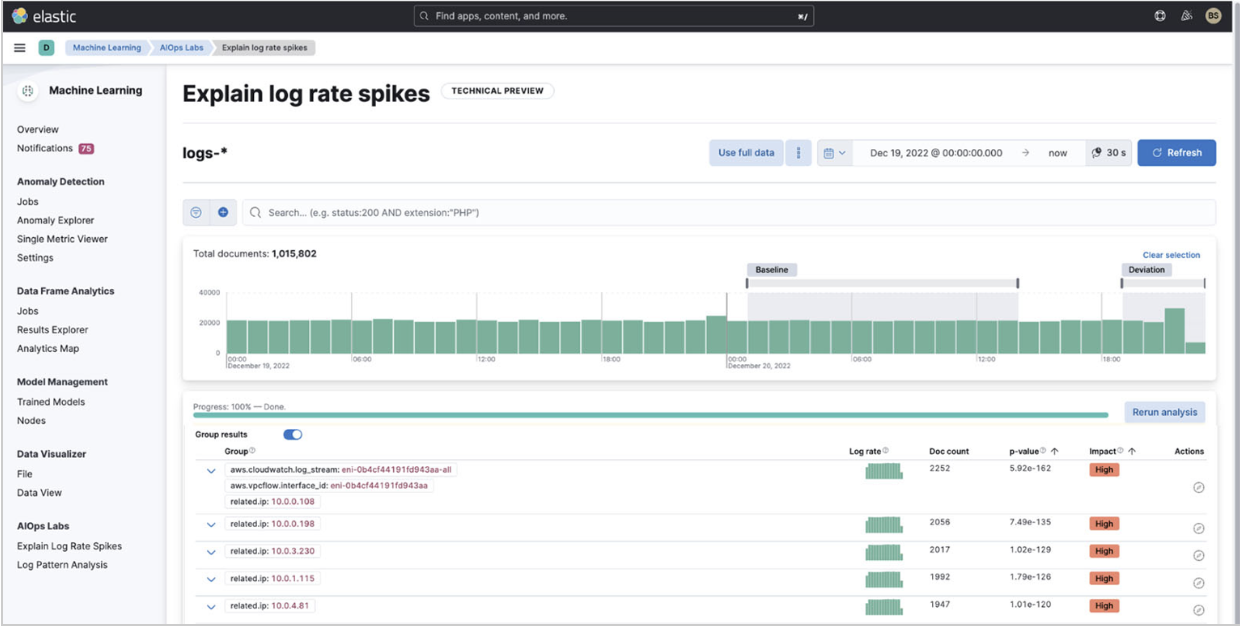
Because you know that a spike exists, you can also use the Elastic AIOps Labs Explain Log Rate Spikes capability. By grouping them, you can see what is causing some of the spikes.
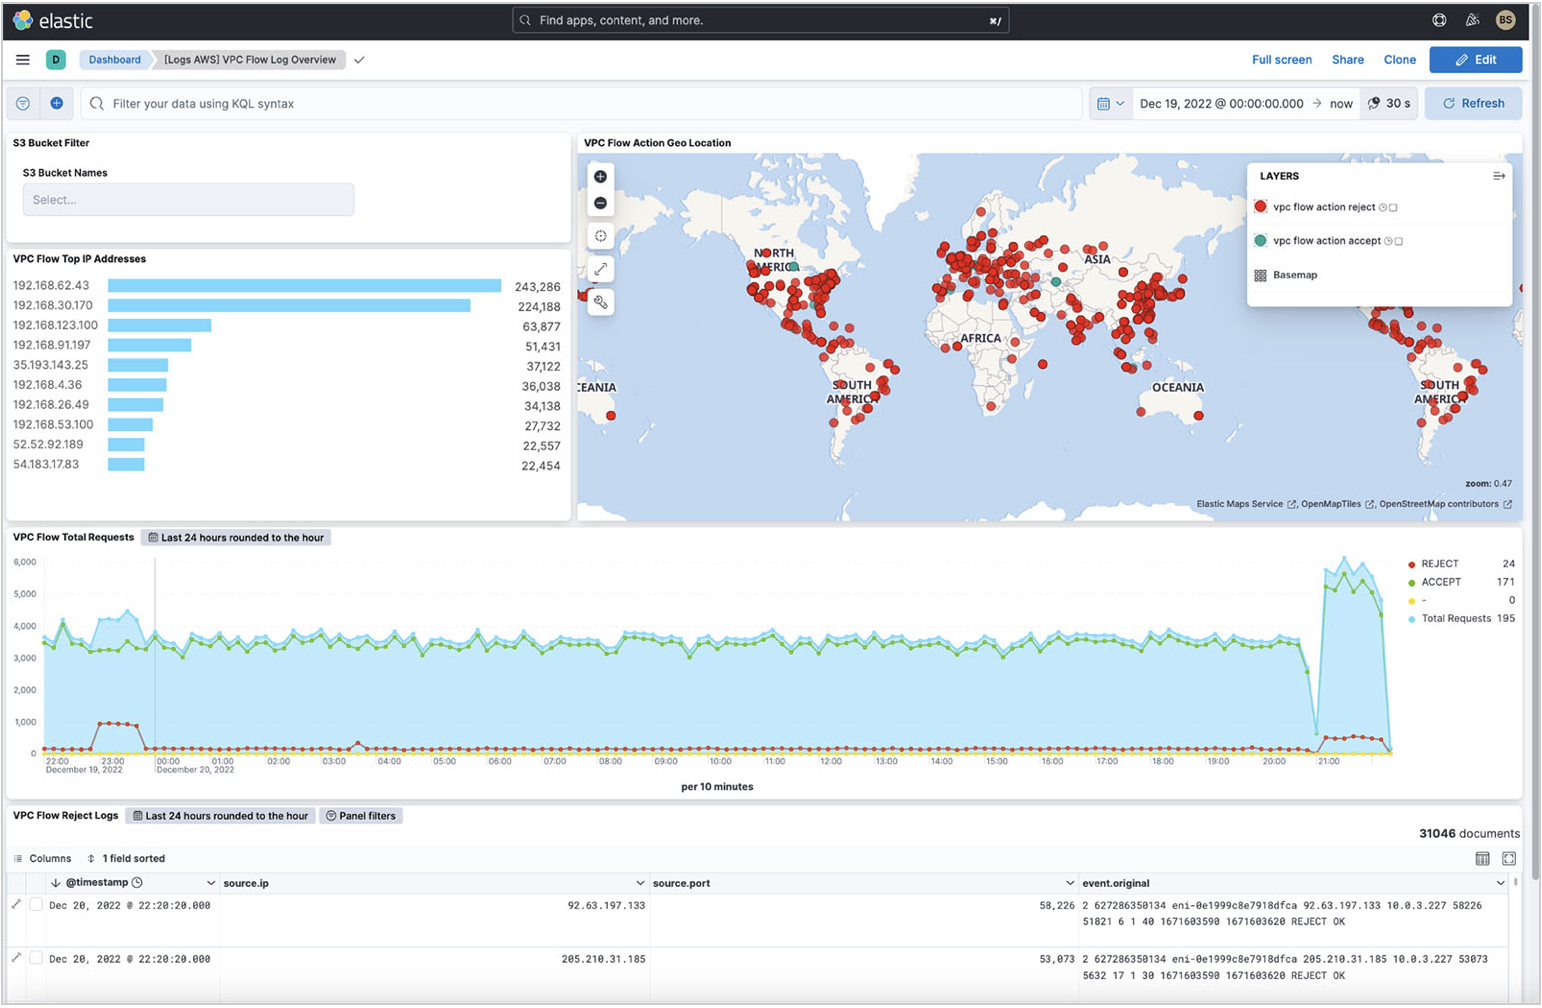
Elastic provides an out-of-the-box dashboard to show the top IP addresses hitting your VPC, where they are coming from geographically, the time series of the flows, and a summary of VPC flow log rejects within the time frame.
You can enhance this baseline dashboard with the visualizations you find in Discover.
