Traces UI in Elastic APM
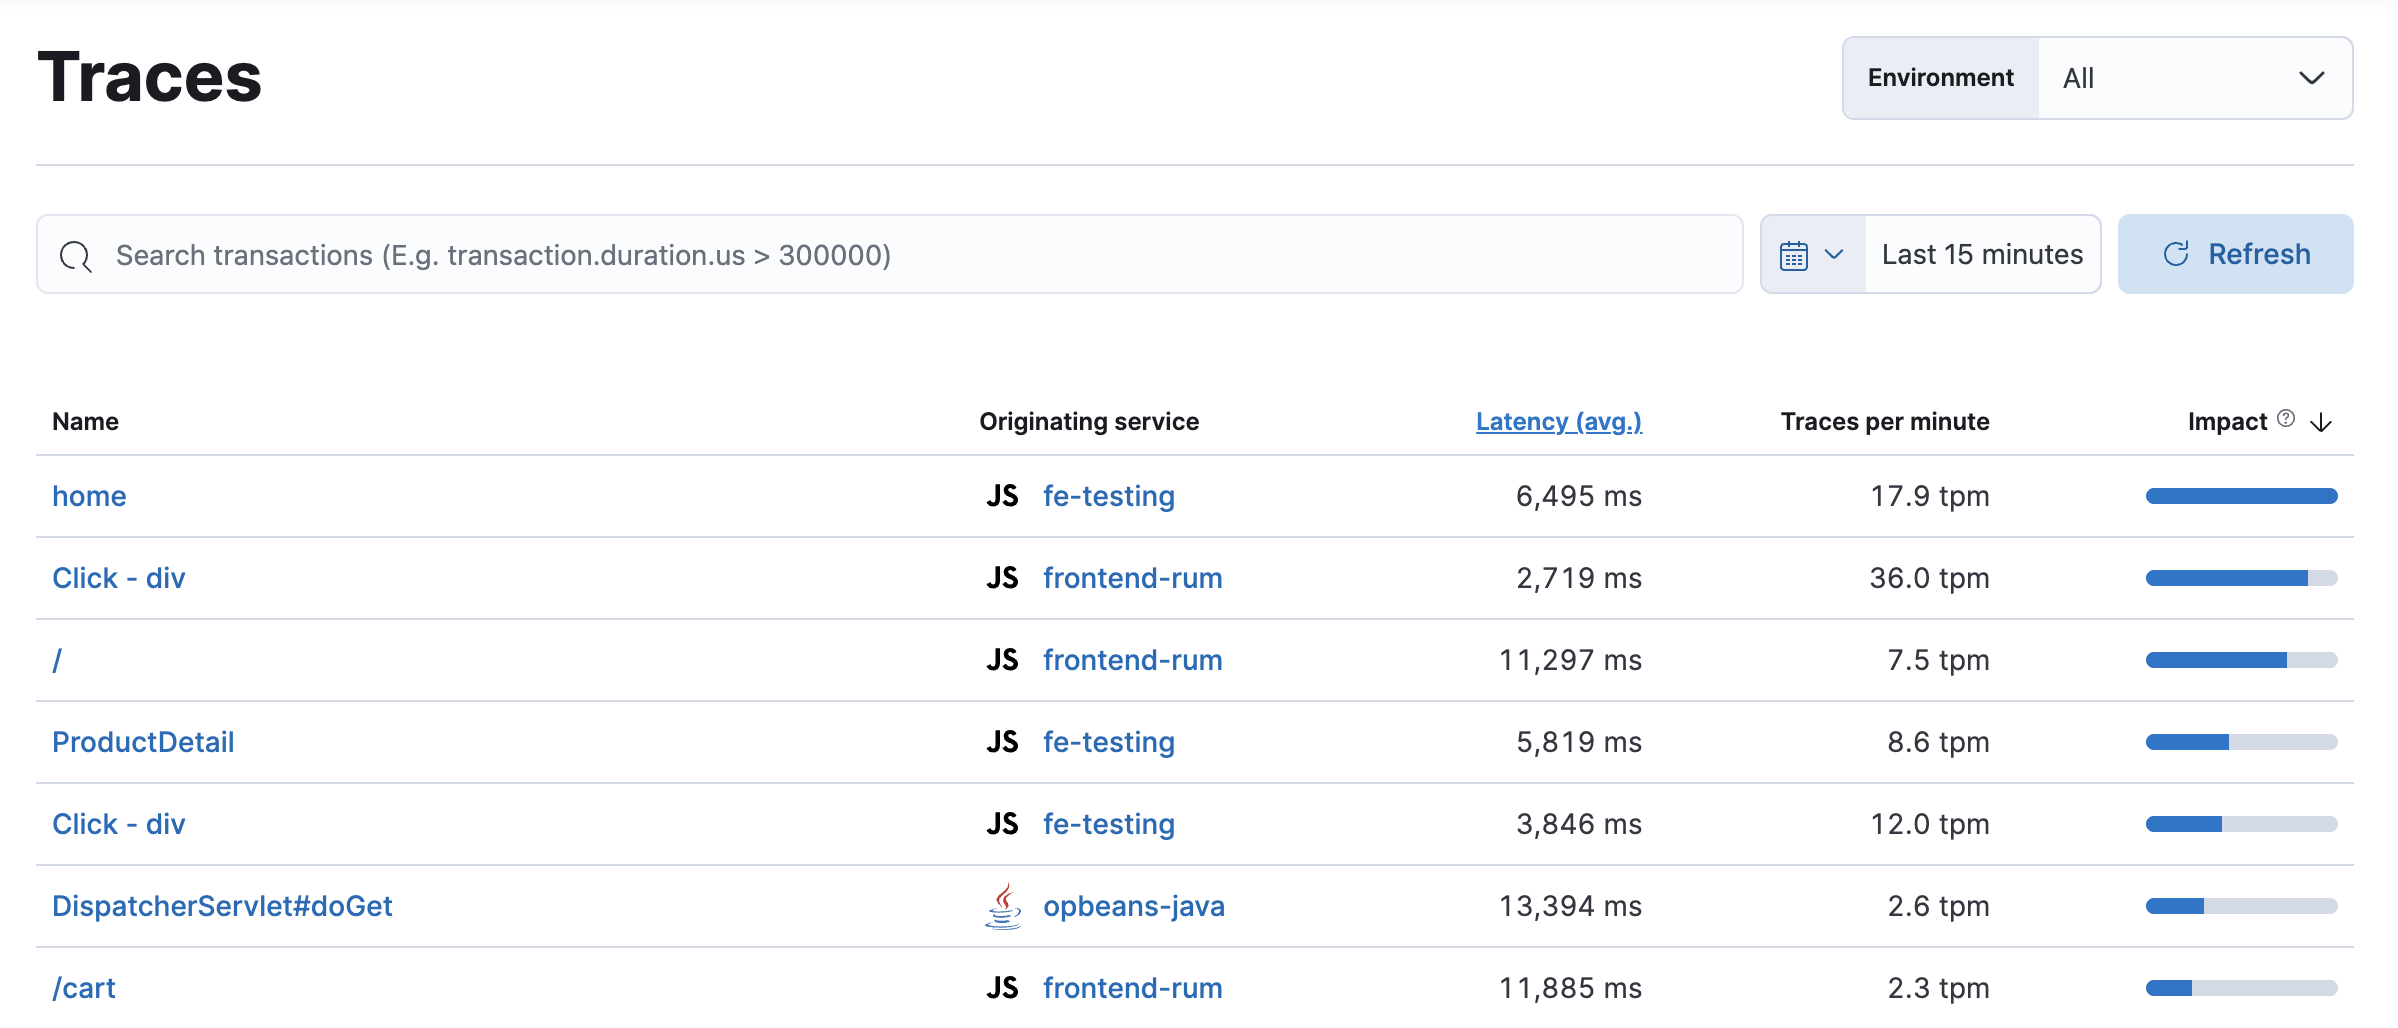
Traces link together related transactions to show an end-to-end performance of how a request was served and which services were part of it. In addition to the Traces overview, you can view your application traces in the trace sample timeline waterfall.
Traces displays your application’s entry (root) transactions. Transactions with the same name are grouped together and only shown once in this table. If you’re using distributed tracing, this view is key to finding the critical paths within your application.
By default, transactions are sorted by Impact. Impact helps show the most used and slowest endpoints in your service — in other words, it’s the collective amount of pain a specific endpoint is causing your users. If there’s a particular endpoint you’re worried about, select it to view its transaction details.
You can also use queries to filter and search the transactions shown on this page. Note that only properties available on root transactions are searchable. For example, you can’t search for label.tier: 'high', as that field is only available on non-root transactions.

This functionality is in technical preview and may be changed or removed in a future release. Elastic will work to fix any issues, but features in technical preview are not subject to the support SLA of official GA features.
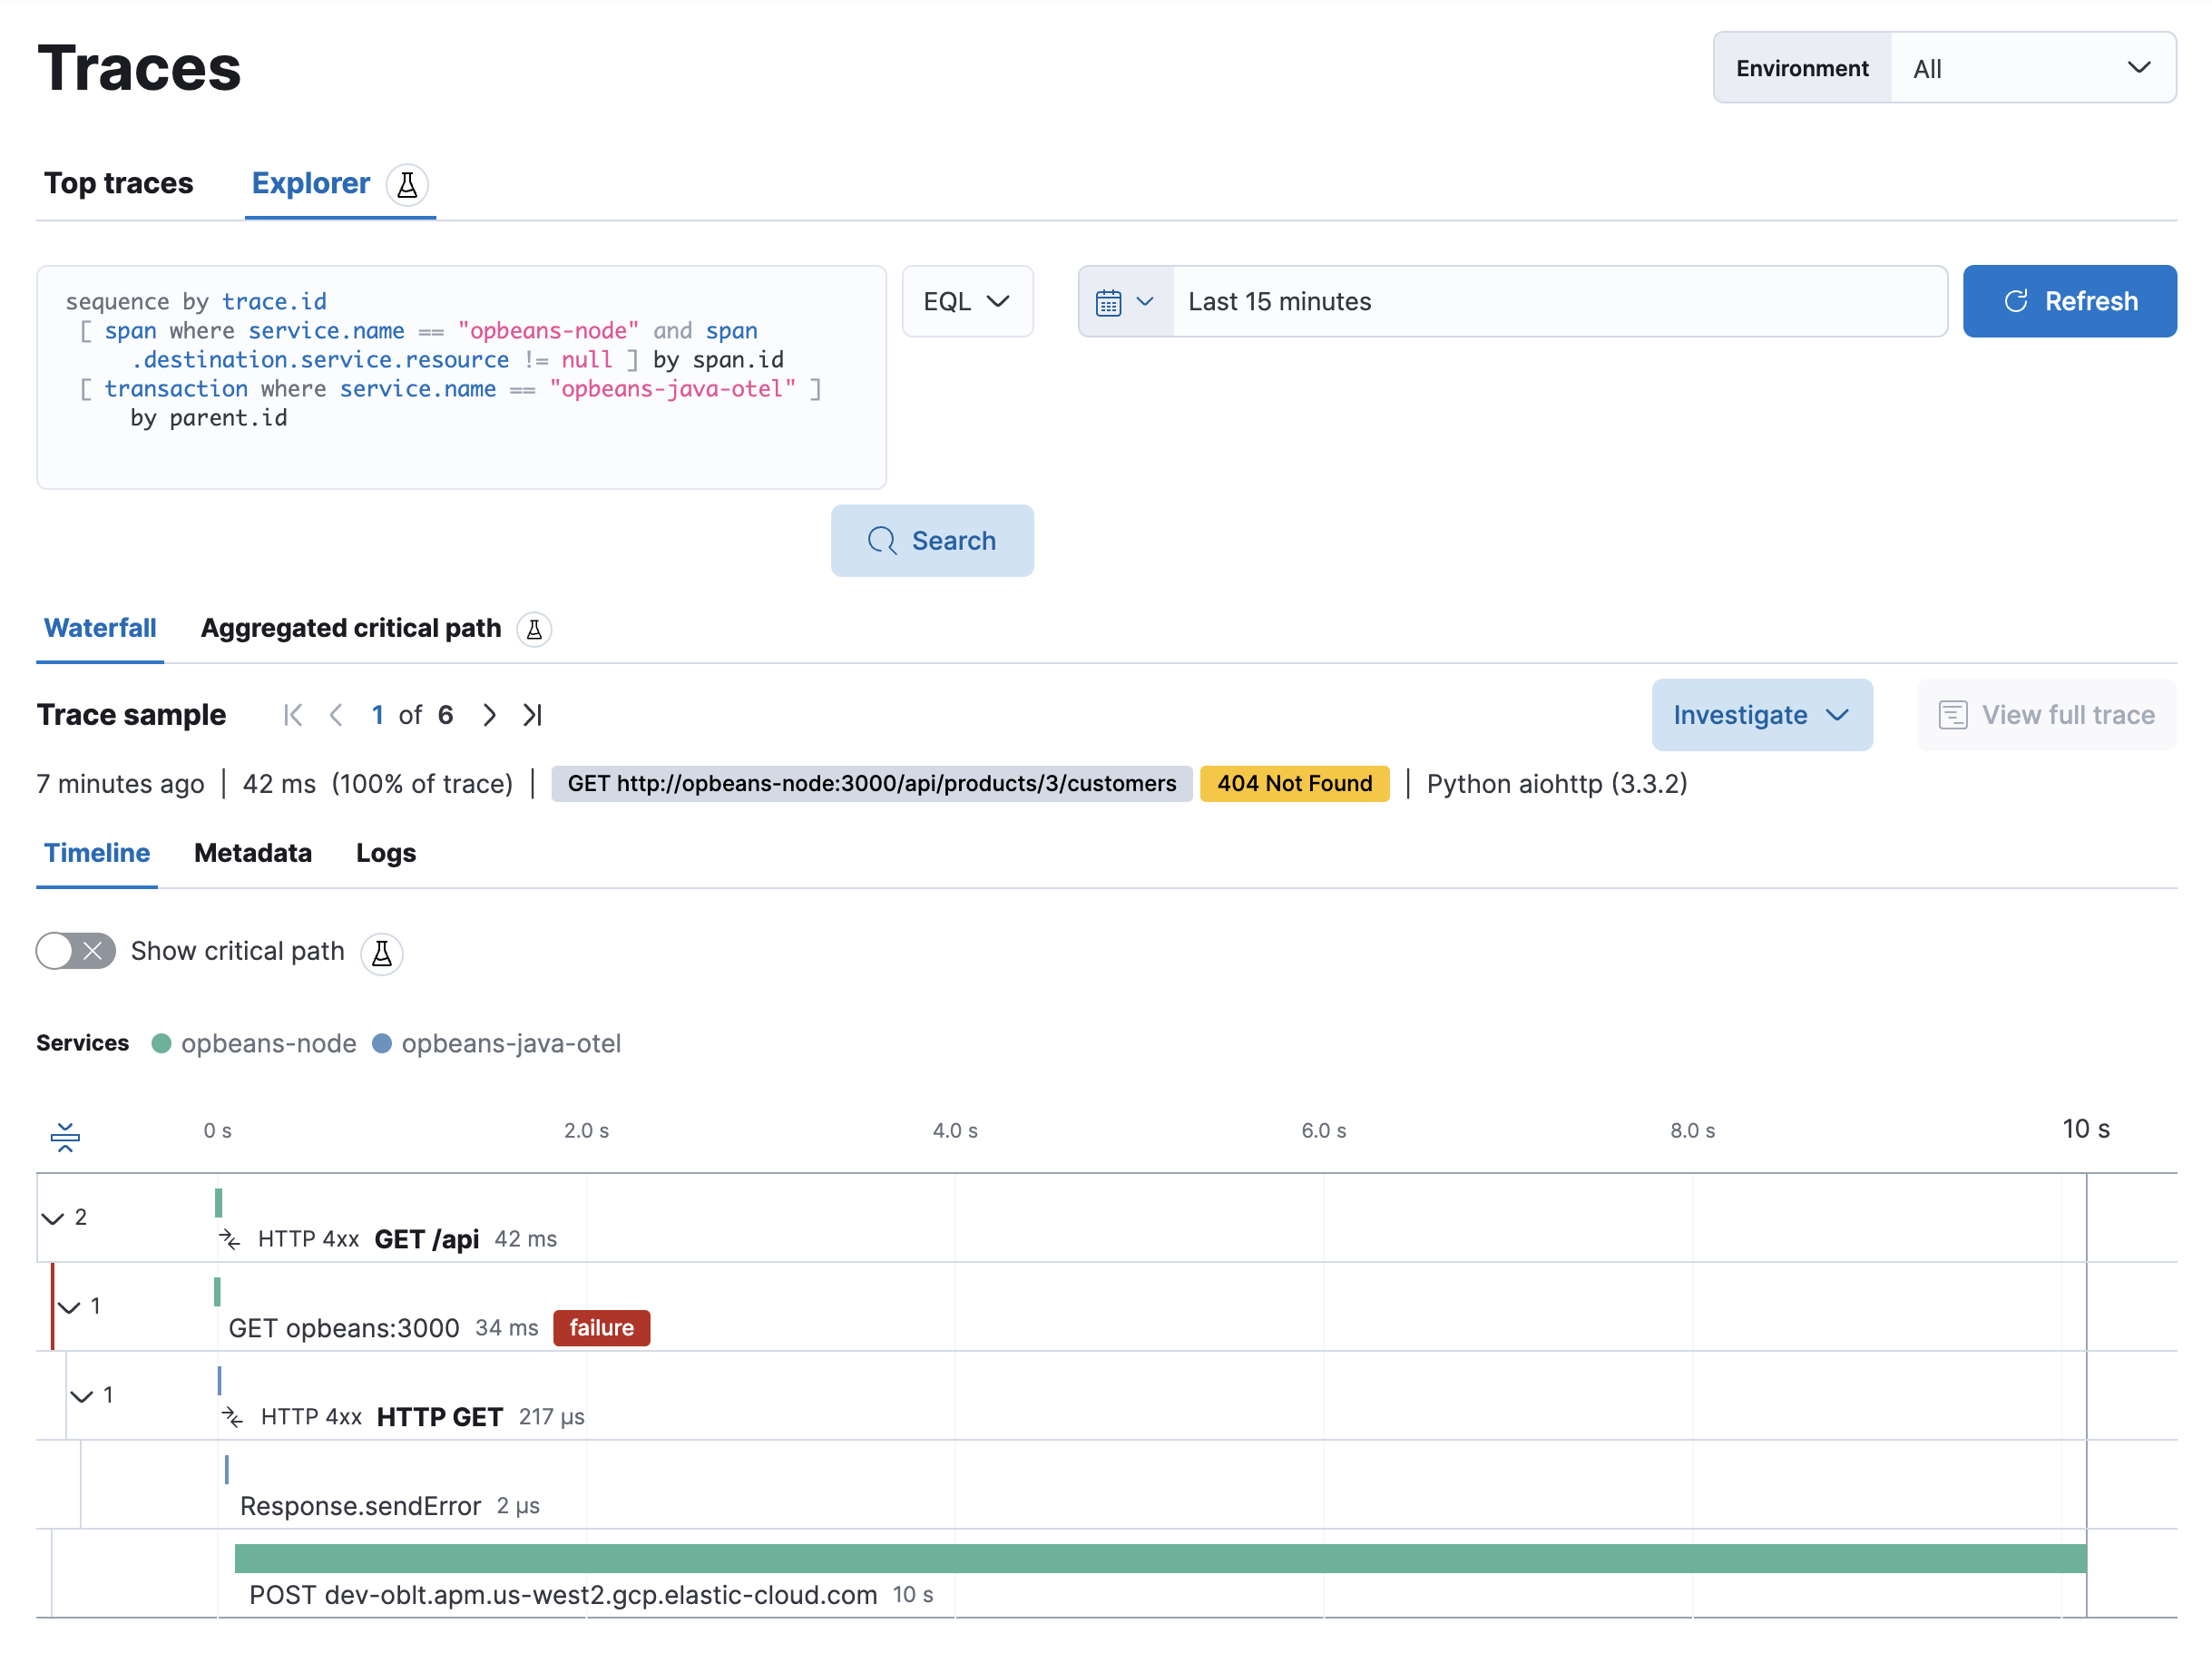
Trace explorer is an experimental top-level search tool that allows you to query your traces using Kibana Query Language (KQL) or Event Query Language (EQL).
Curate your own custom queries, or use the Service Map to find and select edges to automatically generate queries based on your selection:
