Monitoring infrastructure and microservices with Elastic Observability
Trends in the infrastructure and software space have changed the way we build and run software. As a result, we have started treating our infrastructure as code, which has helped us lower costs and get our products to market more quickly. These new architectures also give us the ability to test our software faster in production-like deployments, and generally deliver more stable and reproducible deployments. However, the flip side of these improvements is the increased complexity of our environments, especially when it comes to monitoring our new infrastrastructures effectively.
In this blog we will discuss the "must haves" for monitoring your full application stack, including custom applications, services, and the infrastructure they run on. We'll also show how the Elastic Observability solution and Elastic Stack can help address those needs, and help you build the ultimate monitoring platform to increase observability and reduce downtime. When you are ready, you can start a free trial in Elastic Cloud or download the latest version from our website to get started.
Evolving architectures: The journey to containers and microservices
So how did we get here? The infrastructure software space is evolving at a very rapid pace. From the hardware perspective we have moved from physical machines to using various virtualization tools (or hypervisors), then we saw the emergence of public cloud infrastructures that gave us a way to outsource the maintenance and provisioning part of servers and networks, which helped us reduce time to value. I still remember the time when we had to wait for weeks before a new server was provisioned so that we could get on with our projects. Perhaps some still do today, but it’s a solved problem already. Today it’s container platforms — container orchestrators like Docker and Kubernetes — that are becoming the platform of choice for many organizations. Of course, many of those same organizations use virtualization on bare metal hosts as well.
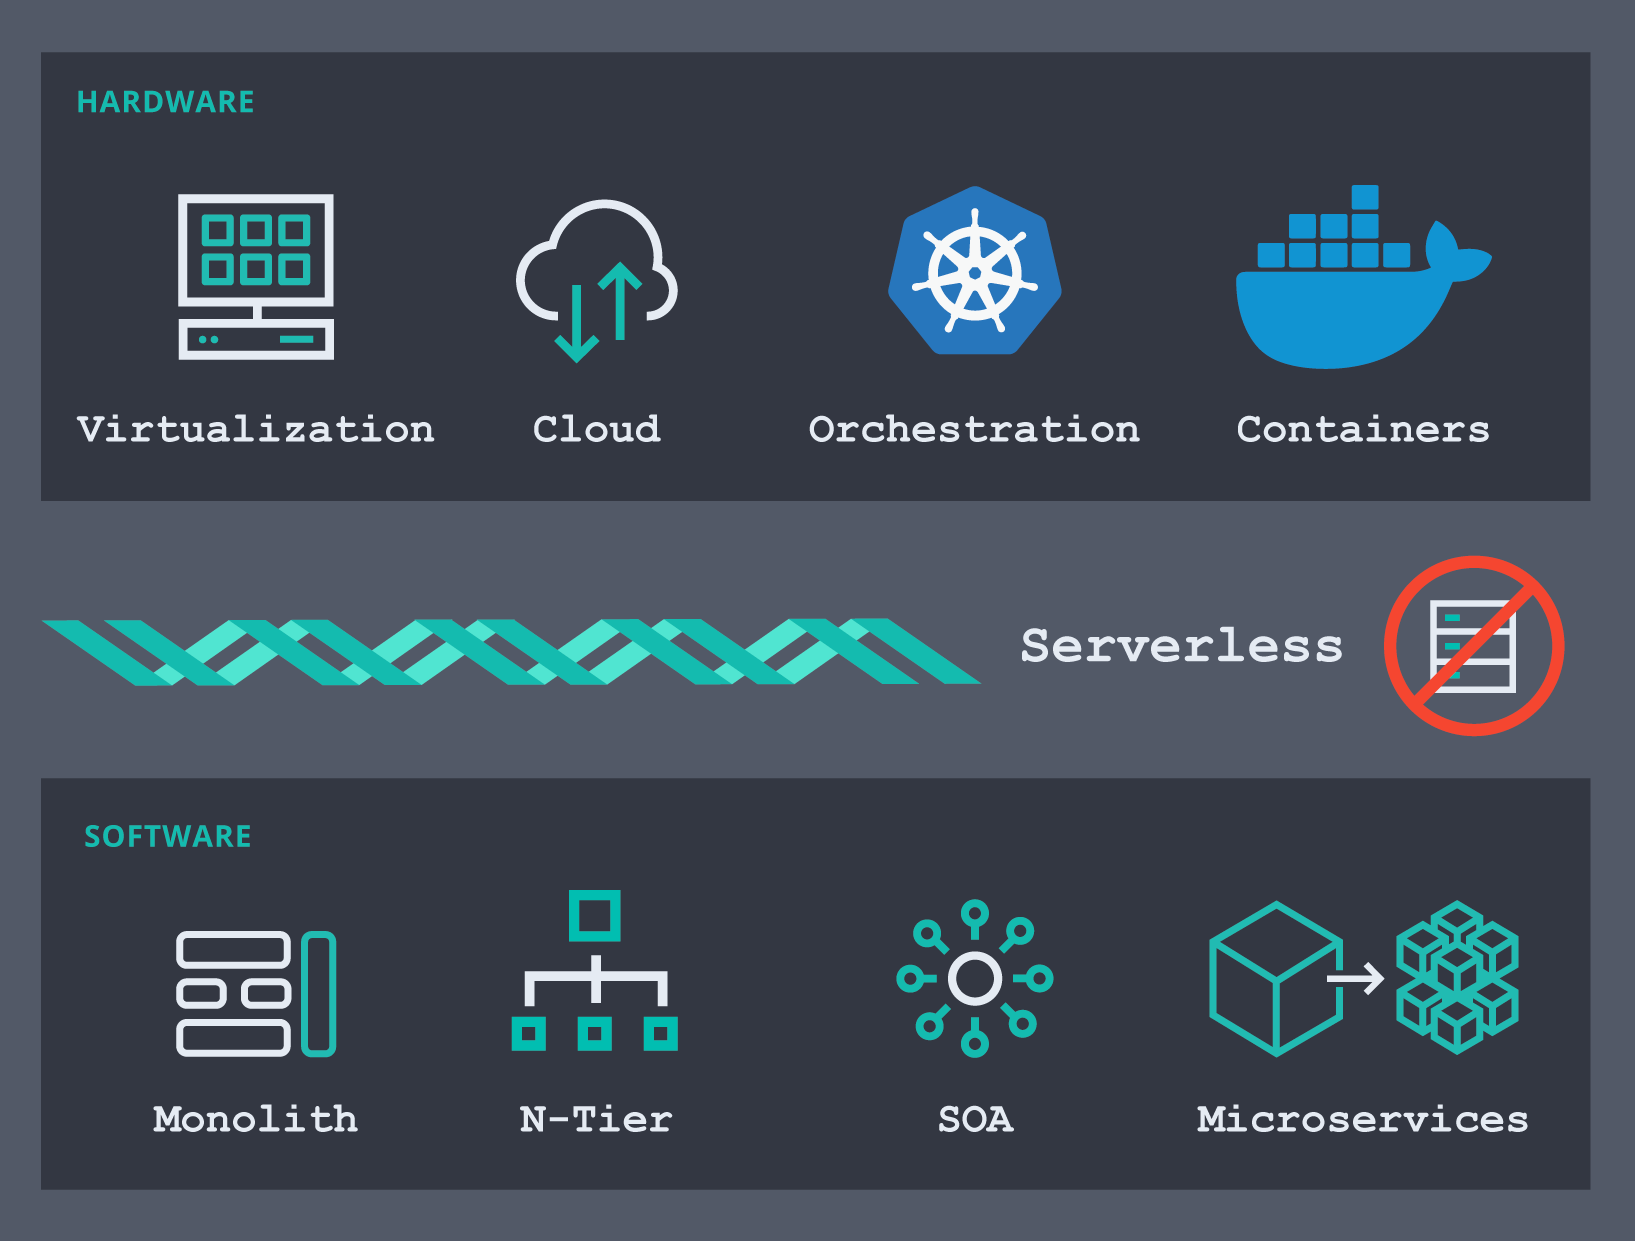
On the software side of this timeline, we have gone from building monoliths to decoupling them into multiple layers (presentation, application, data, etc). Then service-oriented architectures (SOAs) became the dominant design pattern, and they in turn evolved, with different flavors: web services, event-driven architectures, and of course their latest incarnation, microservices. Today, if you want to build a new application, it’ll probably be based on microservices running in pods on Kubernetes, somewhere in the cloud. Chances are that your organization today has one or more initiatives to break down old monoliths into microservices and use an orchestrator to deploy them.
As a consequence, our stacks now have more components to monitor and our monitoring tools need to keep track of applications that are constantly moving around with containers appearing and disappearing at high rates. Monitoring modern environments created a need for an entirely new approach.
Infrastructure monitoring: Requirements for modern complexities
When we talk about today’s deployment environments, we have quite a few pieces to consider. We have the infrastructure that things run on, whether it's on-prem data centers, public cloud infrastructure, or a hybrid mix. Any typical environment today has an orchestration layer (e.g., Kubernetes) that automates deployment and scaling of applications. We have the things that our apps run in or on, like containers, VMs, or bare metal. When we develop applications we introduce dependencies on third-party systems like external services, databases, or components written by other teams in our organization. And, of course, the applications themselves — both the internal components and the end-user experience.
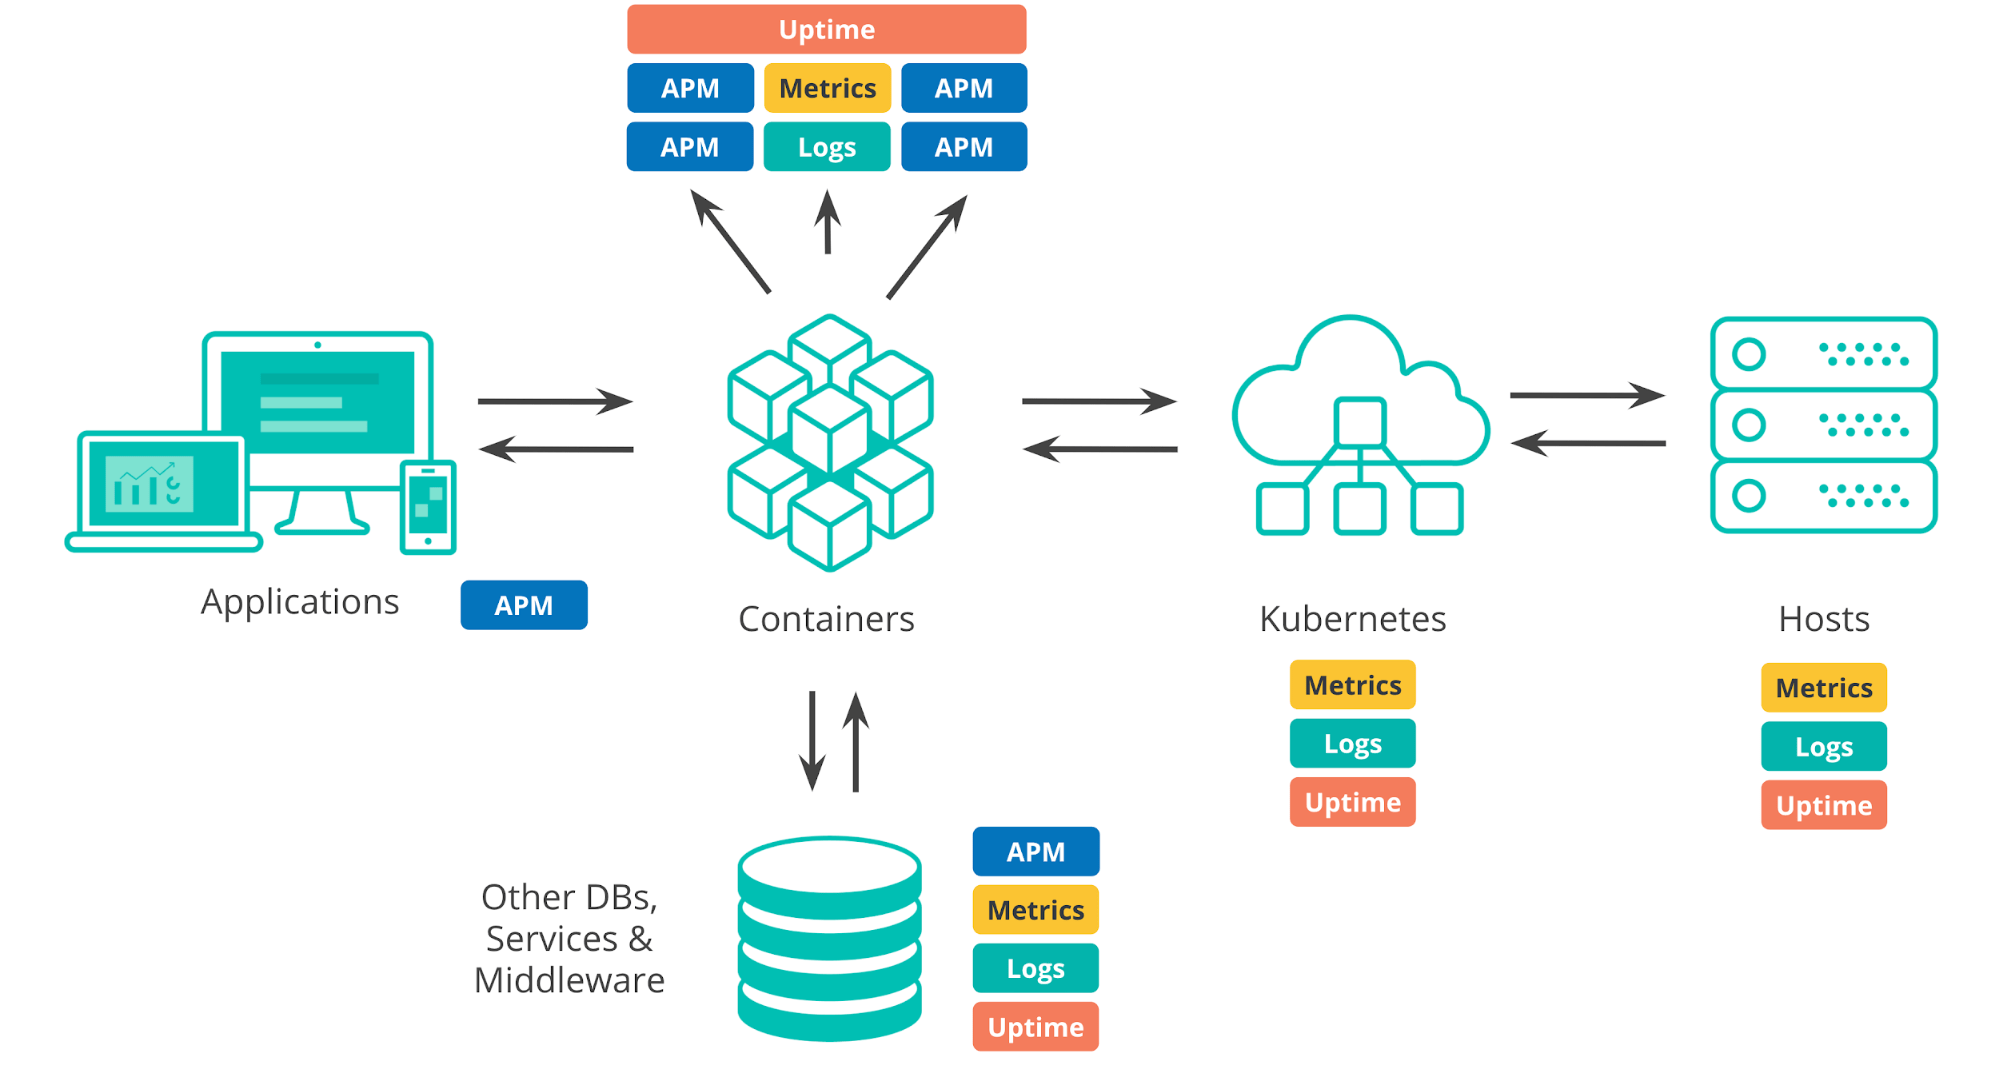
To make sure that our applications are running as they should we need to monitor all of these different components, and all of them produce a lot of monitoring data, not only logs and metrics, but also APM and uptime data.
To gain full visibility into such deployments, we expect a monitoring solution should:
- Support the full infrastructure and application stack, from hosts to applications.
- Easily ingest data from different sources, like VMs, containers, orchestrators, cloud platforms, databases, and more (this is usually characterized by the integrations with other systems that a monitoring solution provides).
- Handle both the increasingly dynamic deployments as infrastructure environments transition to containerized, and, at the same time, handle parts of our older, traditional infrastructure.
- Provide us with powerful ways to interact with this operational data and build views that are optimized for everybody in the organization, from DevOps teams to product and business owners.
- Let us know when something's wrong. Alerting is one of the foundational blocks of any monitoring solution and should fully cover any infrastructure.
- Provide long term, reliable storage for logs and metrics for historical analysis or regulatory requirements. This storage solution should also provide the ability to manage the lifecycle of data with fully controllable granularity and retention rates.
- Be suitable for full infrastructure and application observability. The majority of monitoring tools typically specialize on one type of data: many popular time-series databases (TSDBs) only work with metrics. But any typical deployment environment produces all kinds of data — logs, metrics, APM, and availability data. These data streams provide different perspectives on how our environments are performing, so why treat this data separately and maintain different tools with different learning curves, license models, or support levels?
- Have all of the above in a single monitoring solution.
| This list can be boiled down to two core requirements: an infrastructure monitoring solution should be able to get operational data from all parts of the infrastructure and it should make it actionable. |
The Elastic Stack (ELK Stack) for infrastructure monitoring
The continuous evolution and increased monitoring power required to effectively observe today’s infrastructures calls for a solution that’s fast, scalable, and flexible. Let’s take a look how Elastic addresses these requirements.
Ingesting logs and metrics
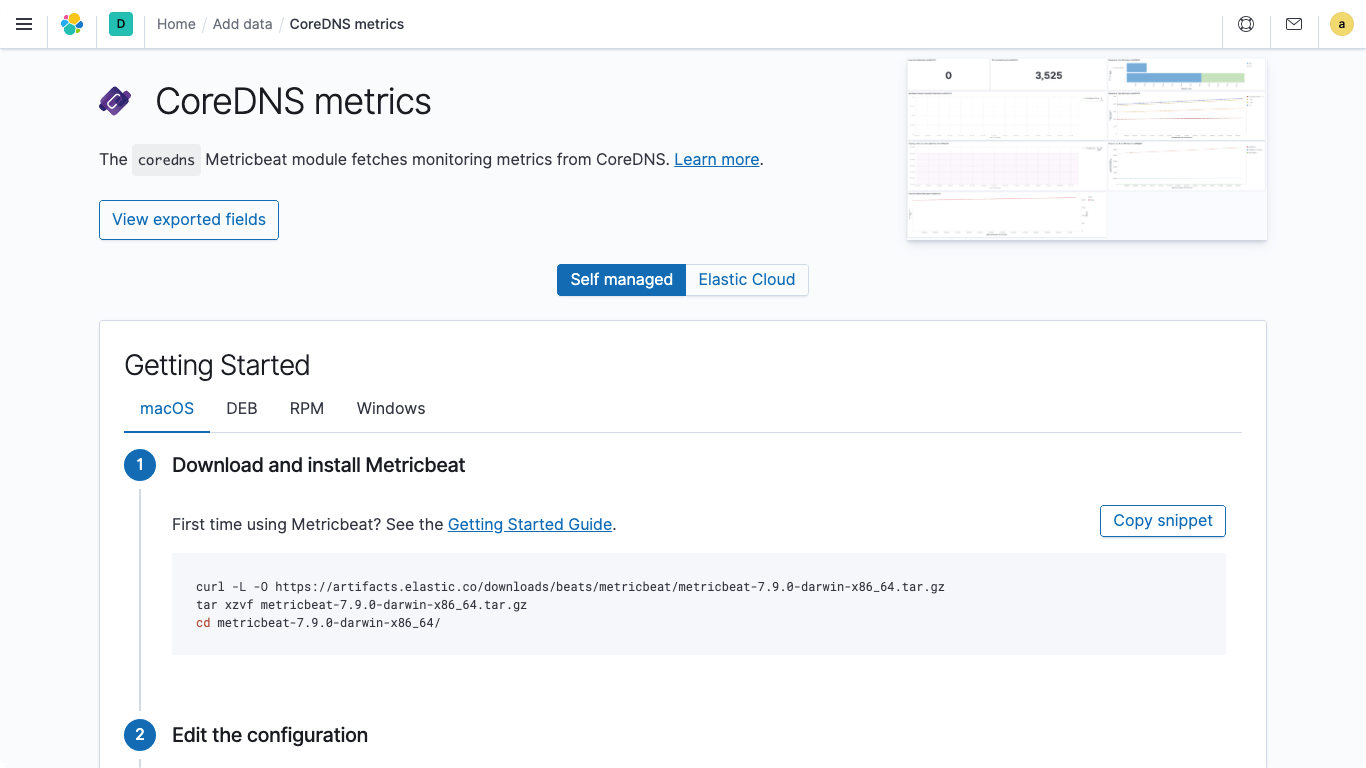
Elastic provides integrations to ingest logs and metrics data from hundreds of platforms and services. These integrations not only give an easy way to add new sources of data, but they also ship with out-of-the-box assets like dashboards, multiple visualizations, and prebuilt pipelines that can, for example, extract specific fields out of logs. Elastic provides Metricbeat and Filebeat for shipping logs and metrics data to Elastic Stack. All integrations supported by Metricbeat and Filebeat have easy-to-follow instructions right in Kibana.
As you expand into other areas of observability (and perhaps security) you’ll find yourself with even more shippers and agents. Configuring and managing a fleet of agents can become complicated, especially in large enterprise environments — you’ll need to manage agent deployments, update config files, and manage the data (which many teams already do today). We wanted to improve that. In release 7.8 we introduced two new components: Elastic Agent and Fleet that provide a major improvement of sending operational data to Elastic.
- Elastic Agent is a single agent for collecting logs, metrics, and other types of data. It’s much easier to install and manage than manually maintaining discrete integrations.
- Fleet is a new Kibana app that helps you with two things: quickly enabling integrations for platforms and services of your choice, and centrally managing an entire fleet of Elastic Agents.
What about your existing monitoring tools? If you’re using native cloud monitoring services like Stackdriver, Azure Monitor, or tools like Prometheus or statsd, and decide to consolidate your metrics with logs and other data, Elastic provides dedicated integrations for these high-level monitoring tools as well, allowing you to retain your existing instrumentation (e.g., prometheus exporters) and still store your metrics alongside your other operational data for better observability.
I mentioned earlier that shifting to containerized deployments requires rethinking how we monitor our systems in general. This is especially true for traditional monitoring tools that are designed to deal with physical hosts or virtual machines and static infrastructures. In the world of containers, such an approach is no longer sufficient because things are constantly in motion, containers go up and down, services are deployed more frequently, and their IP addresses are unstable and unreliable — things that many monitoring tools are not built to deal with. When we run our applications in containers they effectively become moving targets to a monitoring system, thereby creating the need to auto-detect changes in these environments, such as newly deployed services, scaled instances, or upgrades. The good news is that both Metricbeat and Filebeat have auto-discover capabilities that can track your deployments, detect any changes, and adapt configuration to monitor services as they start running.
All data collected with Elastic’s integrations complies with the Elastic Common Schema (ECS), which is used as a reference across all of Elastic Observability and Security solutions. How does ECS differ from other data models out there? By design ECS is optimized for use in Elasticsearch. It is open source and was created with contributions from our global community. And it considered a wide range of use cases from the start, like infrastructure metrics and logs, APM, security, and many others. Think of ECS as a connective tissue that is used across all Elastic’s solutions to correlate, visualize, and also analyze the different data streams in a unified way.
ECS is not only used at Elastic; we see a growing number of companies adopting ECS and enriching it with their own domain-specific schemas for their use cases. Some organizations are even using ECS as the common data model in their cross-team projects. It’s great to see these examples where Elastic solutions are used to break down organizational silos and bring teams together!
Storing logs and metrics
When it comes to storing data, Elasticsearch is probably best known as a storage system for logs. It’s not surprising: logging was pretty much the first use case for Elasticsearch. But over time we've seen many users storing time series data together with their logs, which makes sense. If you store infrastructure and application logs why not also store metrics that tell you when to look at your logs?
Early on we started investing in Elasticsearch as a store for time series data to enable such use cases by introducing a columnar store. We then added the aggregations framework, which enables grouping and filtering on different dimensions for metrics. To improve our ability to handle numerical and geo data we introduced BKD trees as well as a number of other features to efficiently manage time series data — features like data rollups that allow you to reduce granularity of historical data (i.e., downsampling), and index lifecycle management that allows you to control different retention periods for different phases of data, like hot, warm, cold, and delete.
Making monitoring data actionable
Visualizations
Let’s say we’ve got the ingest working and now logs and metrics are streaming to Elastic. The first thing we want to do is to view this data in a meaningful way. Some monitoring tools leave the part of creating or searching for data visualizations to the user, but we think that such views are essential, so Elastic provides prebuilt visualizations and dashboards with every supported integration. This means that as soon as you start collecting logs or metrics you can quickly pull up a dashboard and see what’s happening with your systems and services in no time.
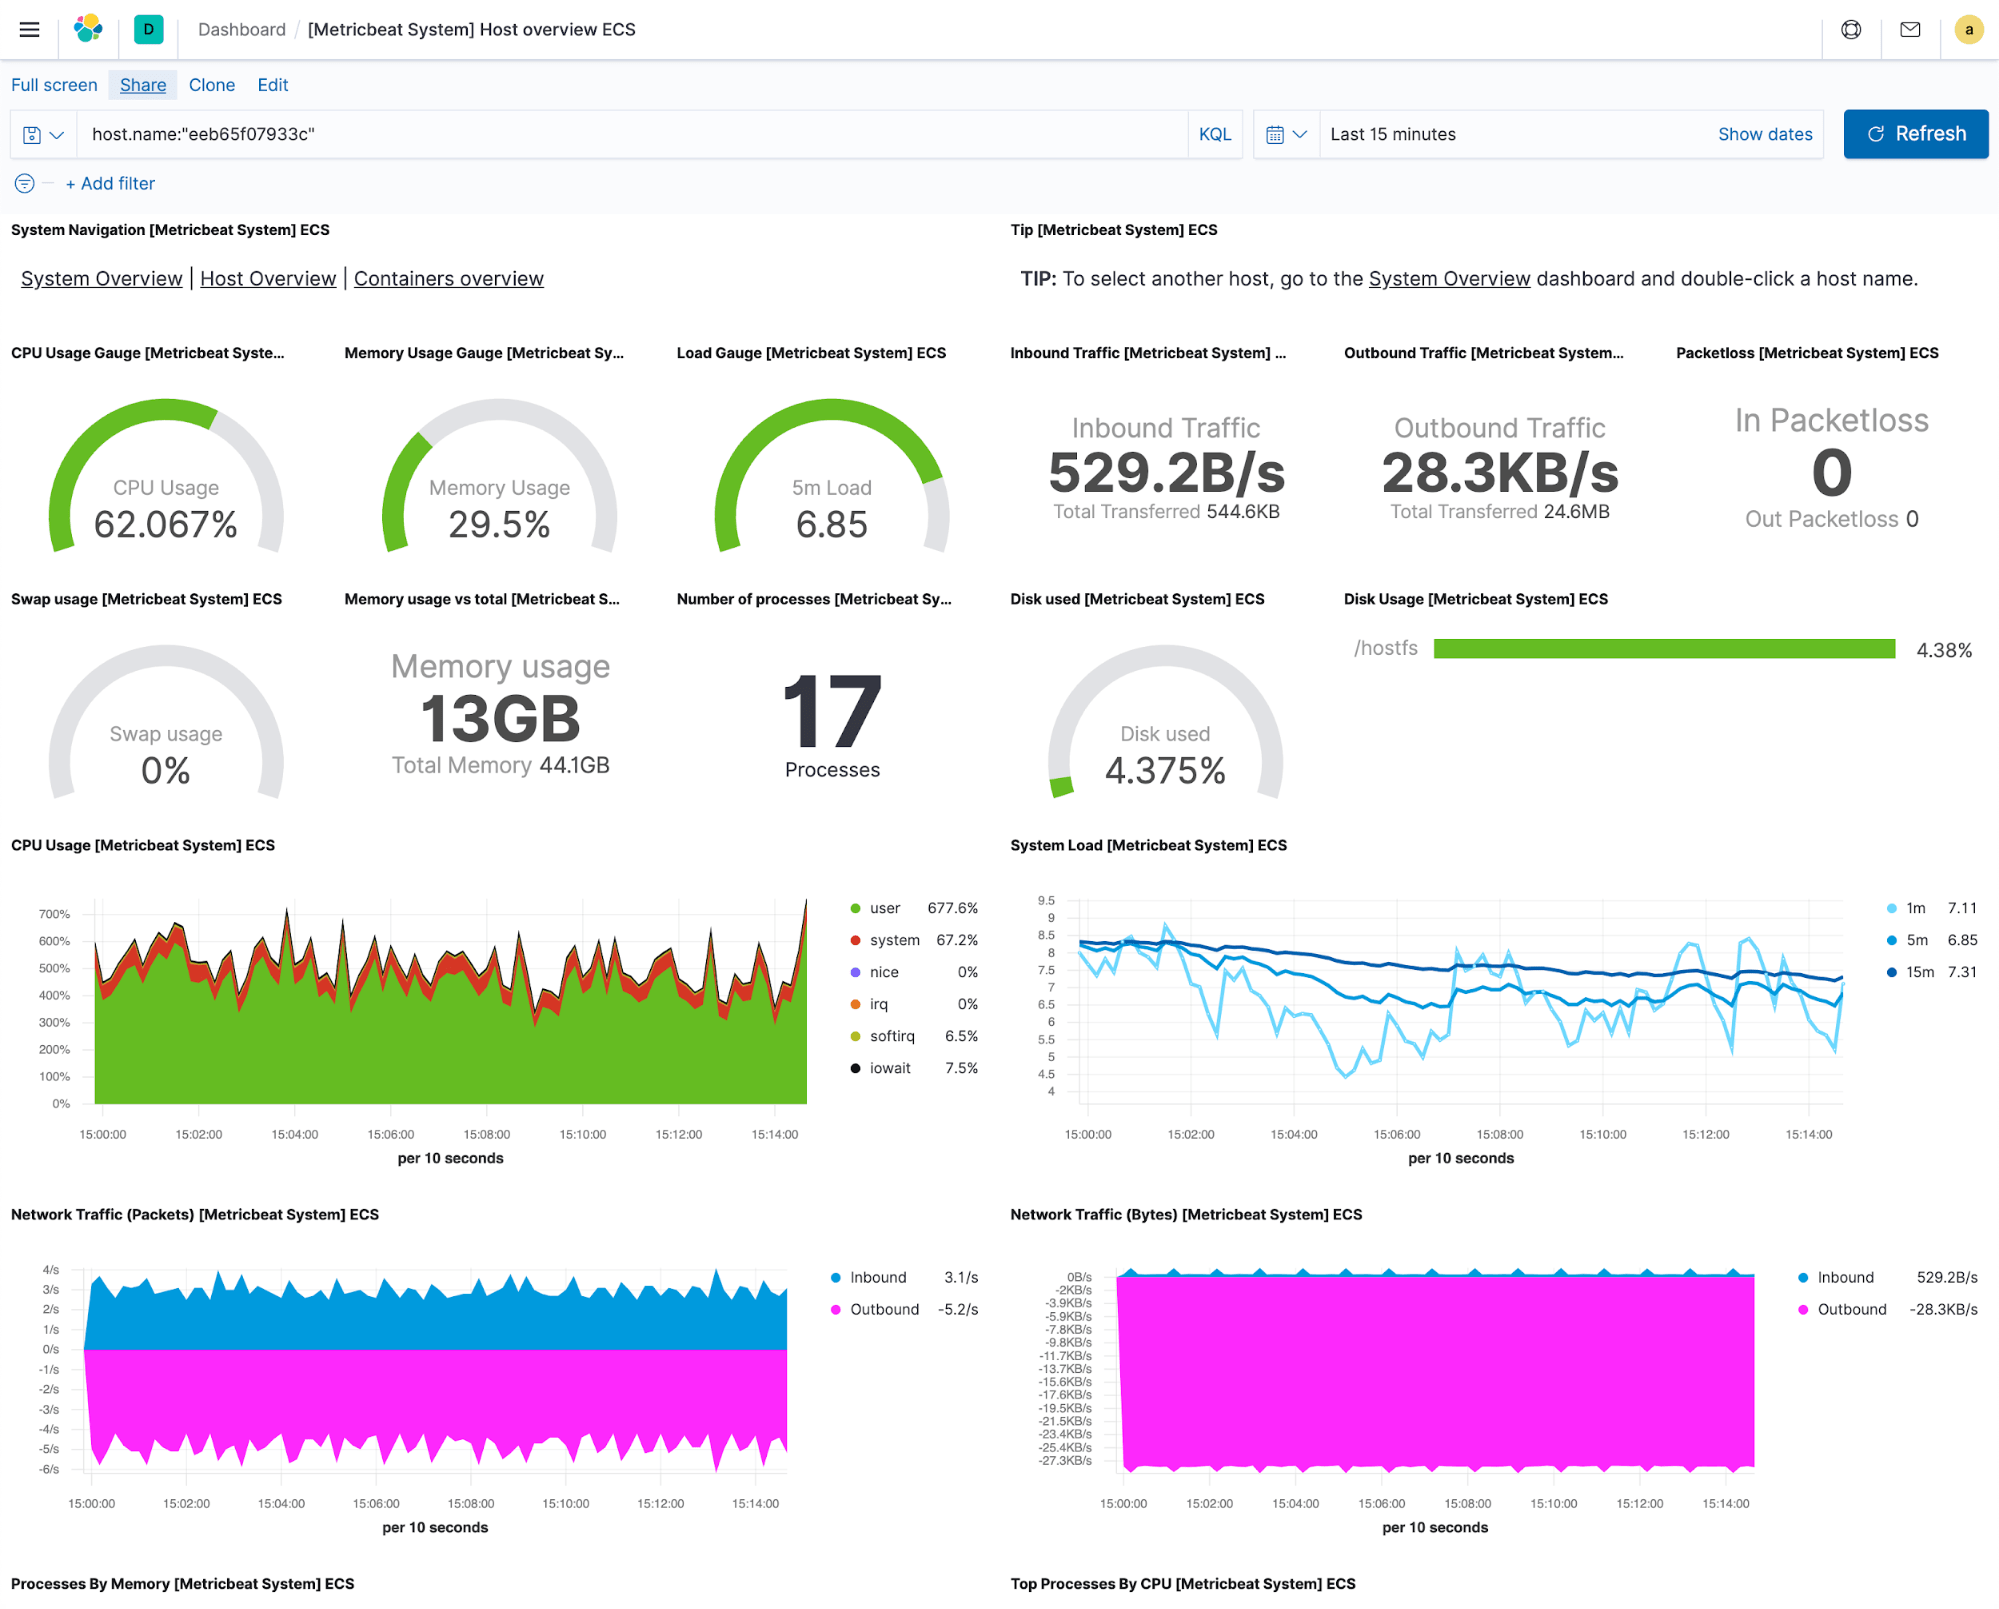
All of the visualizations that make up the predefined dashboard are reusable, which means that you can cherry pick the ones that you see particularly useful and build custom dashboards for your specific needs, mixing and matching from different integrations to get answers for the questions that you have. Moreover, you can also create custom dropdowns to filter, or drilldowns to navigate from one dashboard to another without losing the context, which is quite neat because it really helps you to streamline your troubleshooting workflows.
In addition to dashboards and visualizations, Elastic provides curated apps for logs, metrics, and availability, all of which are designed to increase visibility into your infrastructure.
The Metrics app gives you the ability to see your entire infrastructure in one place. It doesn’t matter if you have geographically-distributed data centers, if you’re running Kubernetes in multiple clouds, or if you have a setup where everything is thrown into the mix. It provides a single pane of glass for all your resources, where you can group them by infrastructure providers, geographical zones, or pretty much any field of custom tags that you might be using to distinguish between your staging and production environments. From this view you can see more detailed metrics and check logs, application performance, or uptime information for any resource. What makes it possible is the fact that Elastic is used as a single data store for all operational data, which allows us to build curated views, link them together for simpler navigation, and make infrastructure monitoring a more streamlined experience.
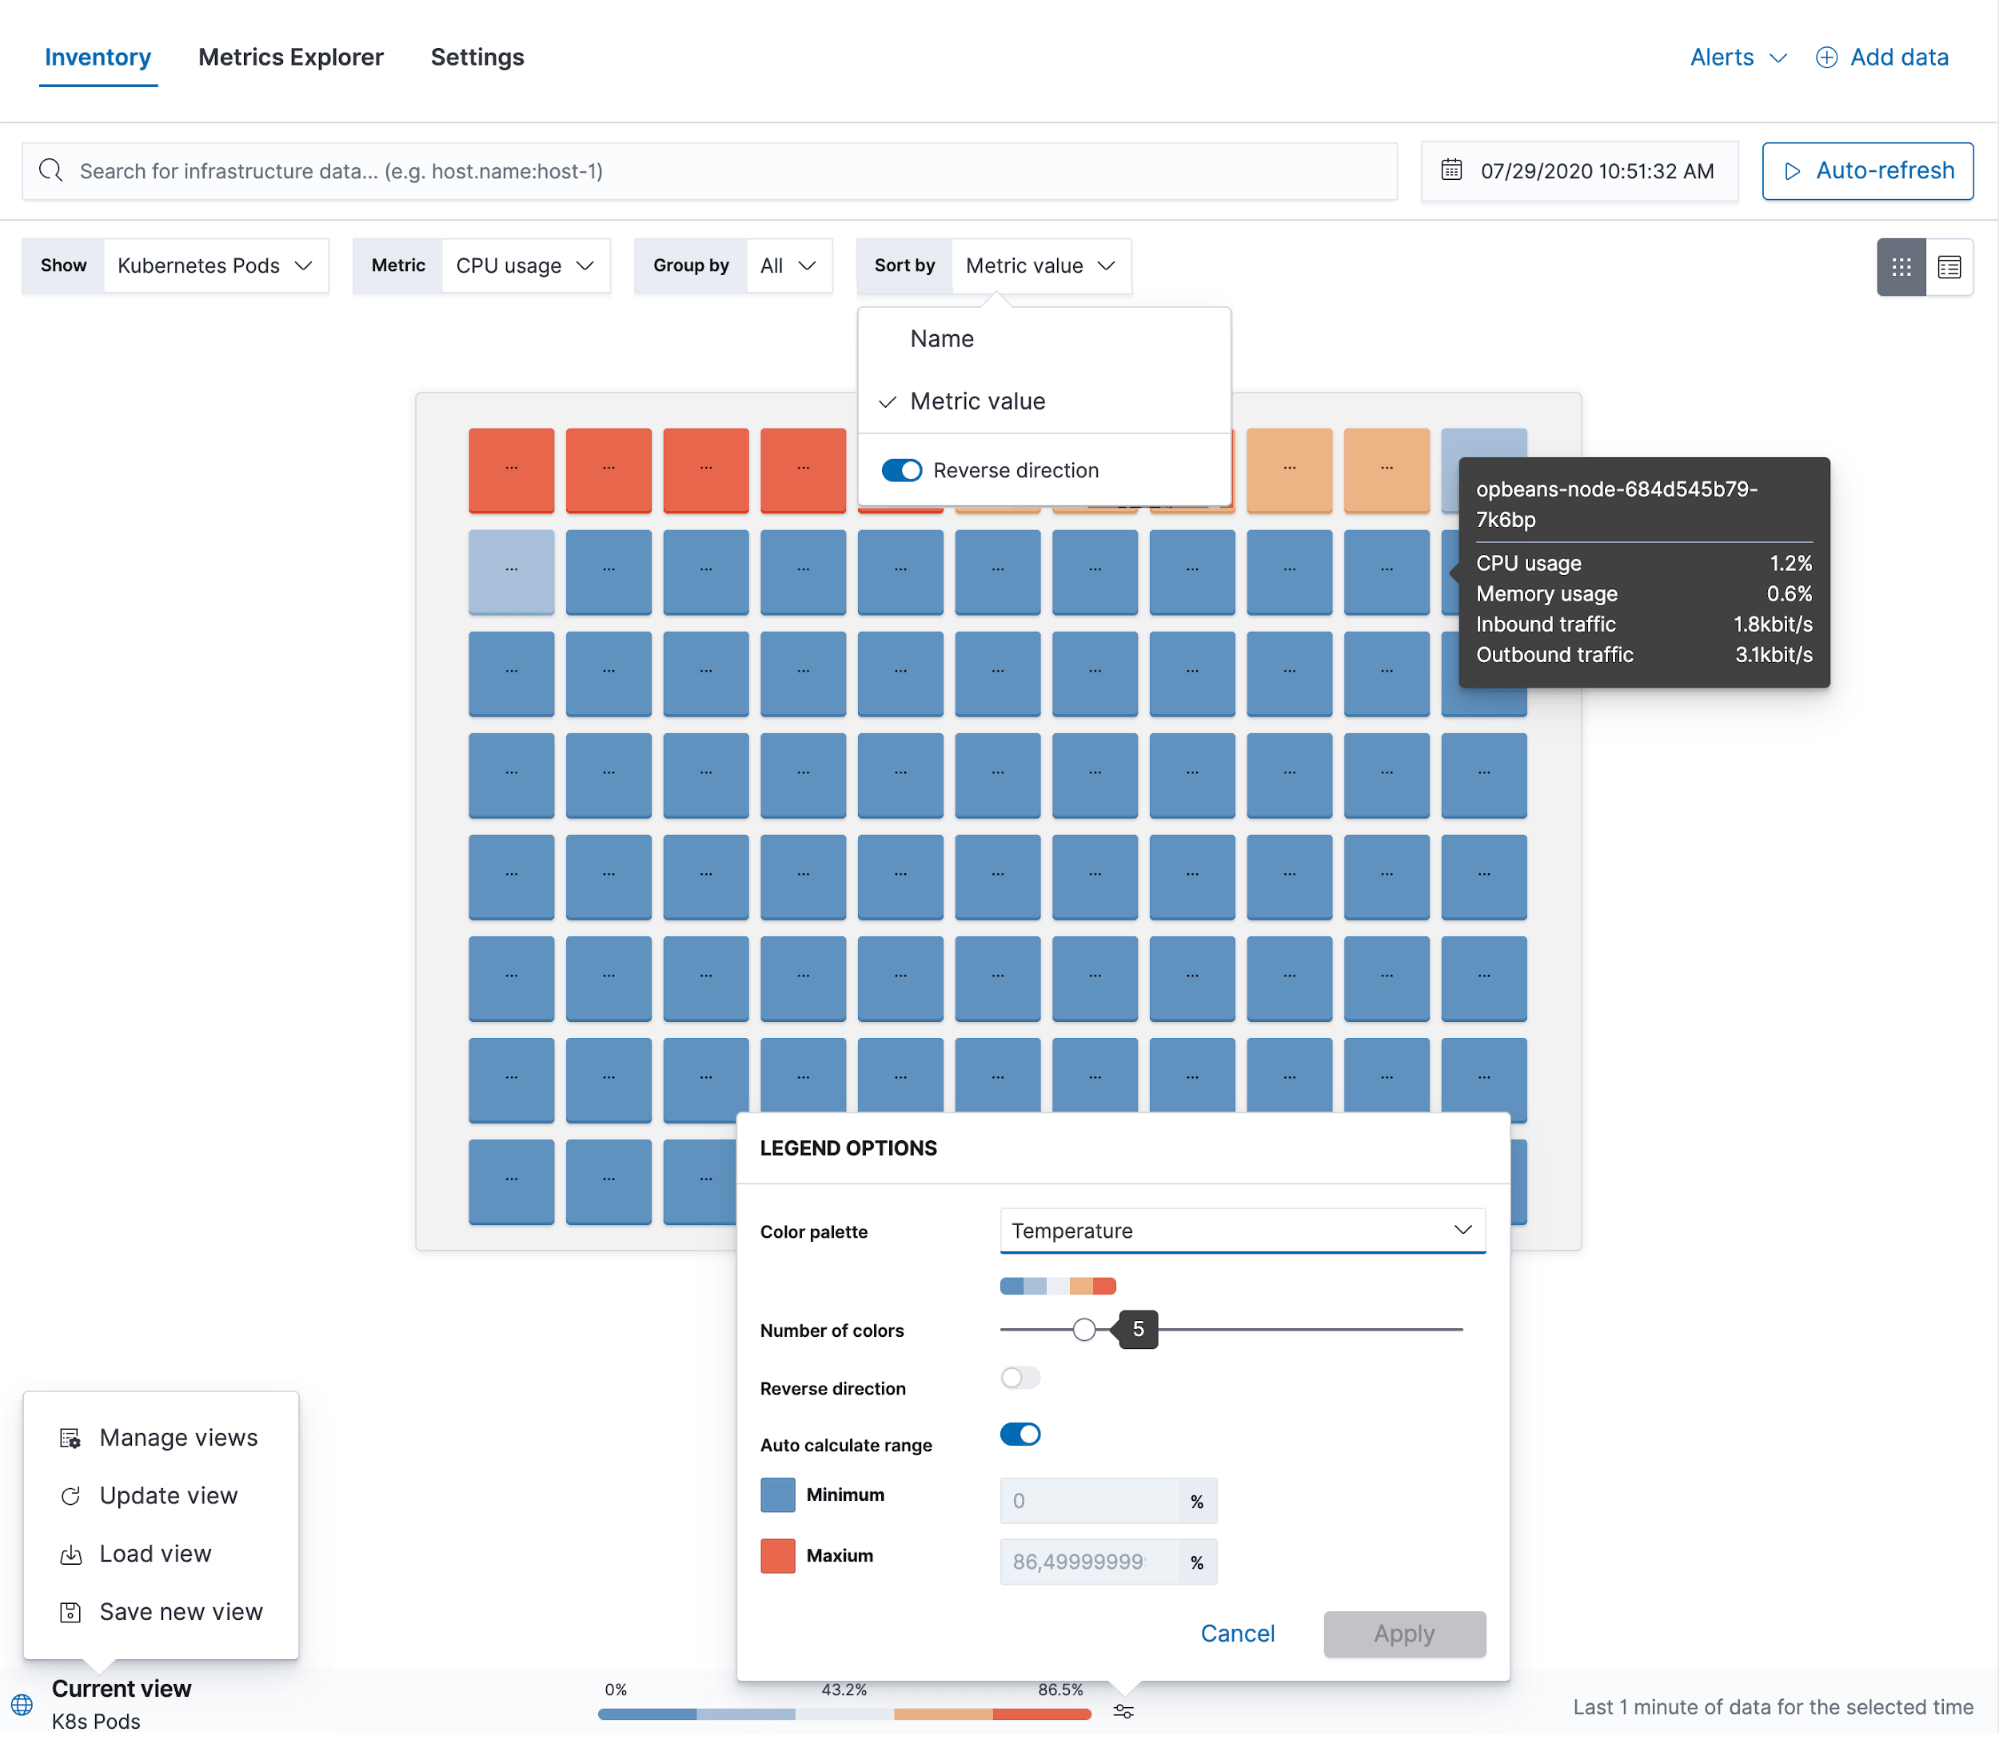
The Metrics app also provides a Metrics Explorer, which is helpful for troubleshooting as it allows you to overlap different metrics to see if there’s any correlation between them. From here you can also create new visualizations or threshold alerts.
The Logs app is basically a tail -f for your entire infrastructure — it consolidates all log streams and shows real-time and historical logs in one view. Behind the scenes logs are correlated with metrics, which makes it much easier to follow the trail while investigating problems. In this app, you can see details for every log line and also see what happened before and after the line was written. And just like every other observability app in Kibana, it goes beyond just read-only views and lets you analyze and act on anything suspicious with the power of alerting and machine learning.
Alerting
Alerting is one of the foundational blocks for essentially all monitoring use cases because it helps detect and respond to any issues across the entire infrastructure. Thanks to the new alerting framework in Elastic we now provide multiple types of alerts that are optimized for different data streams.
- Metrics alerts can be easily configured for any type of deployment, be it physical or containerized, which means that these alerts can automatically cover newly created resources. Filters let you control what parts of your infrastructure an alert should cover. You can also configure an alert once, and have it automatically split per field of your choice, like fire an alert for every host, fire an alert for every disk on every host.
- Log alerts are optimized for log data and let you create alerts based on fields matching a phrase, or based on how often a certain field is logged.
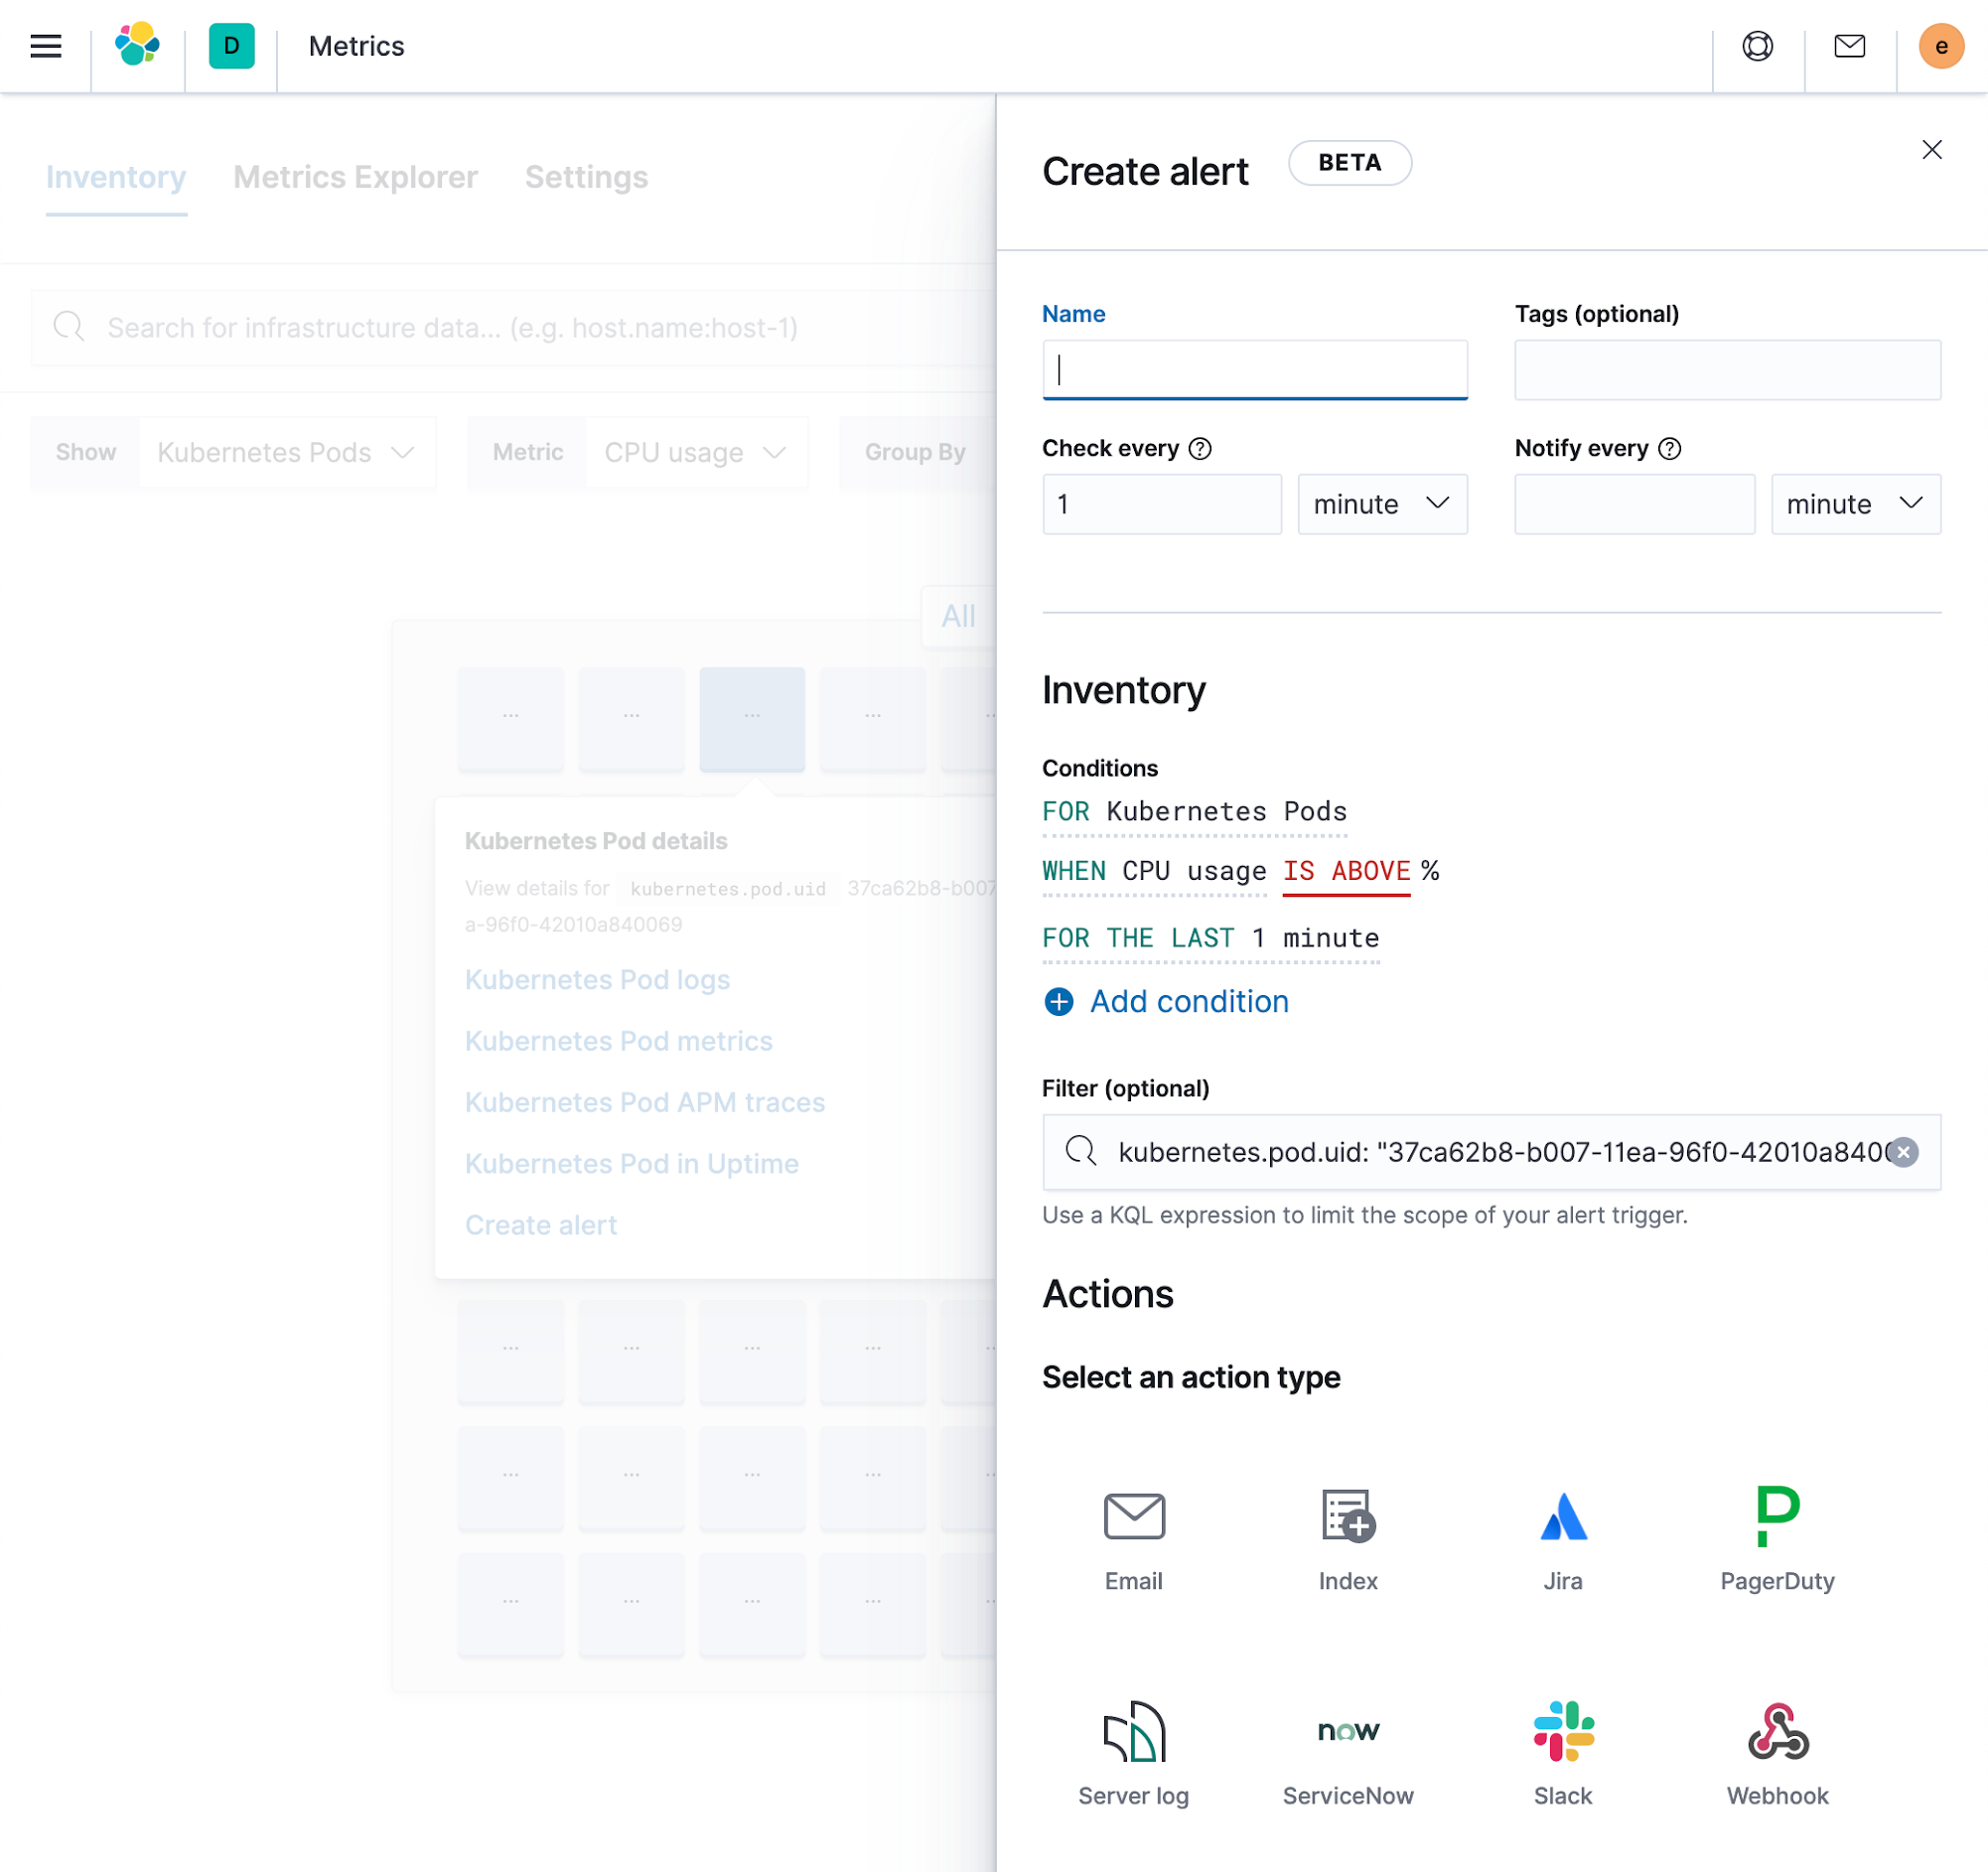
All alerts can be created and managed from a central place in Kibana, but they’re also embedded in the respective apps which makes them really easy to use in day-to-day operations.
Machine learning and anomaly detection
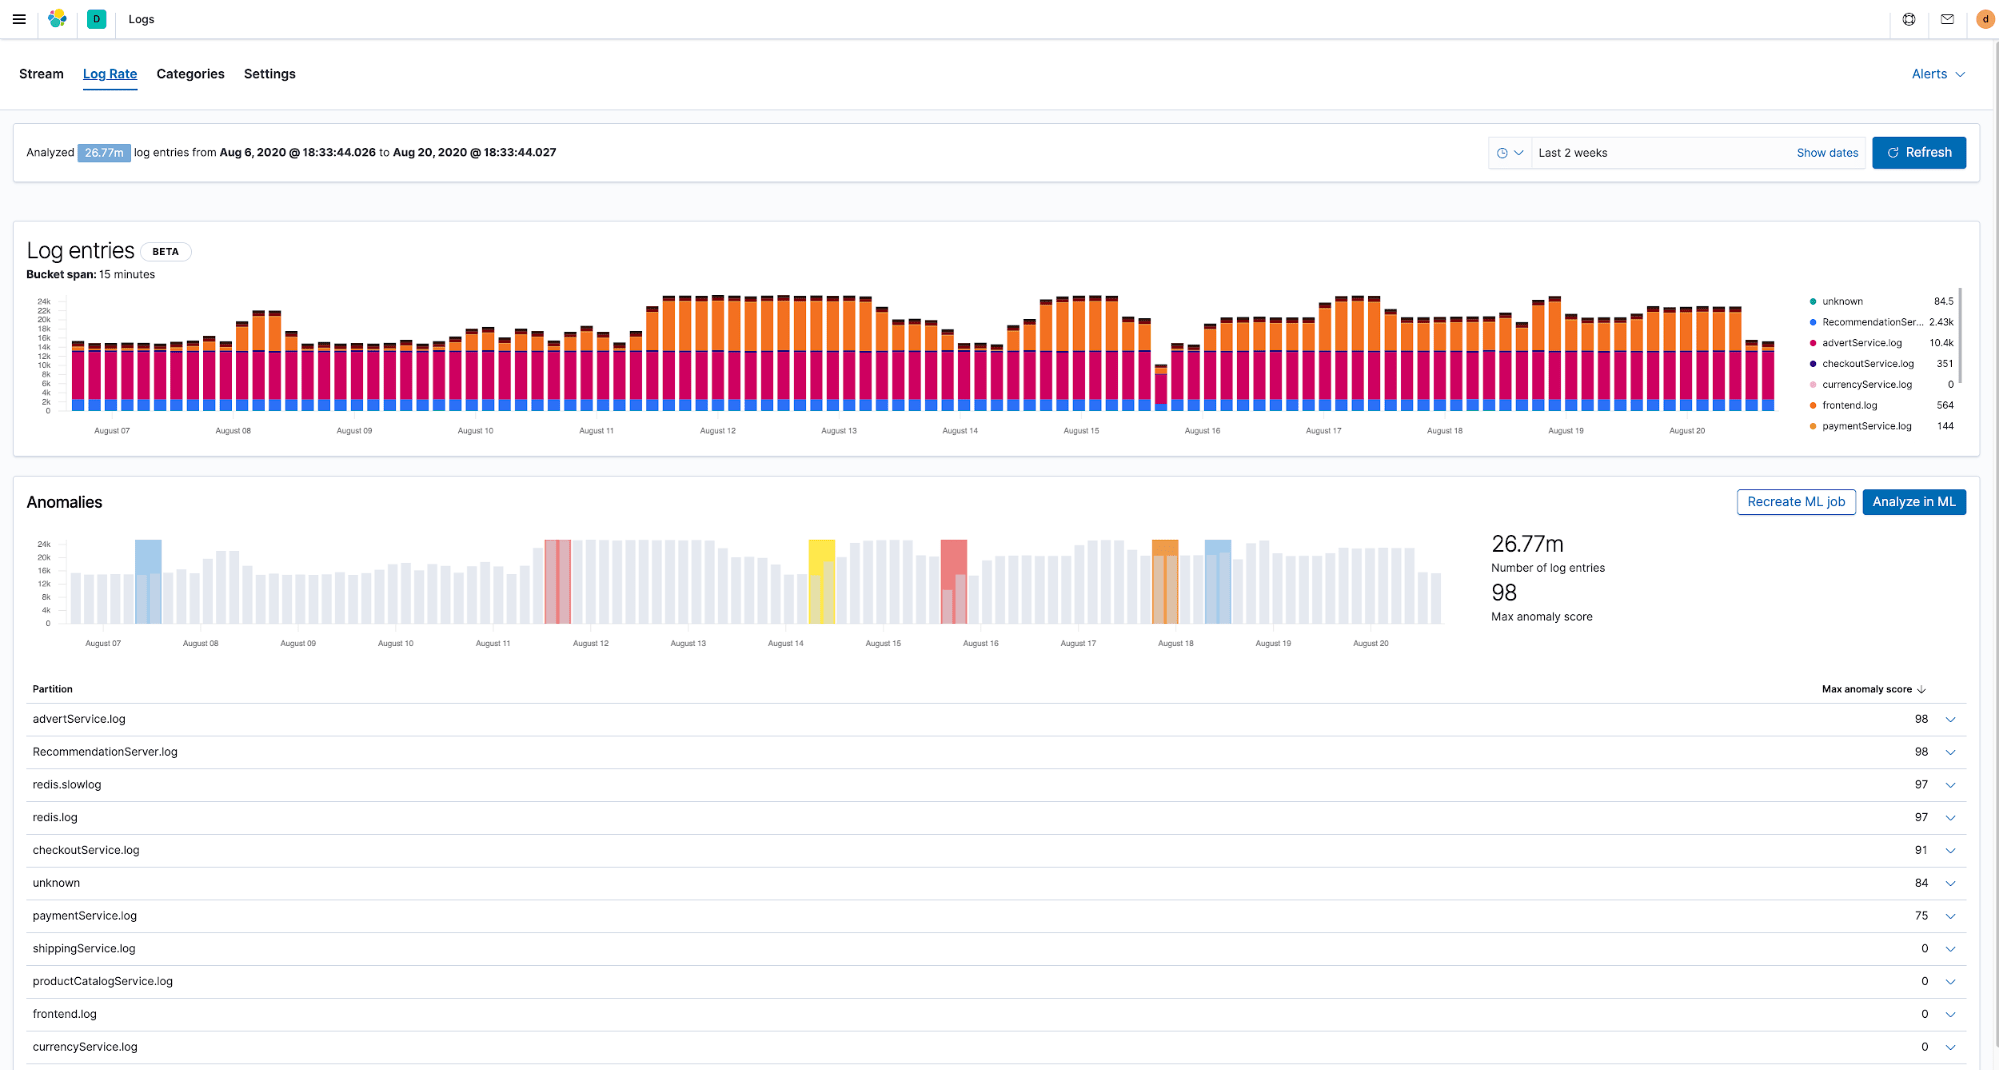
Infrastructures today produce a lot of operational data that’s growing all the time, making it virtually impossible to analyze different data streams manually. In fact, this is becoming a serious issue for organizations that are looking for ways to automate problem detection. Therefore an important part of a modern monitoring solution is the ability to auto detect any abnormal behavior in deployment environments before something bad has happened.
The good news is that once your operational data is in Elasticsearch, it’s ready for analysis. The predefined machine learning jobs for anomaly detection are already optimized for logs and metrics and are integrated with Kibana apps where you need them. For example, they can automatically detect if there are any anomalies with rates at which infrastructure logs are generated or find patterns and automatically group your logs into categories.
Elastic’s machine learning capabilities are not limited to anomaly detection. You can use other algorithms like classification, outlier detection and more across a wide range of use cases involving infrastructure data.
Multiplying value with the Elastic Stack
Because everything is just another index in Elastic, you can use any Elastic feature with your monitoring data. With different visualizations in Kibana you can build views that are meaningful to everybody in your organization, like flexible and dense dashboards built with Lens and TSVB (formerly time series visual builder, a powerful tool for building annotatable metric and histogram visualizations) that your engineering teams find valuable, or live infographics with Canvas that translate complex data into trends that business owners find valuable.
Everything that you store in Elastic can be accessed either from UI or API with a query language that’s familiar to you, like SQL or PromQL. PromQL is becoming popular and thanks to our Prometheus integration you can write results of your PromQL queries into Elastic. This is especially useful if you don’t want to store raw metrics and are only interested in already processed data.
You can also combine your infrastructure monitoring with security. The line between observability and security is disappearing because essentially it’s the same data that we use for monitoring our infrastructures that is also relevant for securing it. The Elastic Security solution, just like Observability, is built on top of Elastic Stack and lets you easily detect and prevent security threats in your infrastructures.
Conclusion
In this blog we listed the needs for modern monitoring solutions and showed how Elastic can address them. The Elastic Observability solution and Elastic Stack can help you build the ultimate monitoring platform where you and your teams can securely ingest all your operational data, interact with it and be successful.
But don’t take our word for it, try it yourself. Spin up a cluster in a free trial of Elastic Cloud or download the latest version from our website and then tell us what you think.