Kibana Lens
Data visualization. Simply.
Kibana Lens is an easy-to-use, intuitive UI that simplifies the process of data visualization through a drag-and-drop experience. Whether you're exploring billions of logs or spotting trends from your website traffic, Lens gets you from data to insights in just a few clicks — no prior experience in Kibana required.
Drag. Drop. See.
Watch your data transform into visualizations with a single mouse gesture. Drag a field into Lens and get an immediate view of that data. No configurations. No modeling. Just insights.
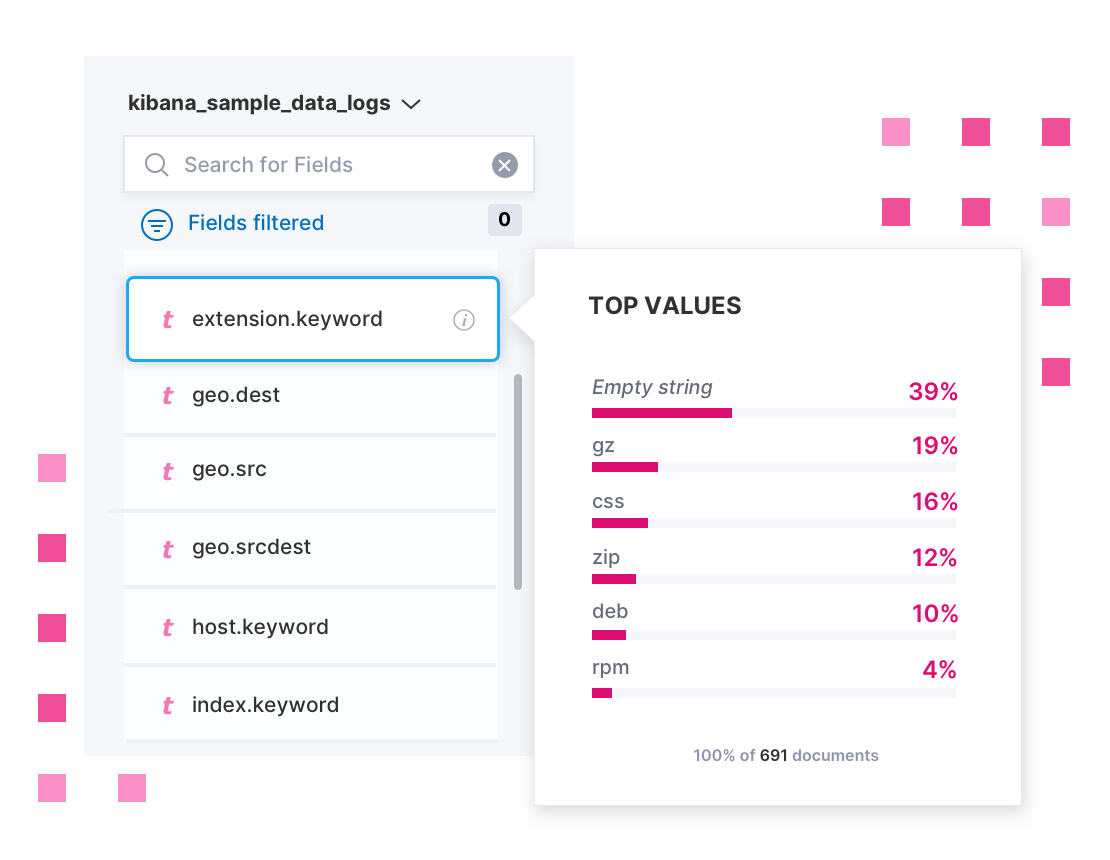
Your data at your fingertips
When creating a visualization, you'll often need to decide which fields from your data to include. Lens provides Elasticsearch data fields upfront, eliminating back-and-forth guesswork. With one click, you can see a breakdown of a specific field's values and confidently select the right data to answer your questions.
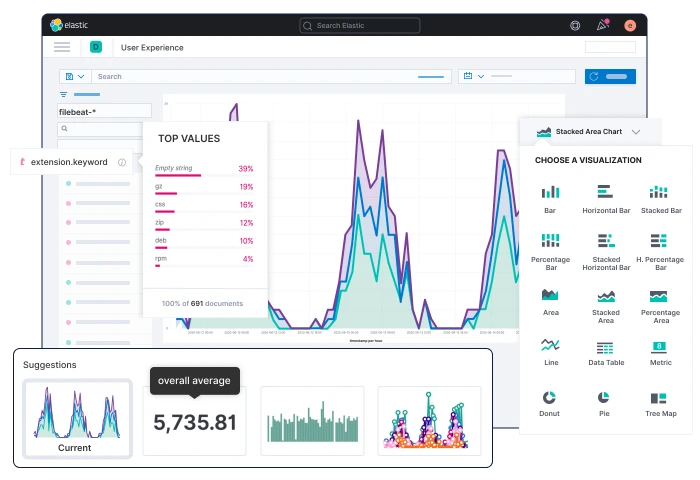
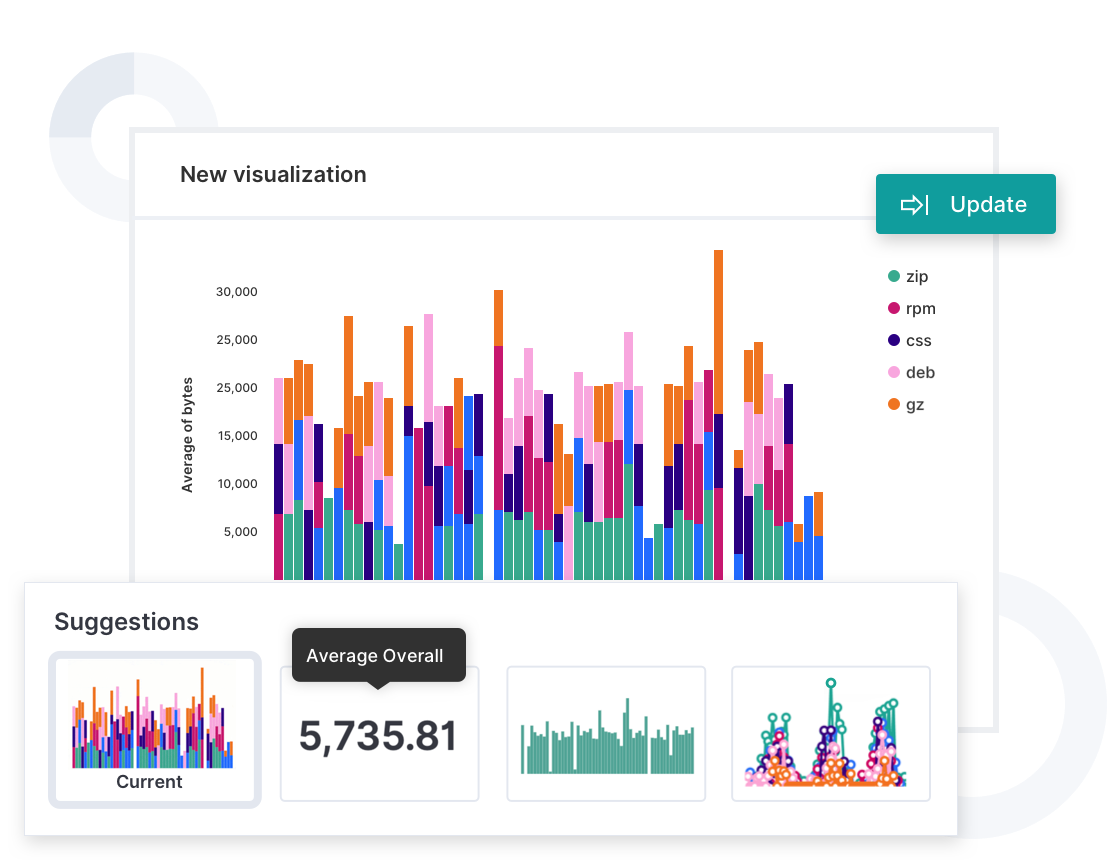
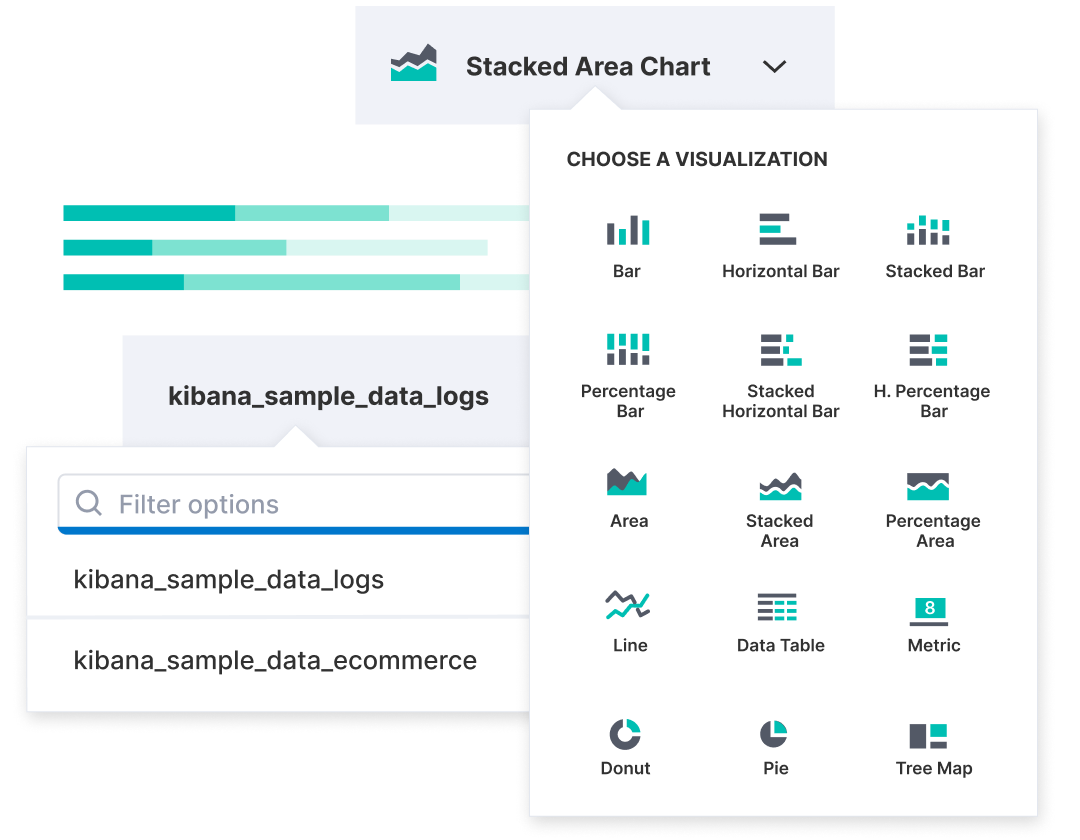
Lens smart suggestions
Starting with the first preview, Lens provides smart suggestions of alternative ways to visualize your data — combining common usage patterns with relevance ranking to present an optimal visualization type. Now, instead of searching for the most impactful way to display your data, you can stay focused on what’s important: your data's story.
Experience a change of heart chart
Relationships with your data can be complicated. You need more flexibility. Lens gives you the freedom to switch between charts, change the underlying data of a chart with another data source, and even combine multiple index patterns into a single visualization. See something interesting in the preview that spurs another idea? Switch data sources with ease to keep the hunt alive and reuse results later as a dashboard panel.
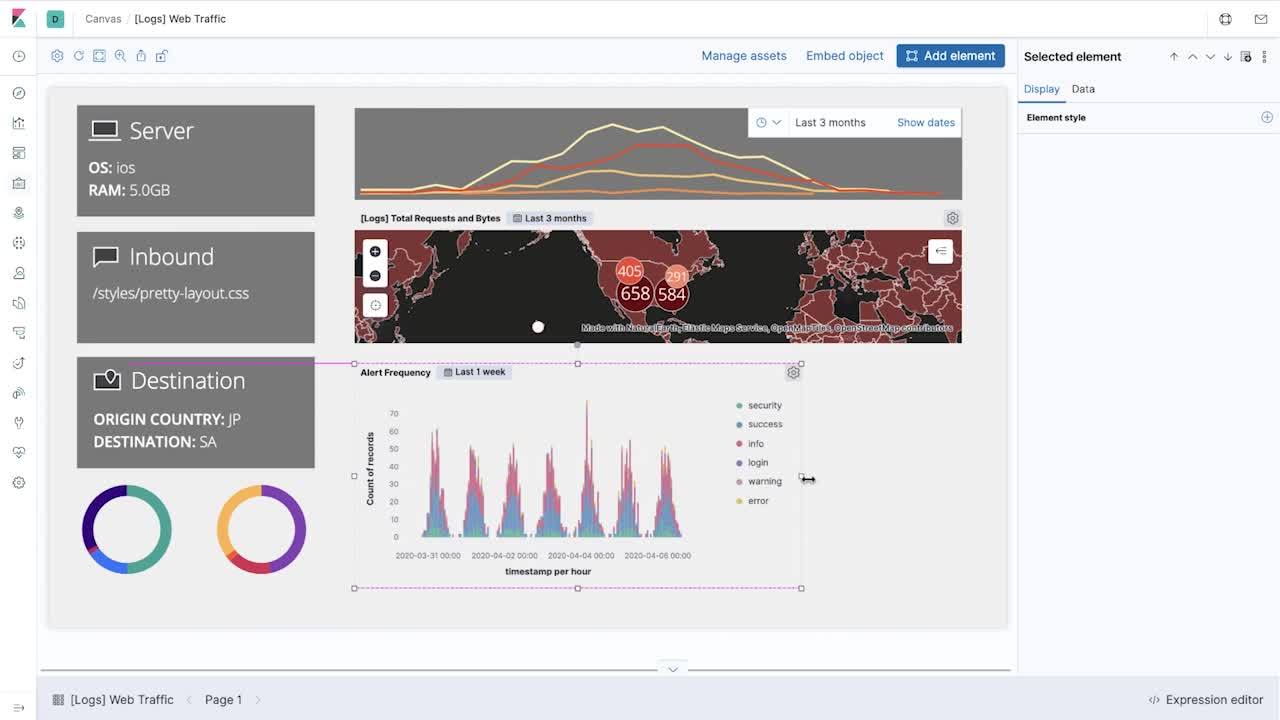
Embed Lens visuals
Display your visualizations in the space that provides the most value and context for your team. Insert Lens visuals into any of your Kibana dashboards or embed them directly into Canvas workpads for data presentation that’s rich and relevant.
Embed Lens visuals