Blogs
Hands-on, insight-driven content about observing your production and development environments using Elastic Observability.
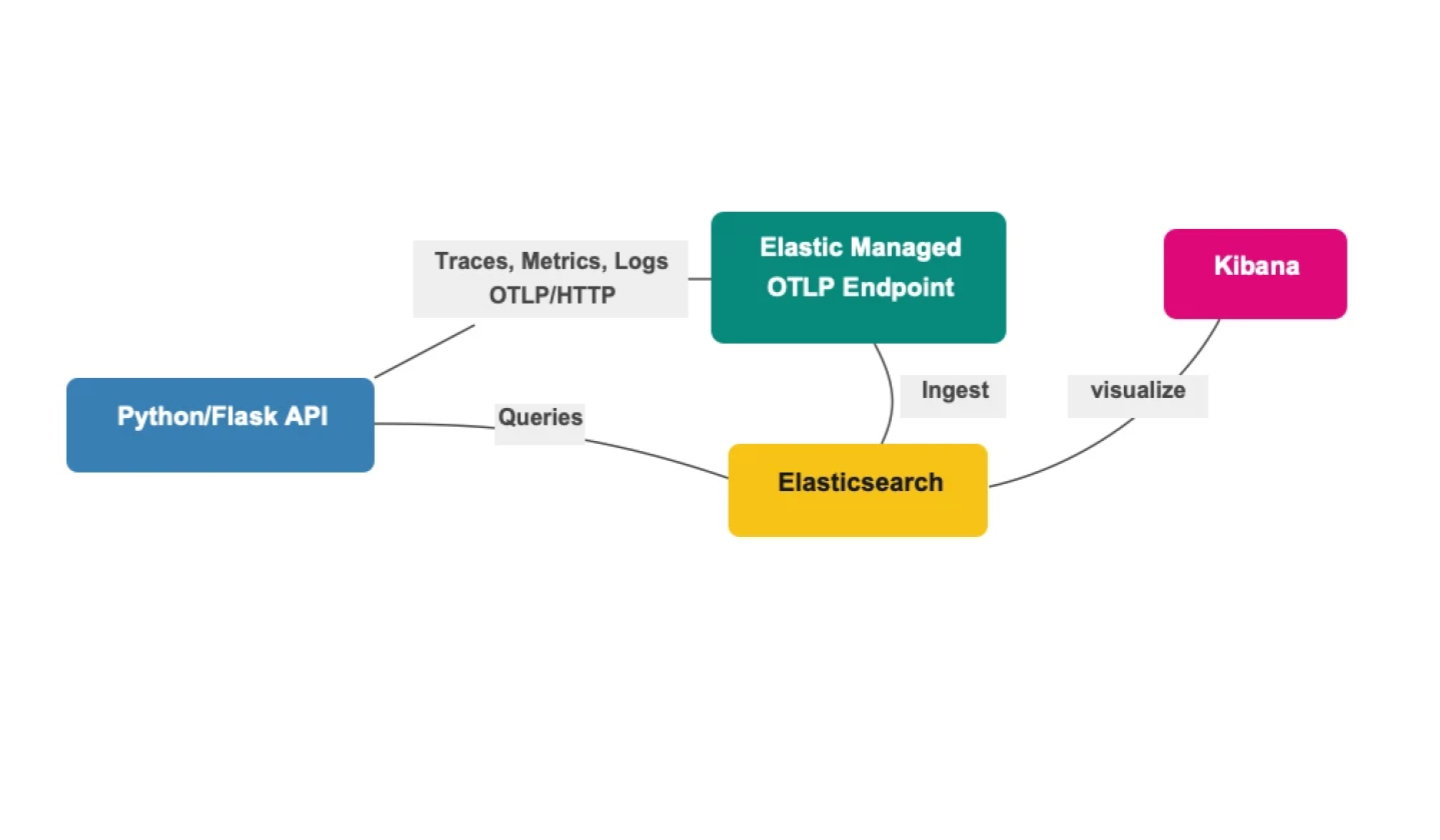
3 signals, 2 env vars, 0 collectors: OpenTelemetry with Python and Elastic's Managed OTLP Endpoint
Instrument a Flask API with OpenTelemetry and ship traces, metrics, and logs to Elastic Cloud using just 2 environment variables, no collector needed.
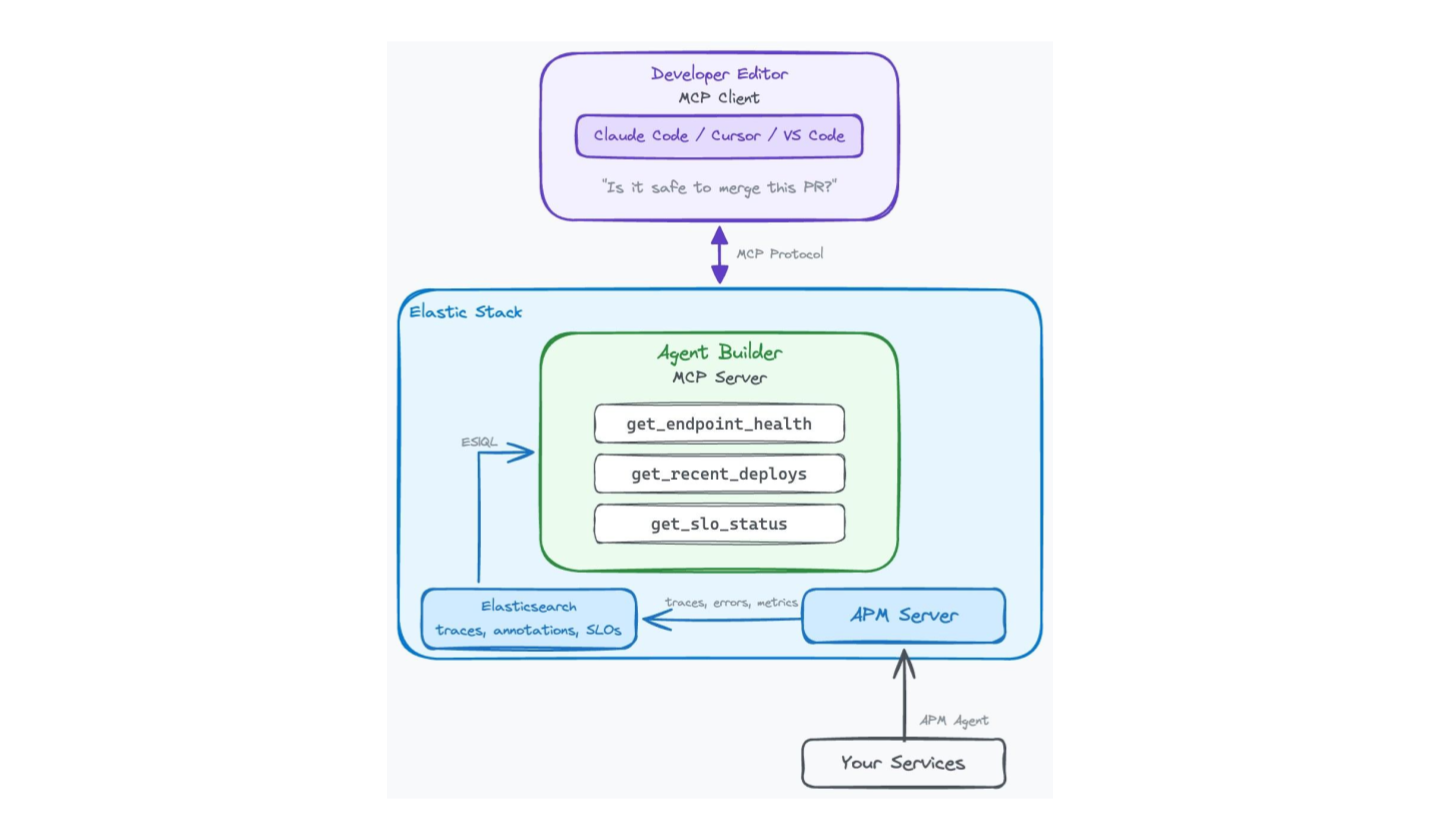
Contextual AI: Stop pinging the SRE: three MCP tools that turn Elastic Agent Builder into your team's runbook
Build three MCP tools in Elastic Agent Builder that read endpoint health, recent deploys and SLO burn rate directly in your editor. Encode your platform team's runbook once; every developer gets self-serve production context without pinging an SRE.
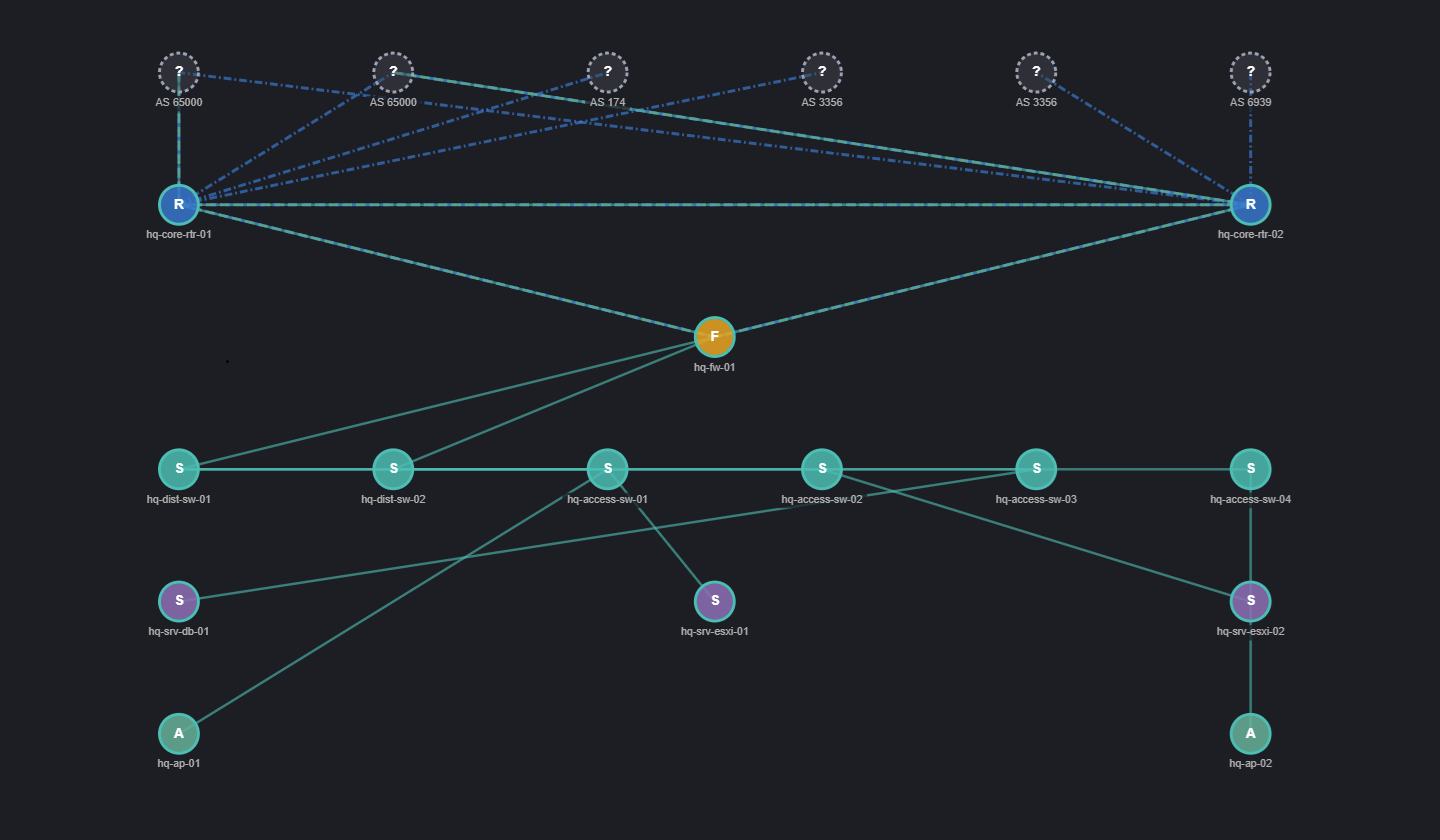
SNMP Topology Data in Kibana: Collection to Canvas
The Network Topology plugin for Kibana provides a ready-to-deploy Logstash pipeline, a structured schema, and a topology view that shows what's connected to what.
Configure downsampling directly in Elastic Streams, no more JSON editing needed
Configure downsampling in Elastic Streams alongside retention and tiers, with a live preview and validation. No more editing ILM or lifecycle JSON.
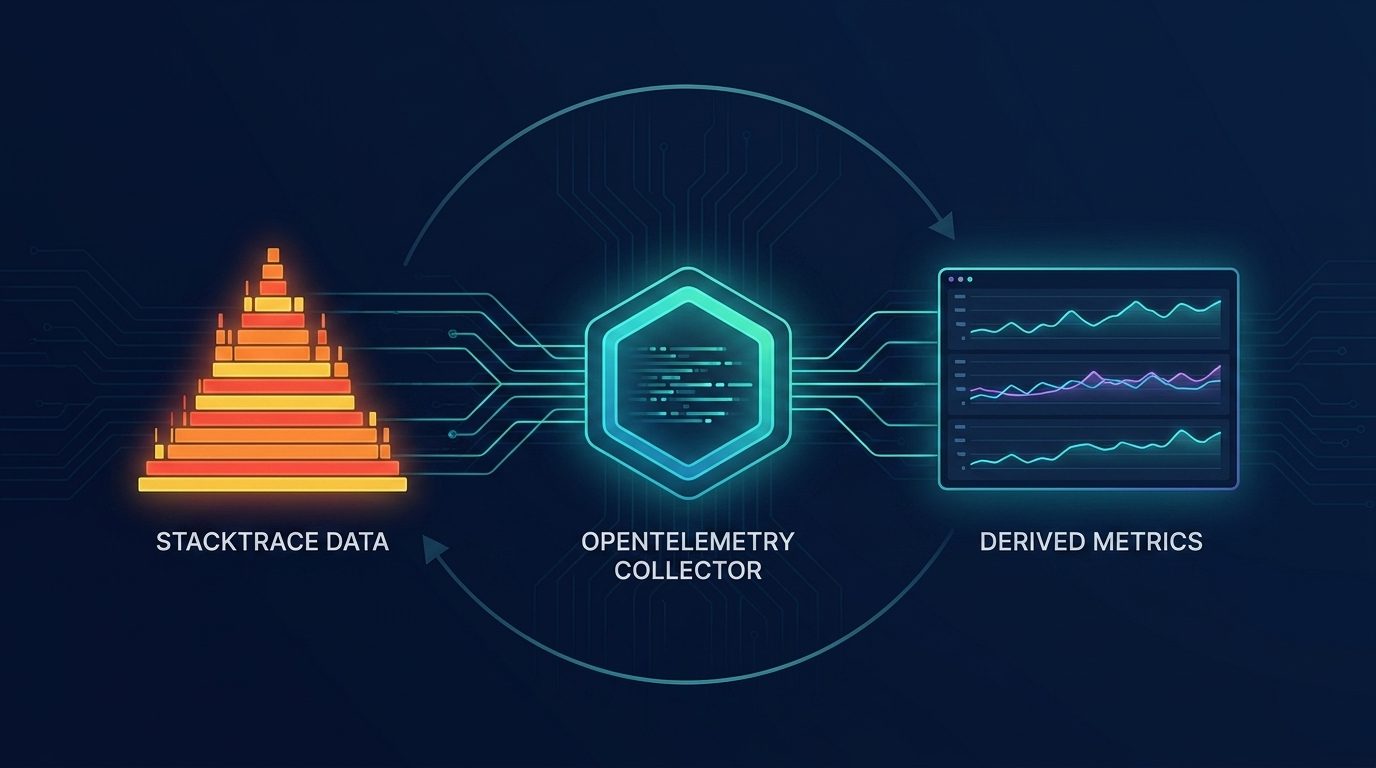
Self-Driving Observability: From Stacktraces to Profiling-Derived Metrics
Profiling-derived metrics turn raw stacktraces into time-series KPIs, unlock continuous profiling for every user and lay the foundation for an observability system that detects, investigates, and acts on its own.
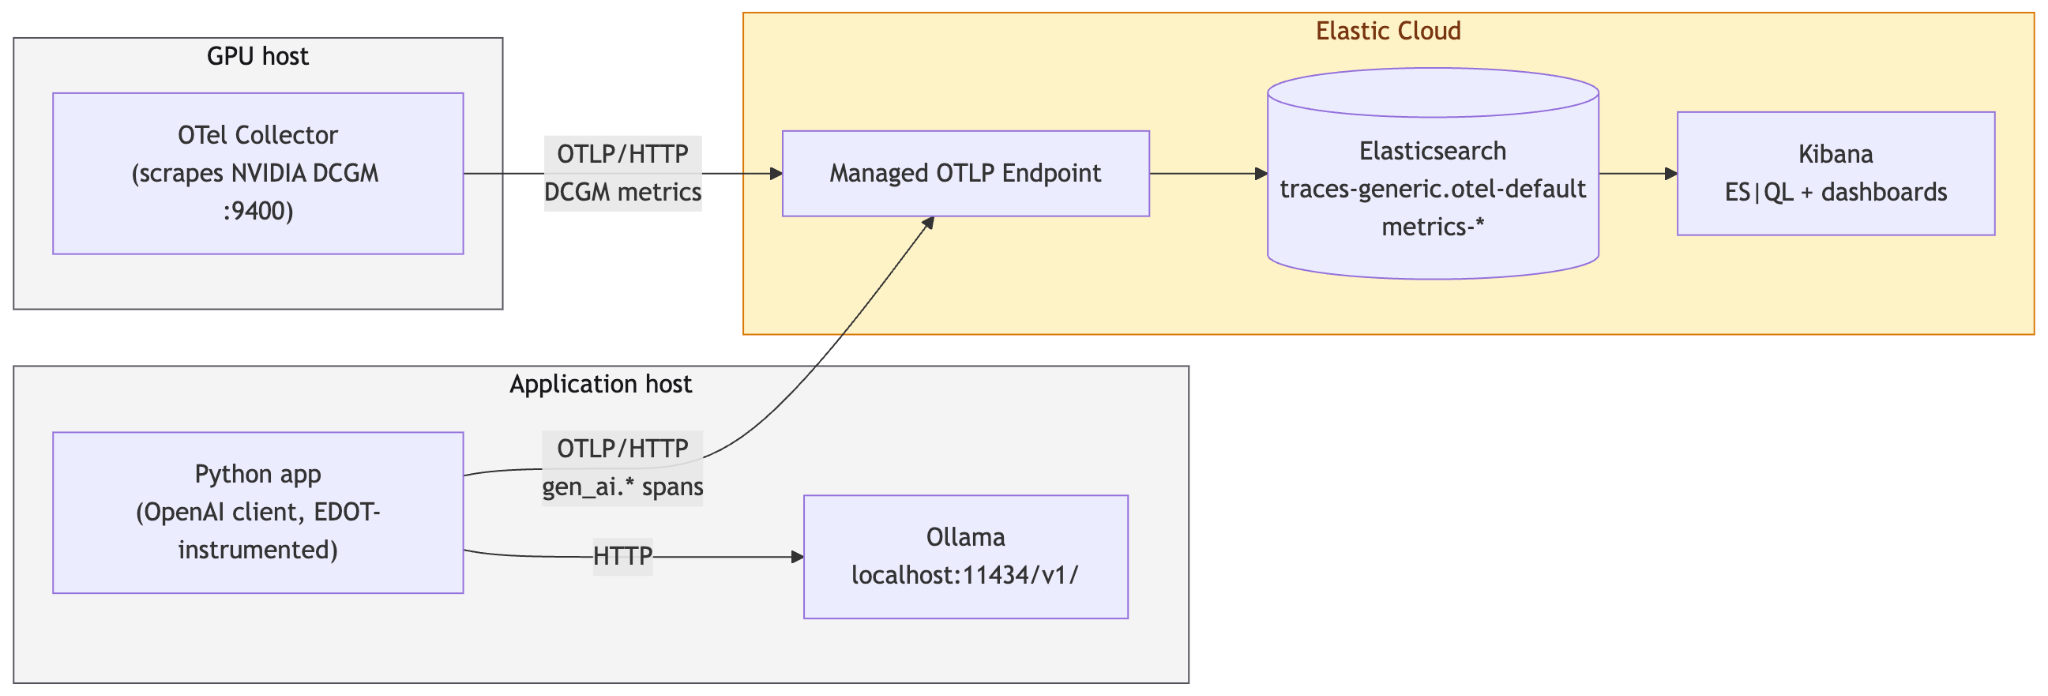
ES|QL queries for debugging LLM latency, cost and GPU saturation
Learn how to investigate LLM latency, token cost and GPU saturation using ES|QL against OpenTelemetry traces and get a root cause, not just a symptom.

30x faster than Prometheus: how we rebuilt Elasticsearch as a leading columnar metrics datastore
Elasticsearch now stores OTel metrics at 3.75 bytes per data point and queries them up to 30x faster than Prometheus. Here's how we rebuilt TSDS and ES|QL.

How Elastic's ML and AI Assistant cut 802.1x triage from 20 minutes to seconds in the NOC
Find out how Network Operations Center (NOC) teams use Elasticsearch, ML, and the Elastic AI Assistant to cut MTTR, tame alert fatigue, and solve network issues fast.
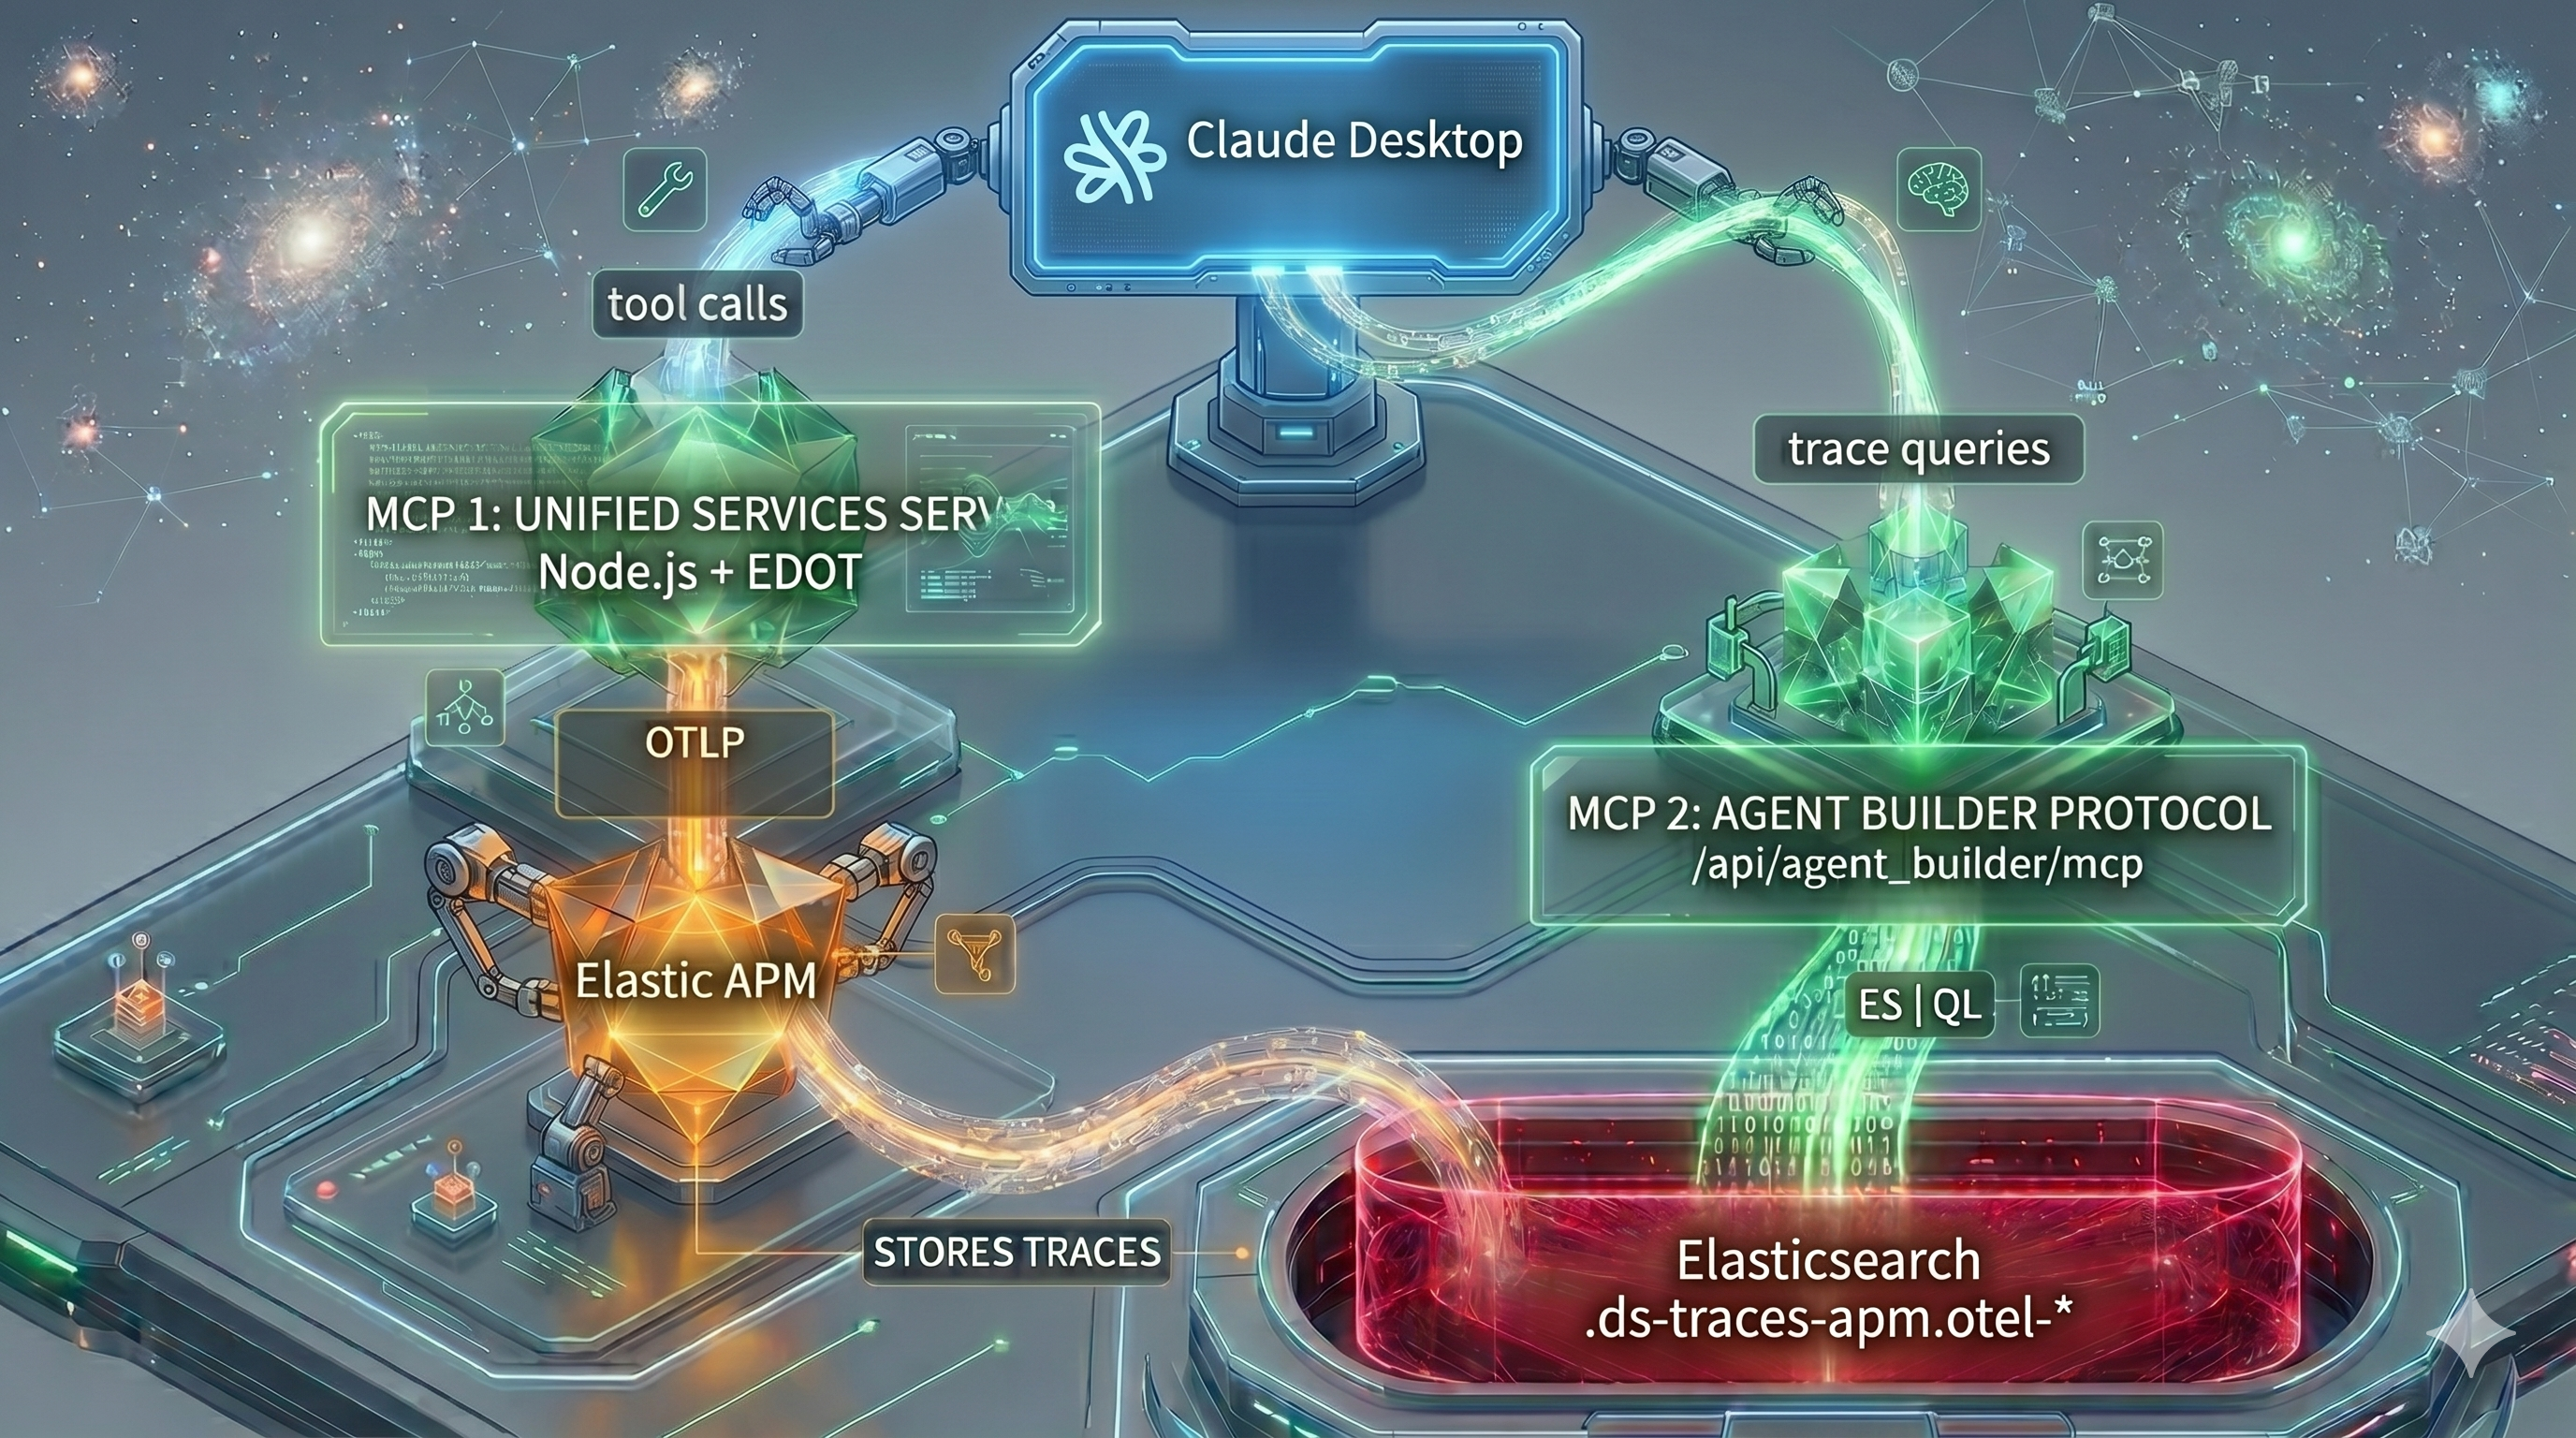
How to trace MCP server tool calls with OpenTelemetry and Elastic APM
Add OpenTelemetry tracing to an MCP server, visualize tool call performance in Elastic APM, and query the trace data from Claude Desktop using the Agent Builder MCP.
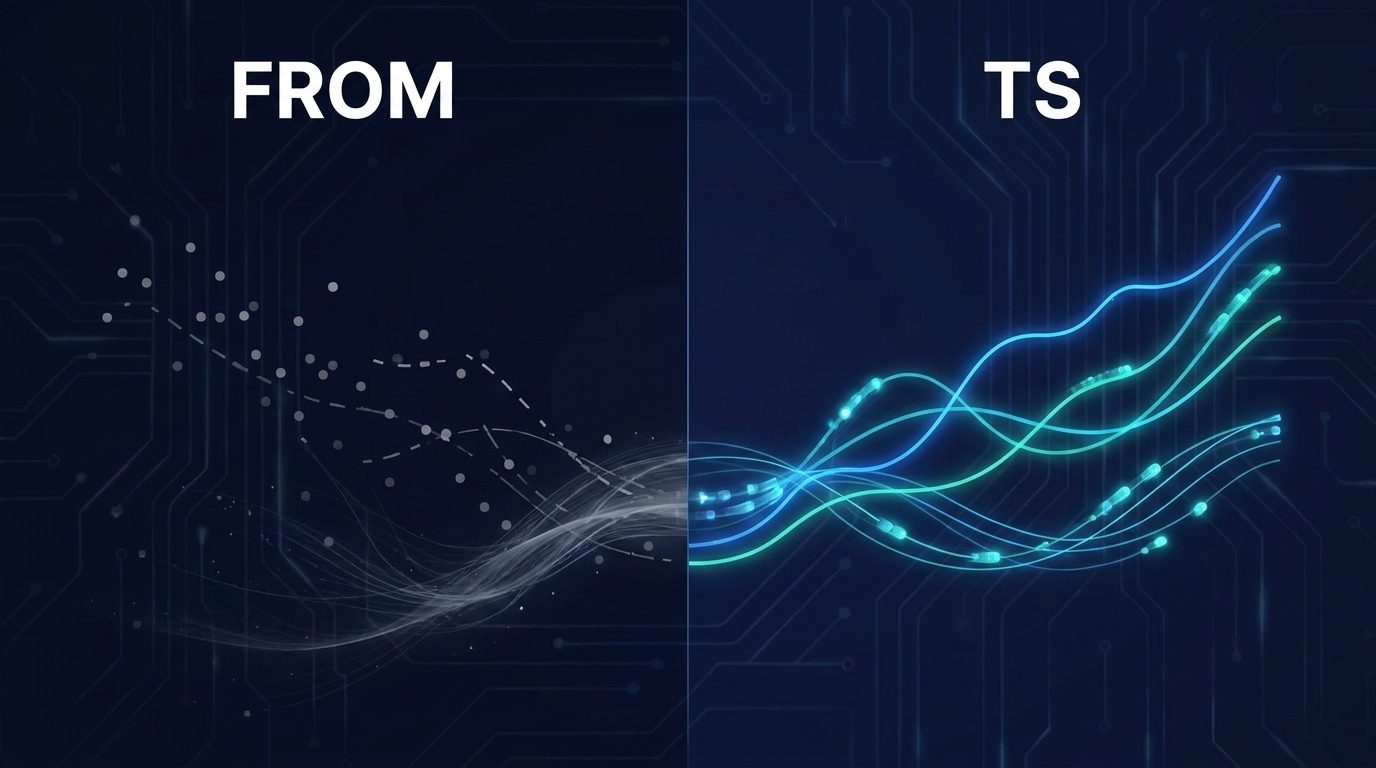
Don't leave metrics on the table: query them with the ES|QL TS command
Recalibrate your mental model for time series queries: learn why FROM can produce inaccurate results for metrics, how TS fixes that, and when to use each command.

Kubernetes observability: MCP specialist agents for safer EKS triage
Scope a specialist EKS MCP agent for cluster checks while the Elastic AI Agent triages; fix a service misconfiguration using the specialist agent in a few prompts.
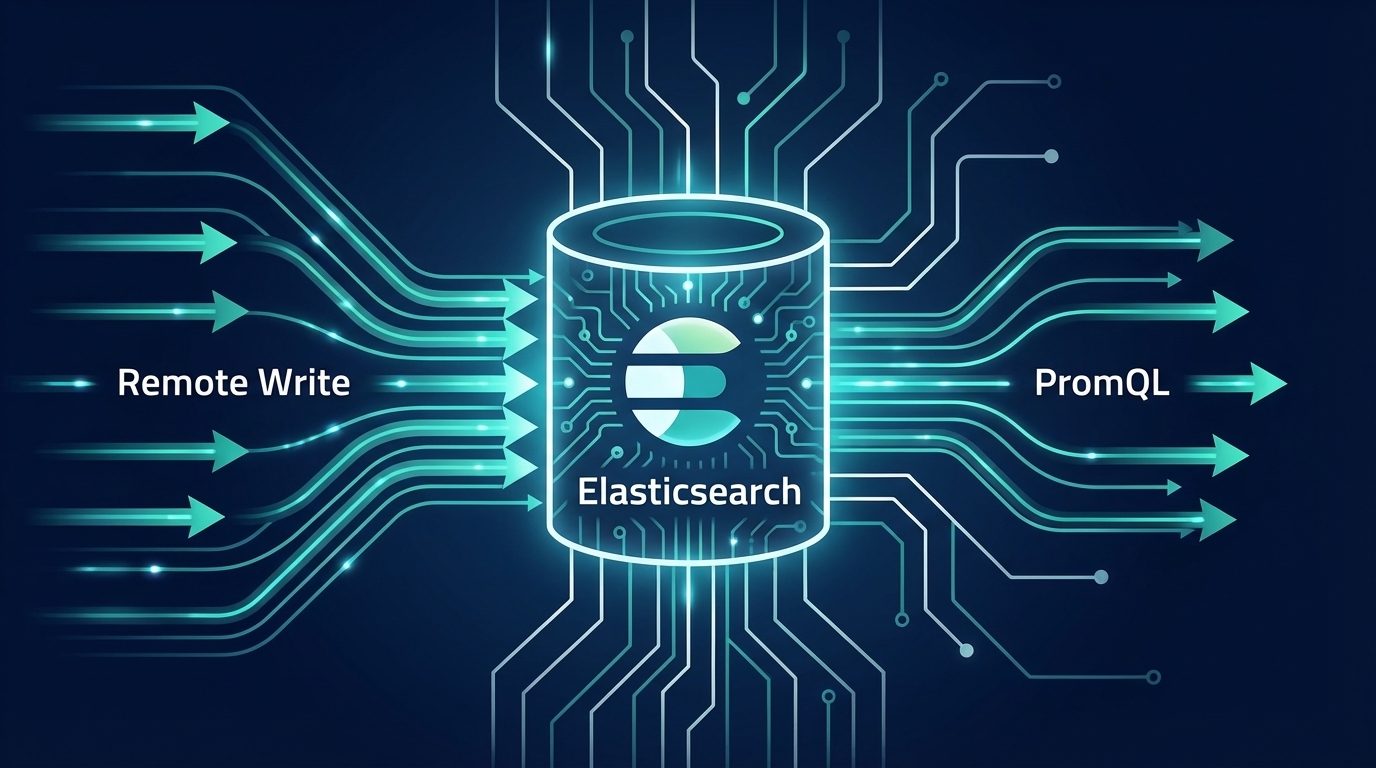
Bringing Fire to Elasticsearch: Adding Native Prometheus API Support
Query Elasticsearch directly from Prometheus-compatible clients via native PromQL, discovery, and metadata endpoints. Send data to Elasticsearch with Prometheus Remote Write.