Blogs
Hands-on, insight-driven content about observing your production and development environments using Elastic Observability.
How Elastic cut OpenTelemetry tail sampling memory by 65% with disk-backed trace storage
Elastic contributed two features upstream to the OTel Collector's tail sampling processor. The span-ingest strategy lets sampling decisions happen earlier, and Pebble tail storage moves trace buffering to disk. It costs more CPU, but operators can raise decision_wait and num_traces without OOM kills.
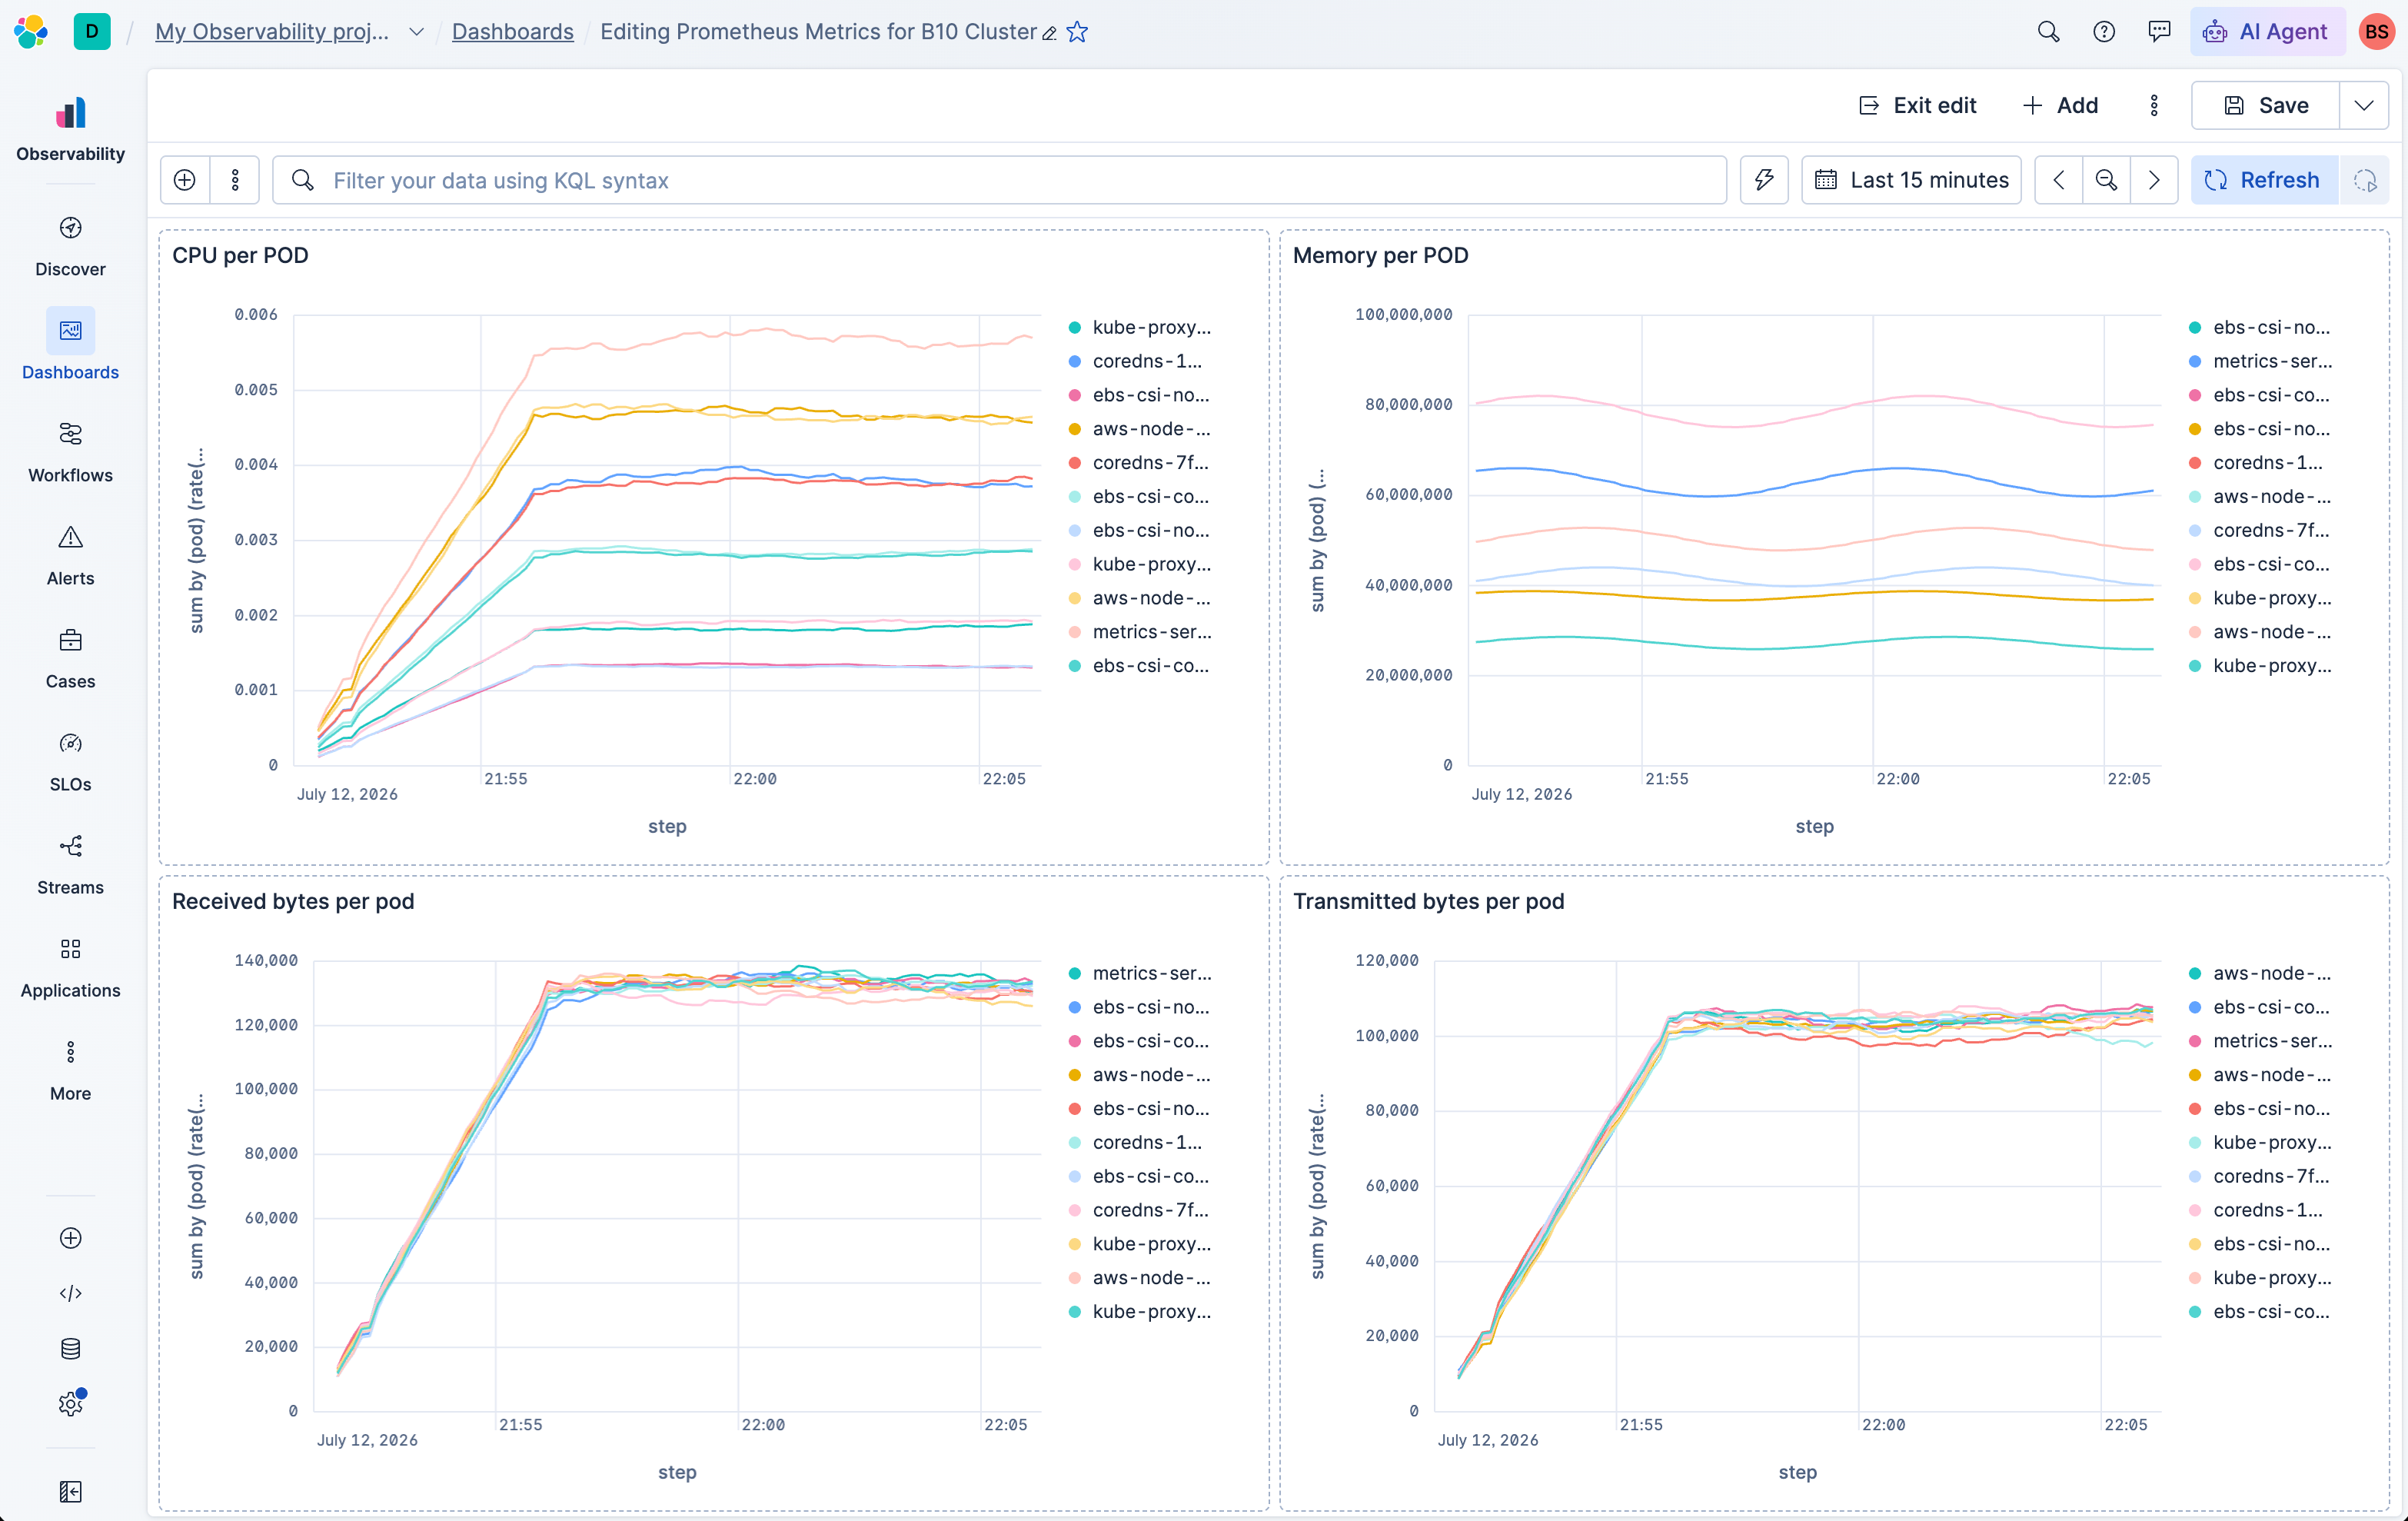
Prometheus metrics in Elastic Observability: your PromQL runs unchanged
Point Prometheus from your Kubernetes cluster at Elastic Observability with one config block. PromQL runs unchanged, keep your PromQL no cardinality billing.
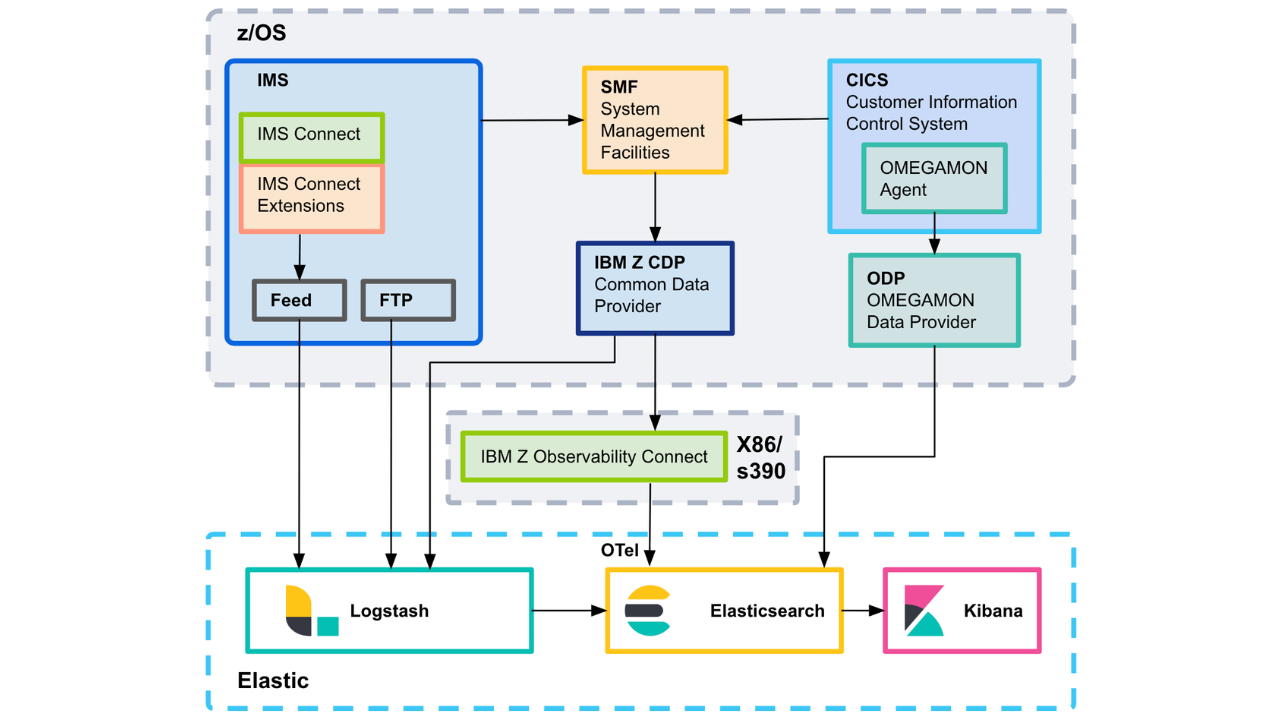
Elastic z/OS ingest: five architectures for mainframe data
This field guide walks through the ingest architectures I've seen work in production, the data quality checks that decide whether your dashboards actually work, and the ECS mapping that makes mainframe data usable to the platform.
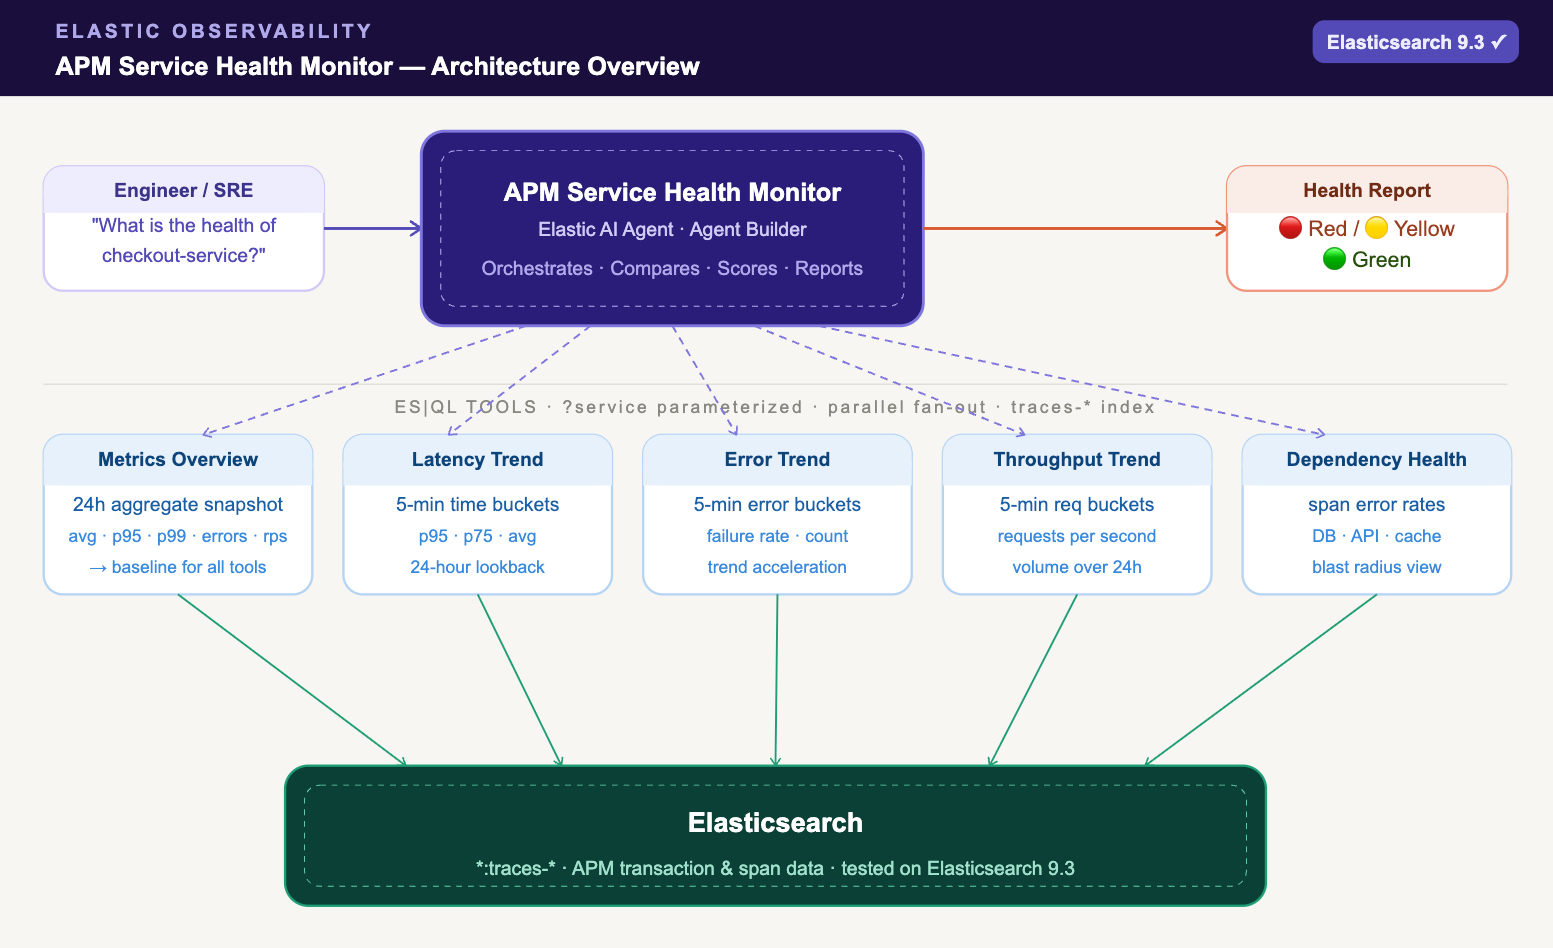
From five dashboards to one prompt: how we built an APM health monitor with Elastic Agent Builder
Five ES|QL tools score latency, errors, throughput and dependencies to find the root cause, so you don't dashboard-hop during an APM incident.

Common ES|QL queries for Kubernetes monitoring
Copy-paste ES|QL queries for Elasticsearch that turn memory pressure and error spikes into a five-minute diagnosis.

Elastic now alerts at 80% OpenAI rate limit usage, before your app gets throttled
OpenAI rate limit monitoring in Elastic maps headroom across every project and model. Compare configured RPM, TPM and IPM limits against real usage and plan capacity before a throttling alert fires.

Piping Hot: Bringing ES|QL to Your Grafana Dashboards Using the Elasticsearch Plugin
You can now write ES|QL queries in Grafana with the Elasticsearch plugin. Learn how to enable it and write pipe-based queries directly in the Grafana UI.
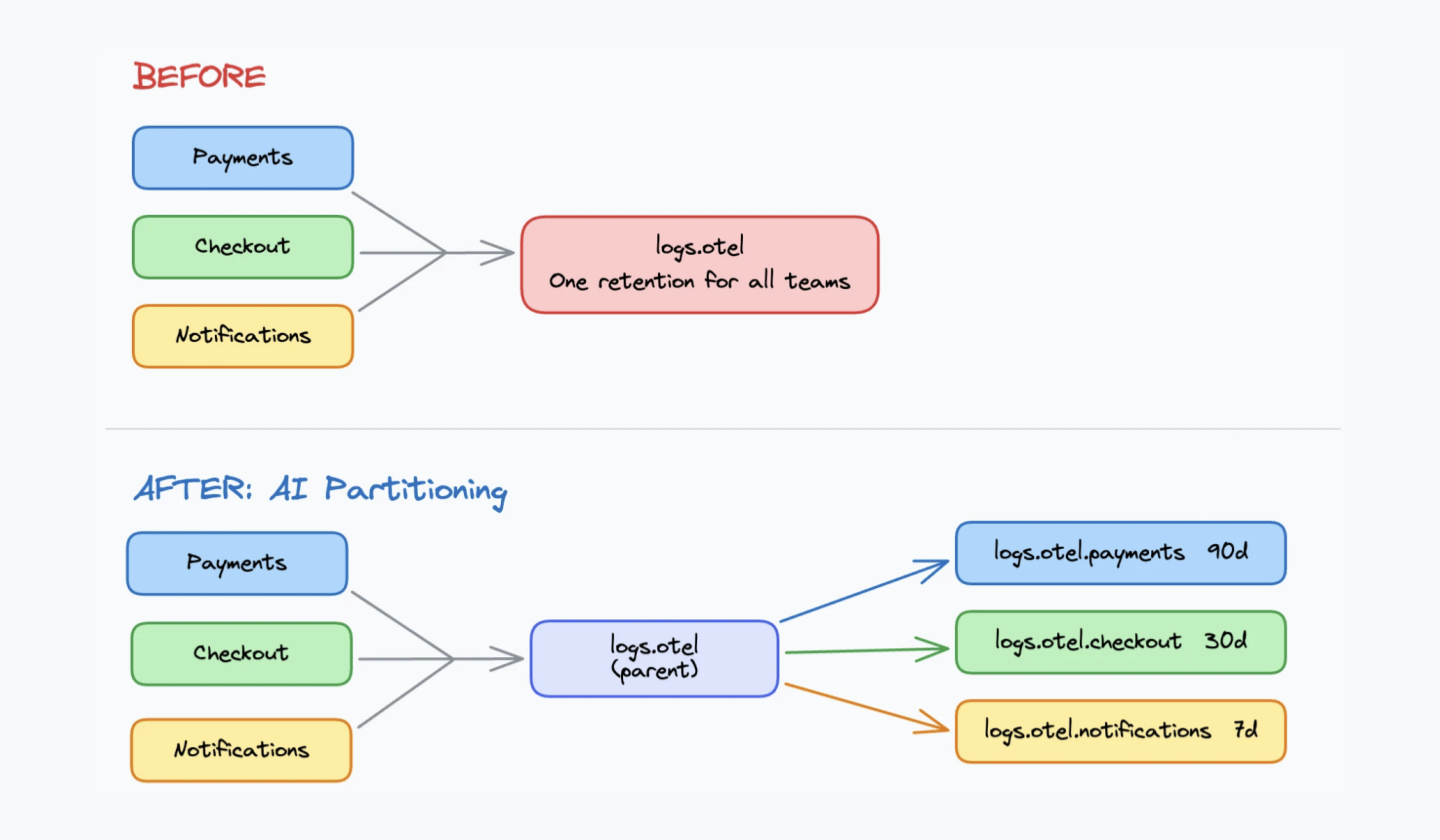
One OTLP endpoint, three teams, zero routing rules: Elasticsearch Streams AI Partitioning
Stop writing log routing rules upfront. See how Streams AI Partitioning reads your data, proposes child streams, and lets you set per-team retention in minutes.
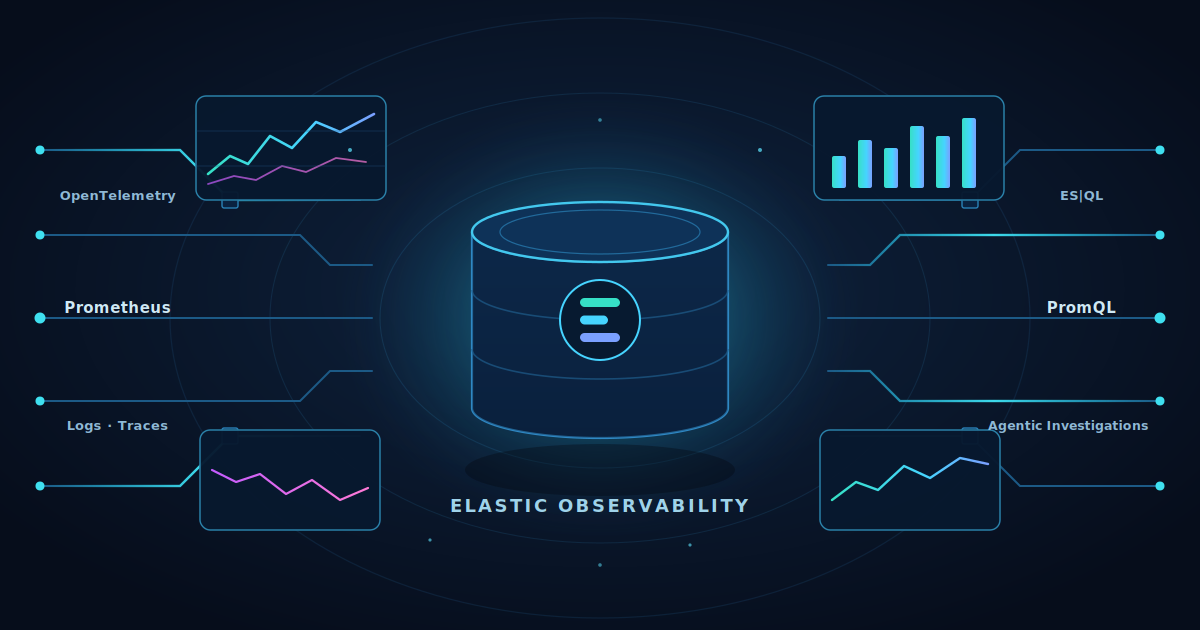
Elasticsearch: best-in-class for logs, now best-in-class for metrics
Elasticsearch is now best-in-class for metrics: 30× faster than Prometheus, up to 2.5× more storage-efficient, 50% less than Datadog. Learn about all the capabilities we’ve added.
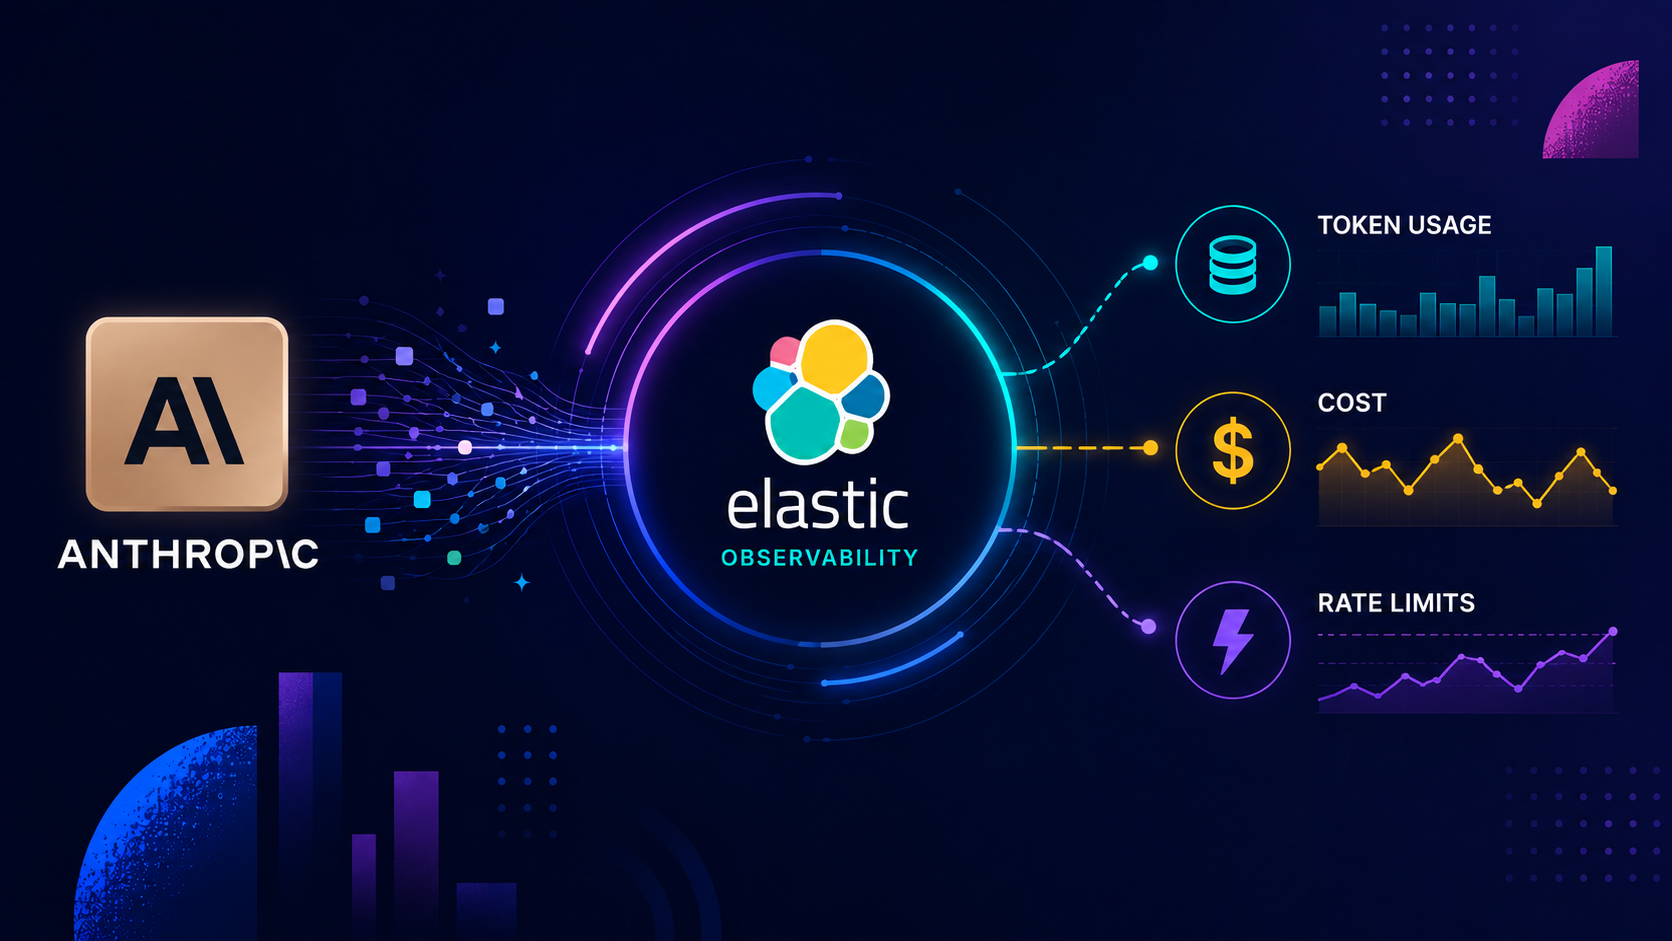
Stop finding out about your Claude bill on invoice day: Anthropic API monitoring is now in Elastic
Track Anthropic API spend and rate limit headroom across every workspace, model, and service tier, so cost surprises and throttling stop being production-time discoveries.
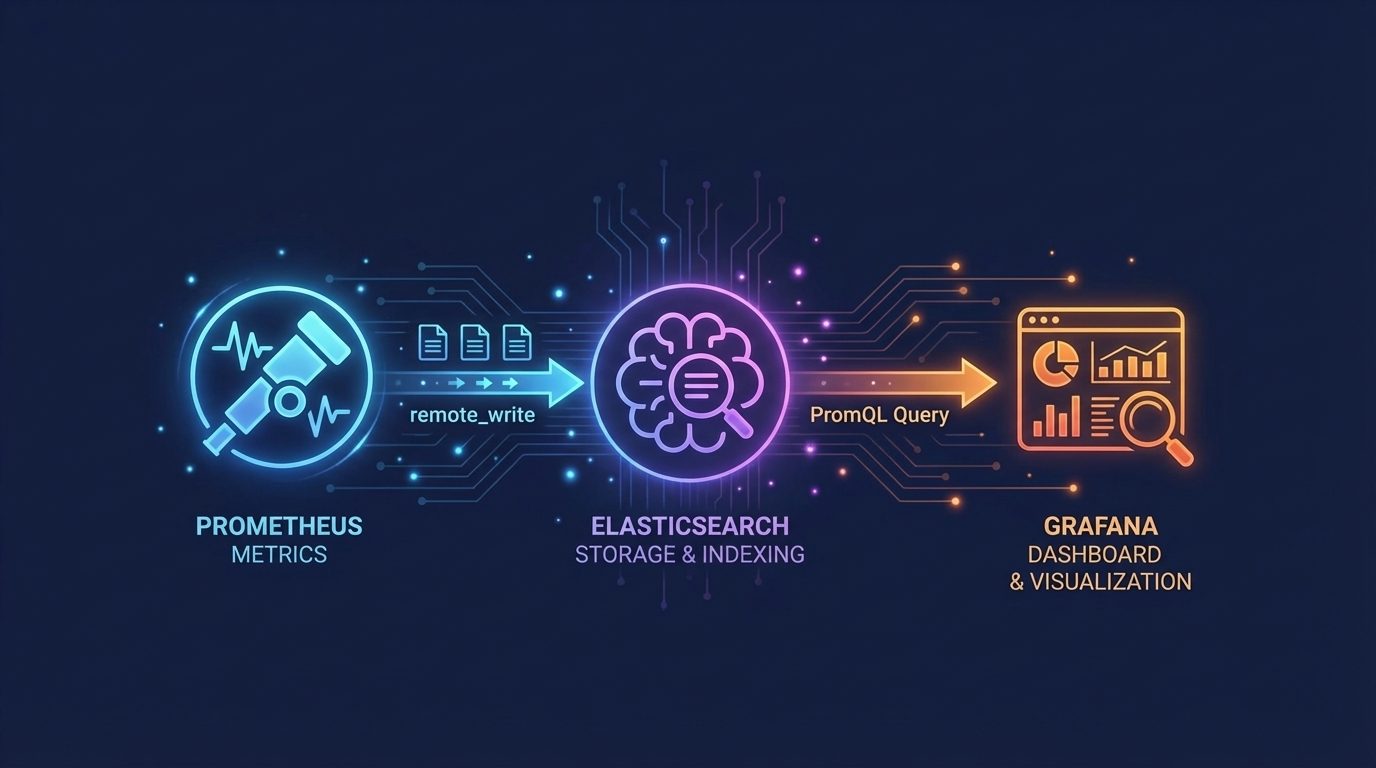
Use Elasticsearch as a Drop-In Prometheus Backend for Grafana
Use Elasticsearch as a Prometheus backend for Grafana dashboards, autocomplete, Metrics Drilldown, and alerting without changing PromQL workflows.
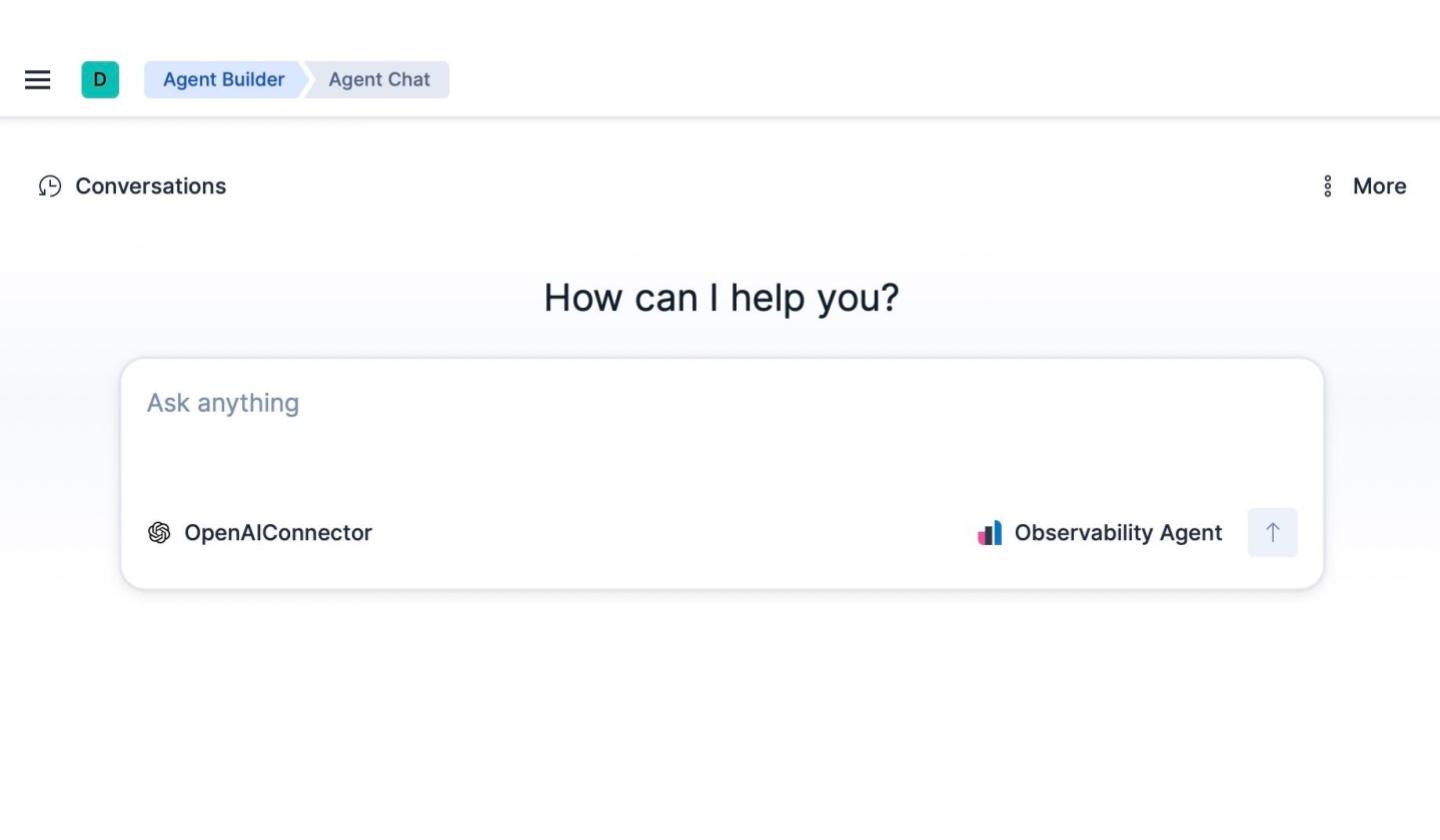
From alert to root cause in seconds: AI-powered observability with Elastic Agent Builder and Workflows
Elastic Agent Builder and Workflows replace dashboard hunting: one question surfaces the root cause, correlates metrics across weeks, and calculates business impact; then the workflow files the ticket.