Blogs
Hands-on, insight-driven content about observing your production and development environments using Elastic Observability.
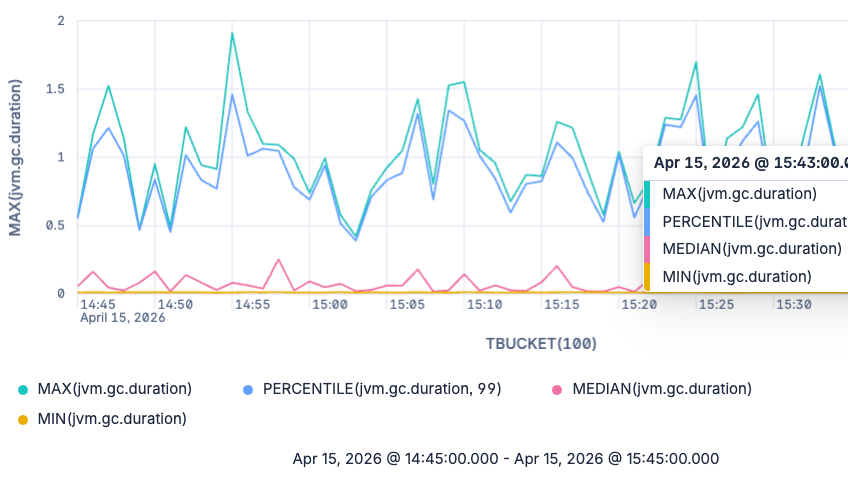
From averages to any percentile: Elasticsearch ships native exponential histogram support in ES|QL
Query any percentile at any time. Elasticsearch natively stores OTel exponential histograms and lets you analyze distributions in ES|QL without fixed buckets or lossy conversions.
Migrate Logstash Pipelines from Azure Event Hubs to OTel Collector Kafka Receiver
Step-by-step guide to migrating Logstash pipelines from the Azure Event Hubs plugin to the OpenTelemetry Collector Kafka receiver.
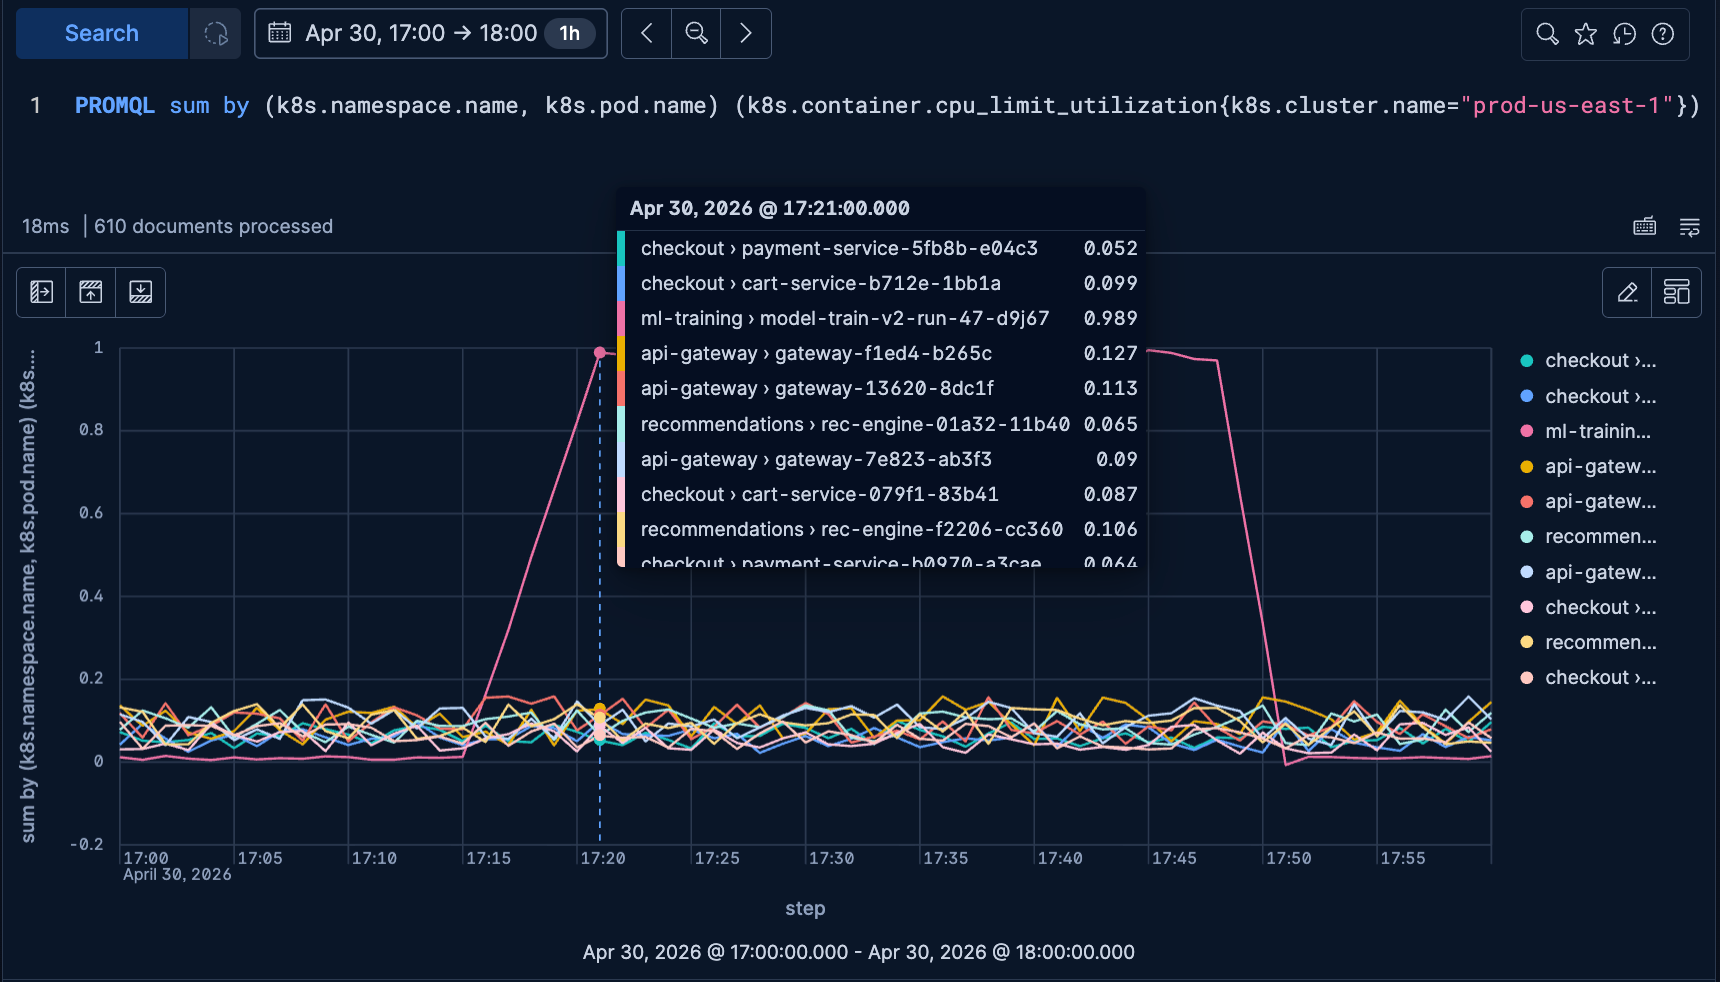
Investigate Kubernetes infrastructure issues with PromQL in Elasticsearch & Kibana
Walkthrough of a Kubernetes fleet-wide CPU investigation in Elastic Observability, from cluster to namespace to the noisy pod, using PromQL in Elasticsearch and Kibana.

TLS certificate monitoring with Elastic Workflows, Synthetics, and Osquery: Eliminate manual renewals
Automate TLS certificate monitoring with Elastic Workflows, Synthetics, and Osquery. Detect expiring certificates, rotate, and verify without human intervention.
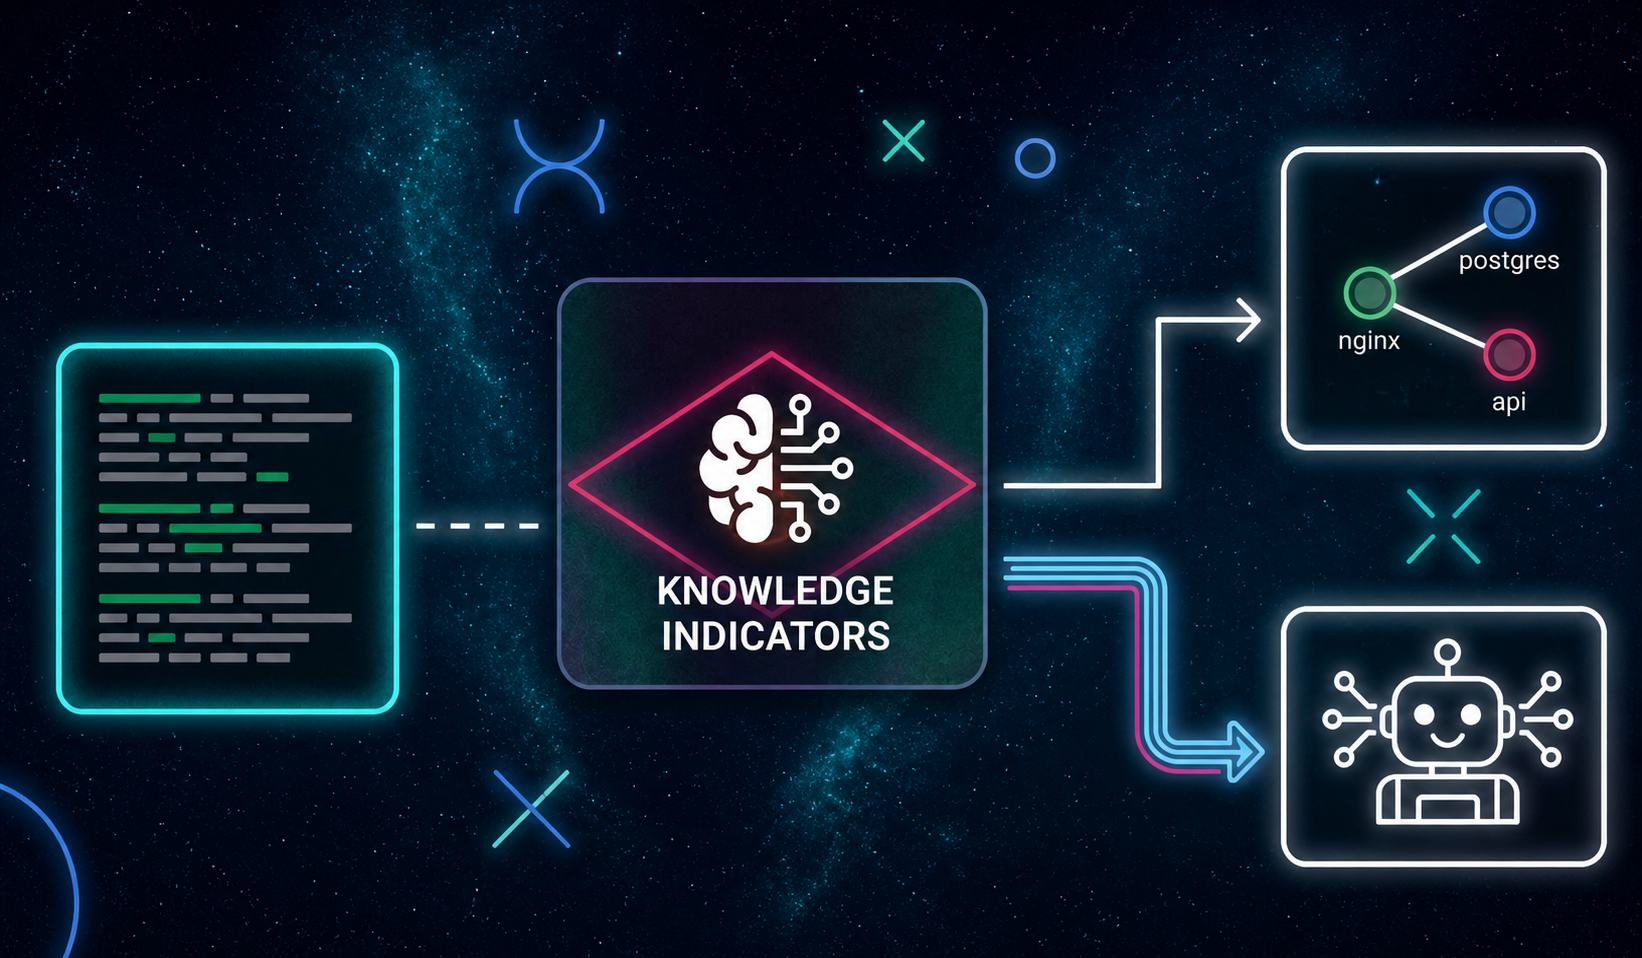
From raw logs to system knowledge: the AI context layer observability is missing
A self-updating knowledge base built from your logs: services, dependencies, and failure modes, so your AI agents always know what they are looking at.
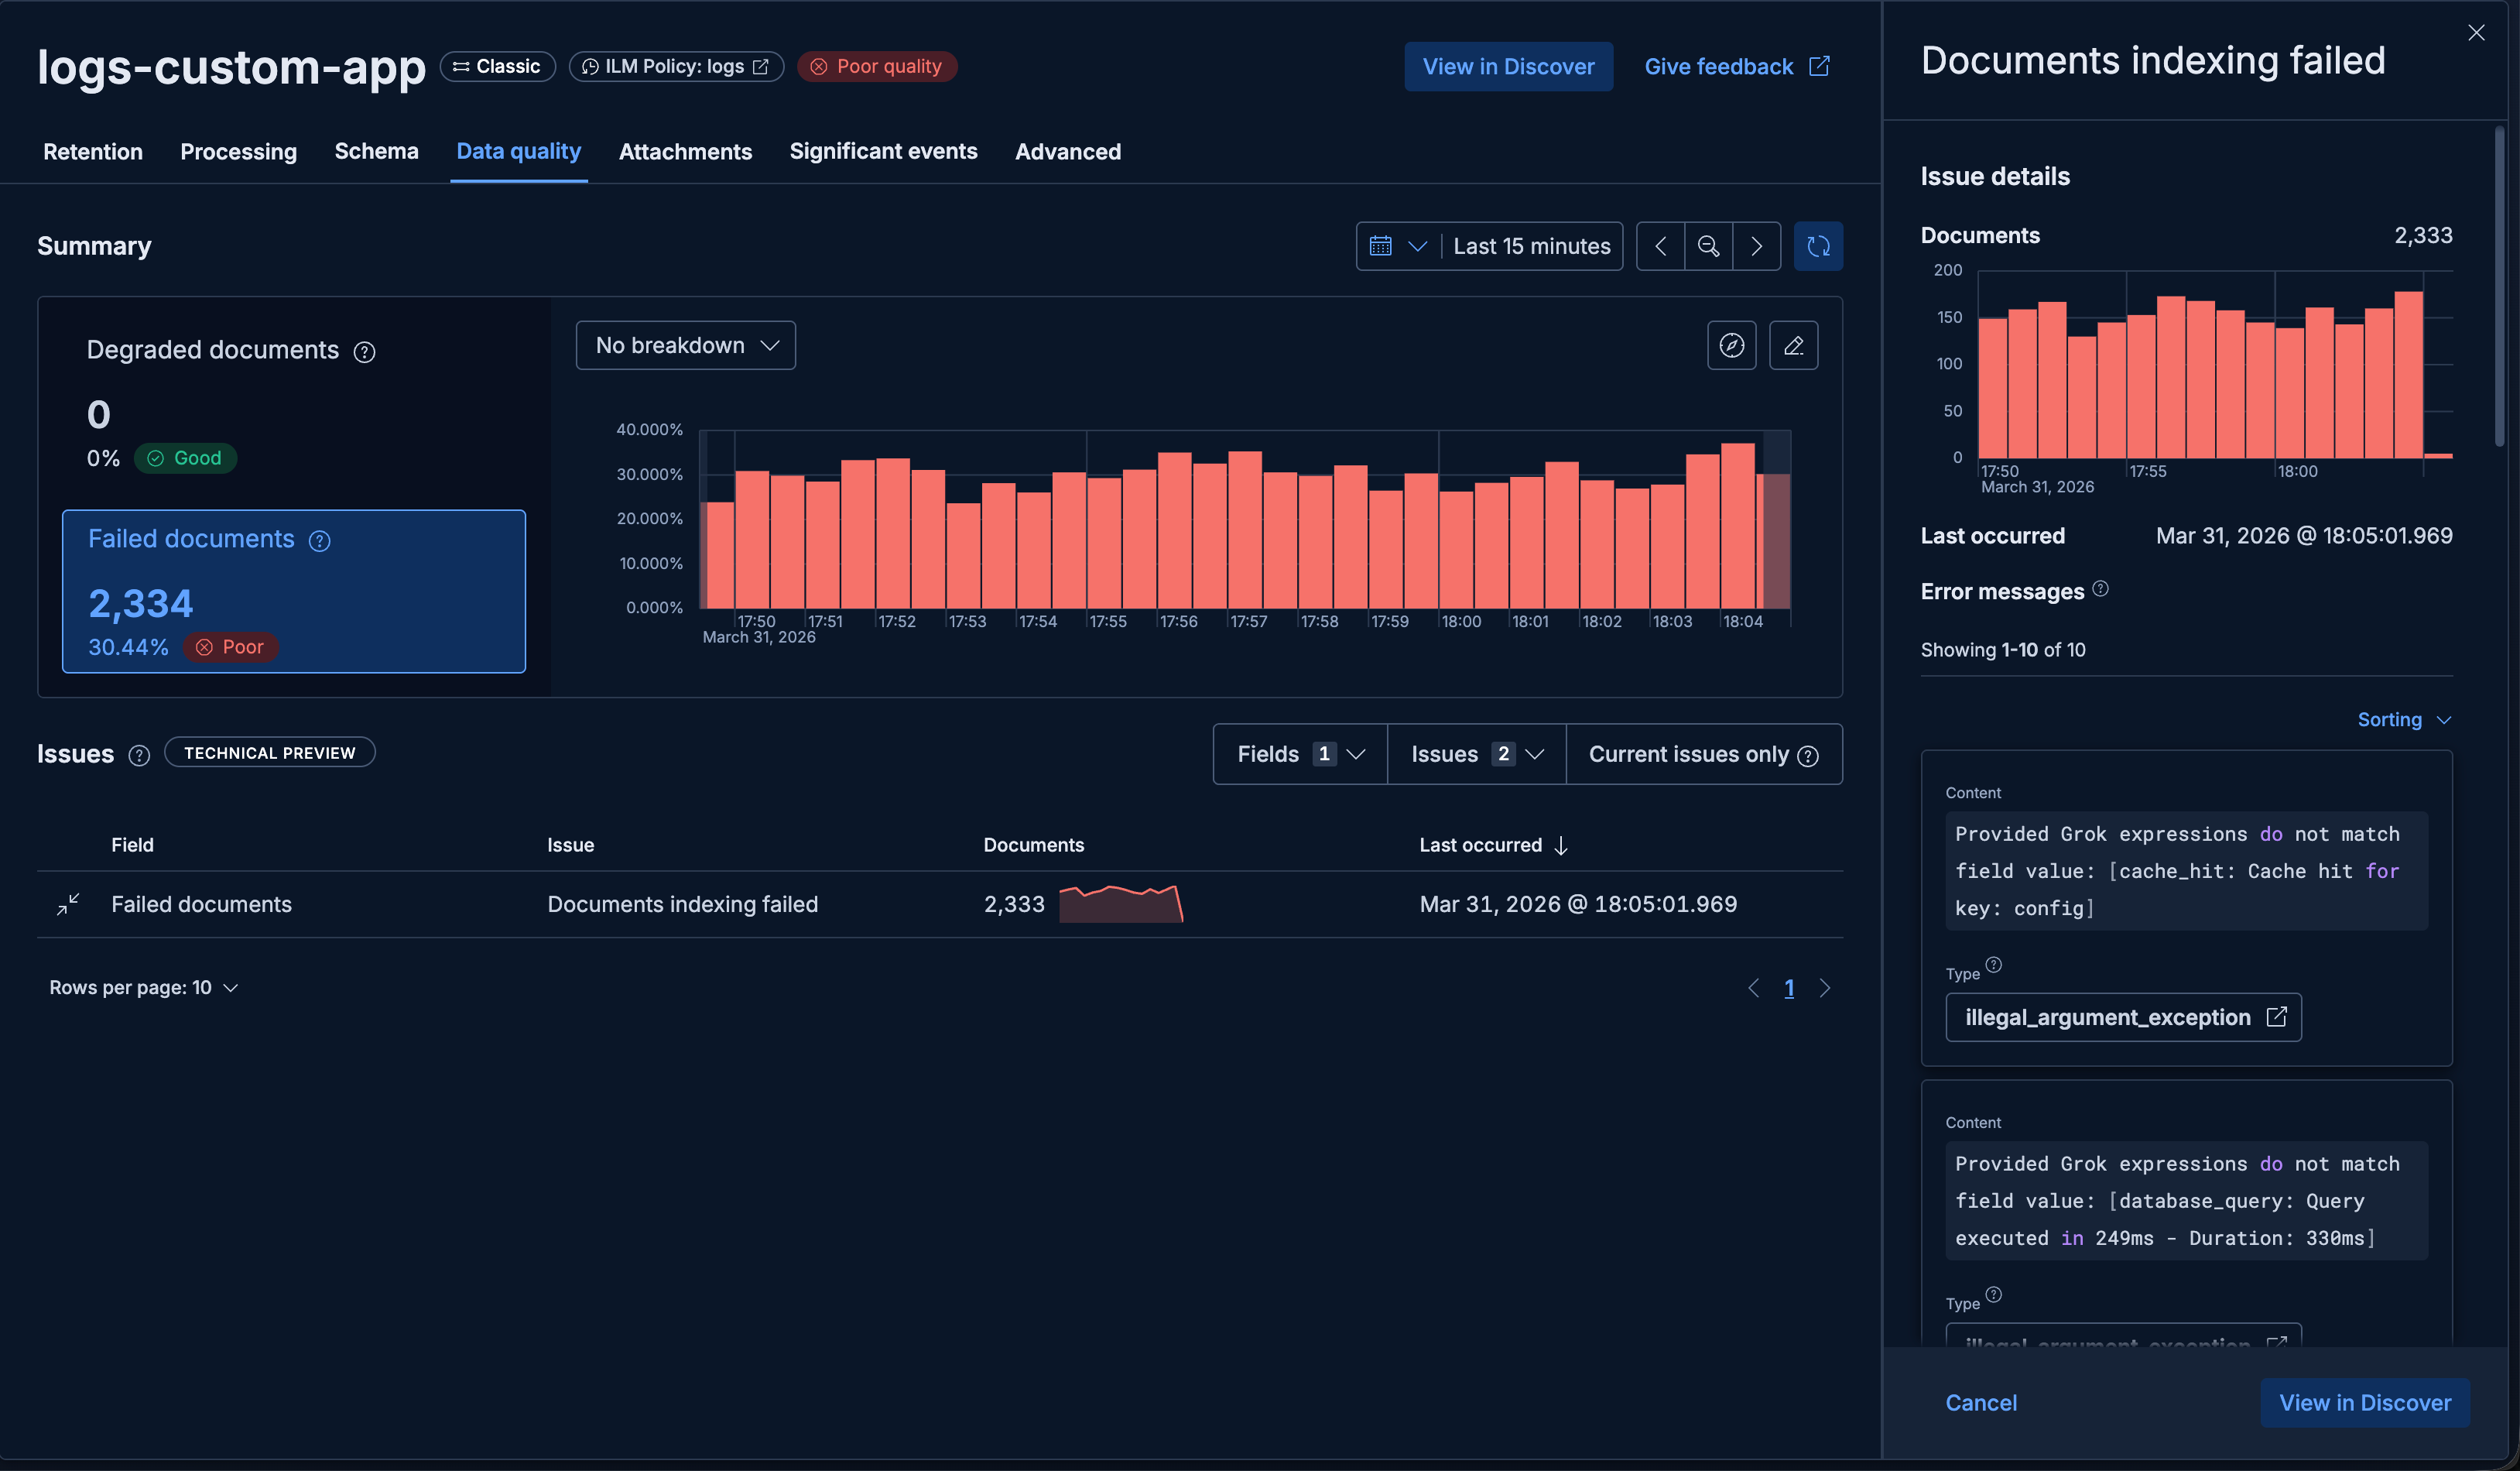
Fixing Elastic Streams processing failures without dropping data
When your Streams ingest pipeline breaks, failed documents land in the failure store, not the floor. Here's how to use those exact failures to fix your pipeline without re-ingesting from the source.

Connecting Cursor to Production Logs via the Elastic MCP Server
Learn how to connect Cursor to your Elastic APM data using the Elastic Agent Builder MCP server, so you can debug production errors and make UI decisions backed by real usage data without leaving your editor.
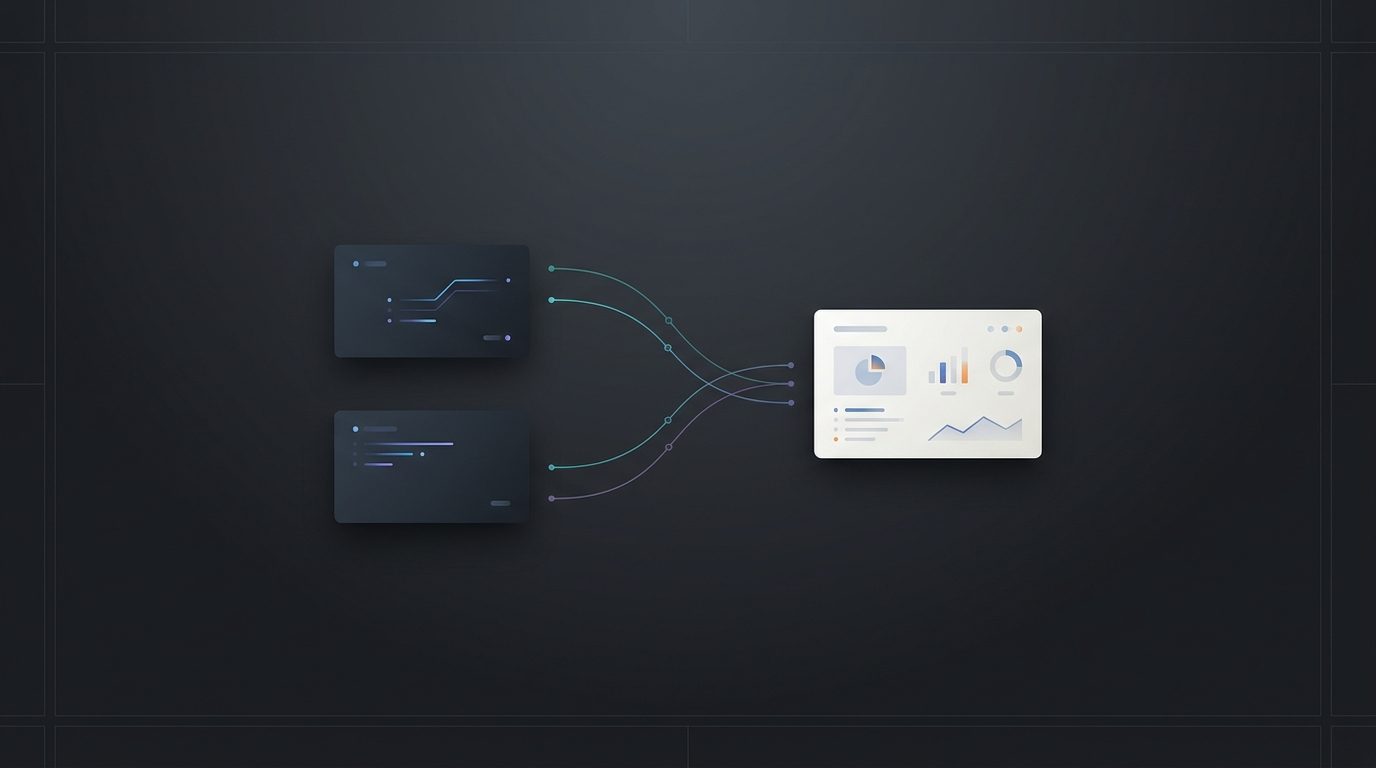
Migrating Datadog and Grafana dashboards and alerts to Kibana with the Observability Migration Platform
Learn how to migrate supported Datadog and Grafana dashboards and alerts to Kibana with the Observability Migration Platform.
Elastic Ramen: A CLI harness for SRE investigation and remediation
Exploring Elastic Ramen, a CLI harness that brings Agent Builder conversations, skills, and tools into the terminal so engineers can move from investigation to remediation in a single thread.
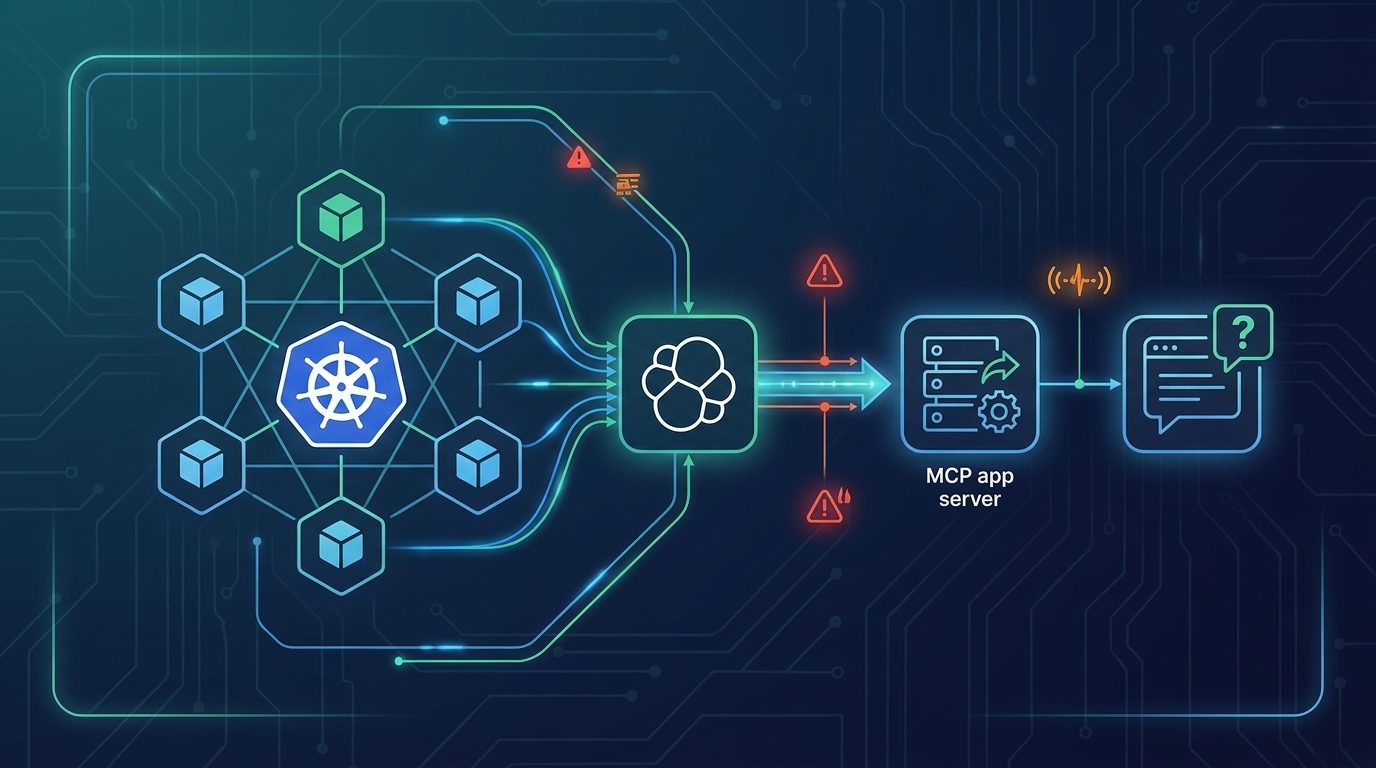
Agentic Powered Kubernetes Investigations with Elastic Observability and MCP
See how Elastic's Agentic powered Kubernetes observability uses MCP App, agent skills to let agents investigate clusters, detect anomalies, and automate root cause analysis.
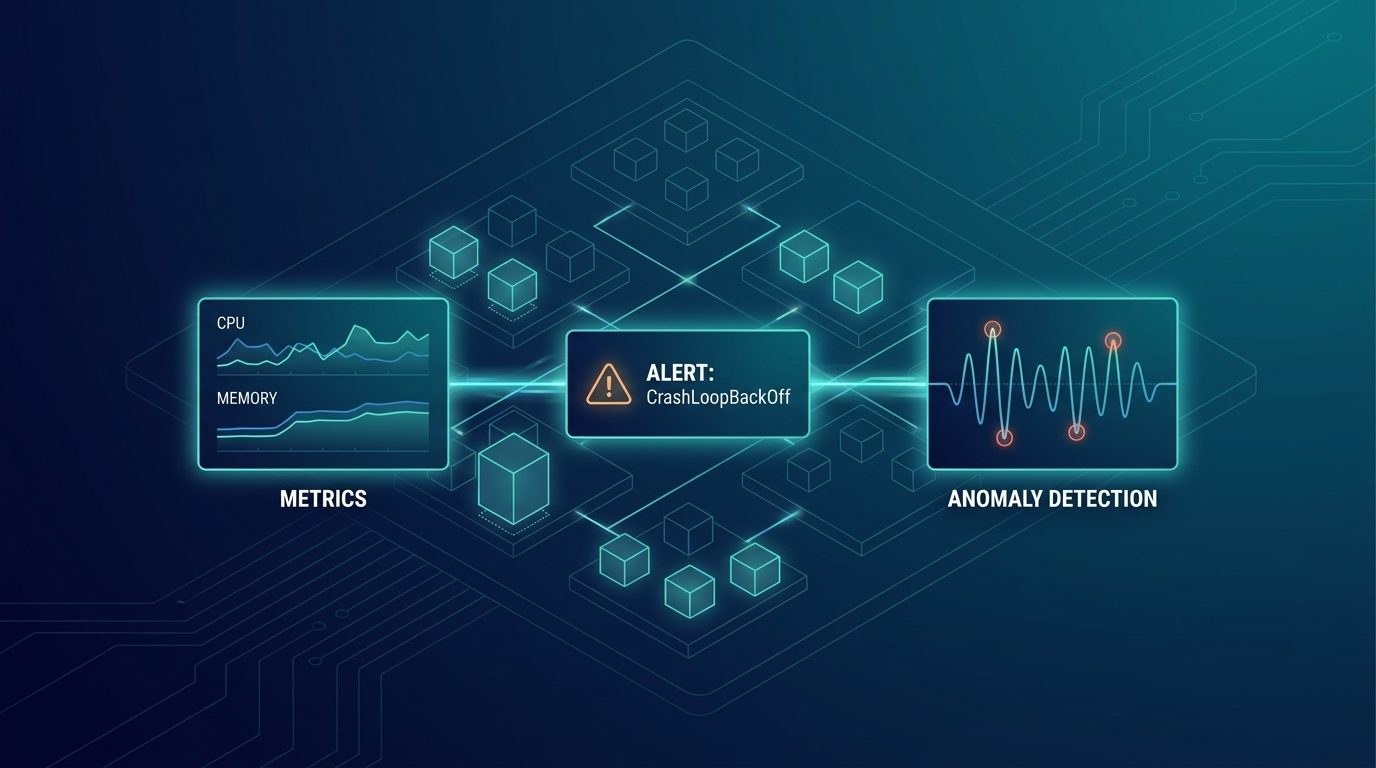
Kubernetes Observability from alert to root cause: Dashboards, Alerts, and Anomaly Detection with Elastic
Kubernetes observability with Elastic includes dashboards, alert rules, and ML anomaly detection for alerts with root-cause context.
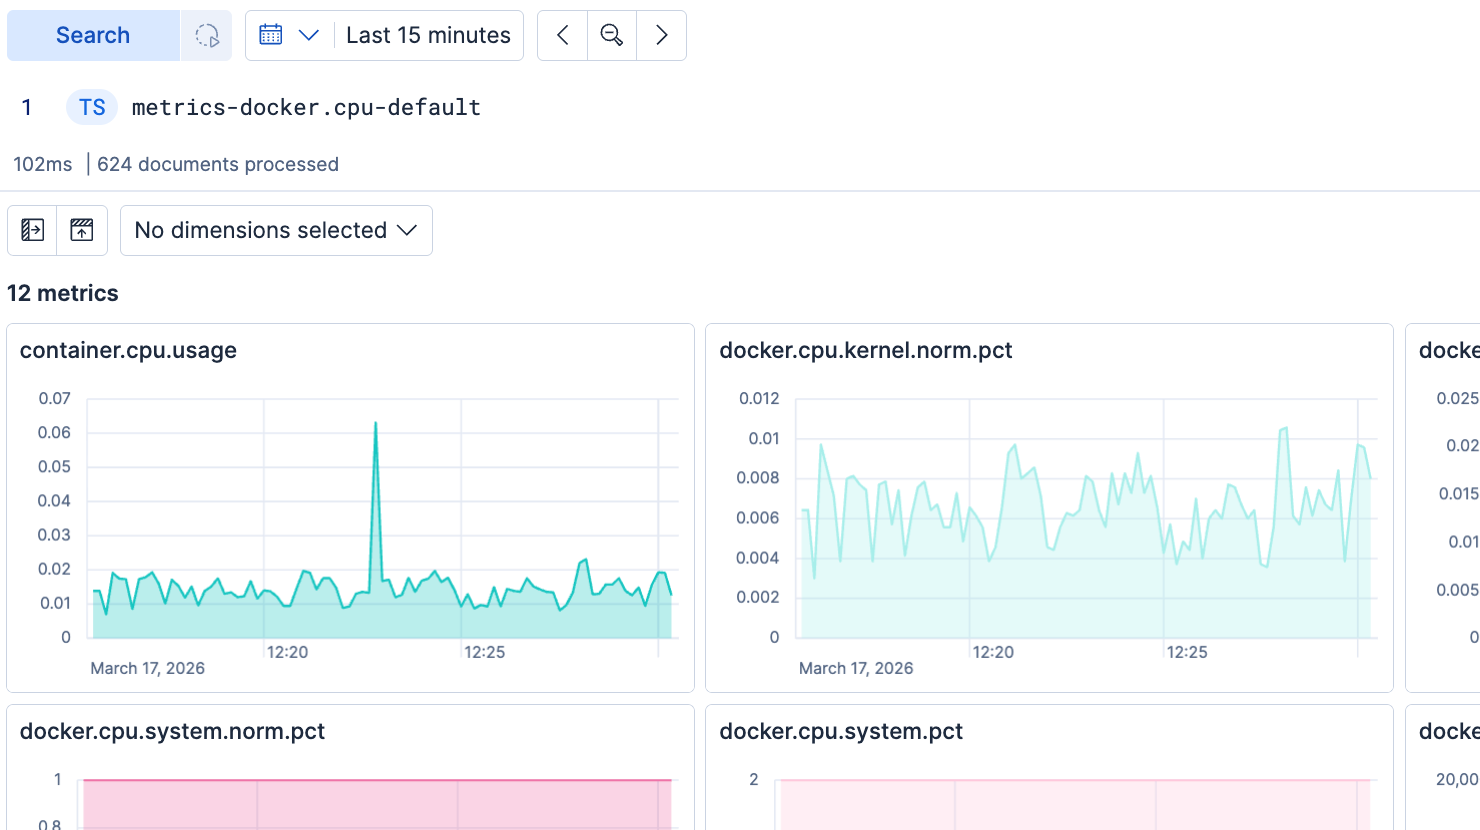
Exploring metrics from a new time series data stream in Discover
Discover helps you see and understand the metrics in a time series stream, with no manual work required. Once you see that your metrics data is flowing, you're ready to build dashboards, alerts, SLOs, and more.