Getting Started with the Grok Debugger
editGetting Started with the Grok Debugger
editSee the documentation about the ingest node grok processor and the Logstash grok filter more info about grok.
If you’re using X-Pack security, you must have the manage_pipeline
permission in order to use the Grok Debugger.
The Grok Debugger is automatically enabled in Kibana. It is located under the DevTools tab in Kibana.
To start debugging grok patterns:
-
Open Kibana in your web browser and log in. If you are running Kibana
locally, go to
http://localhost:5601/. -
Click DevTools in the side navigation and then click Grok Debugger on the top navigation bar.
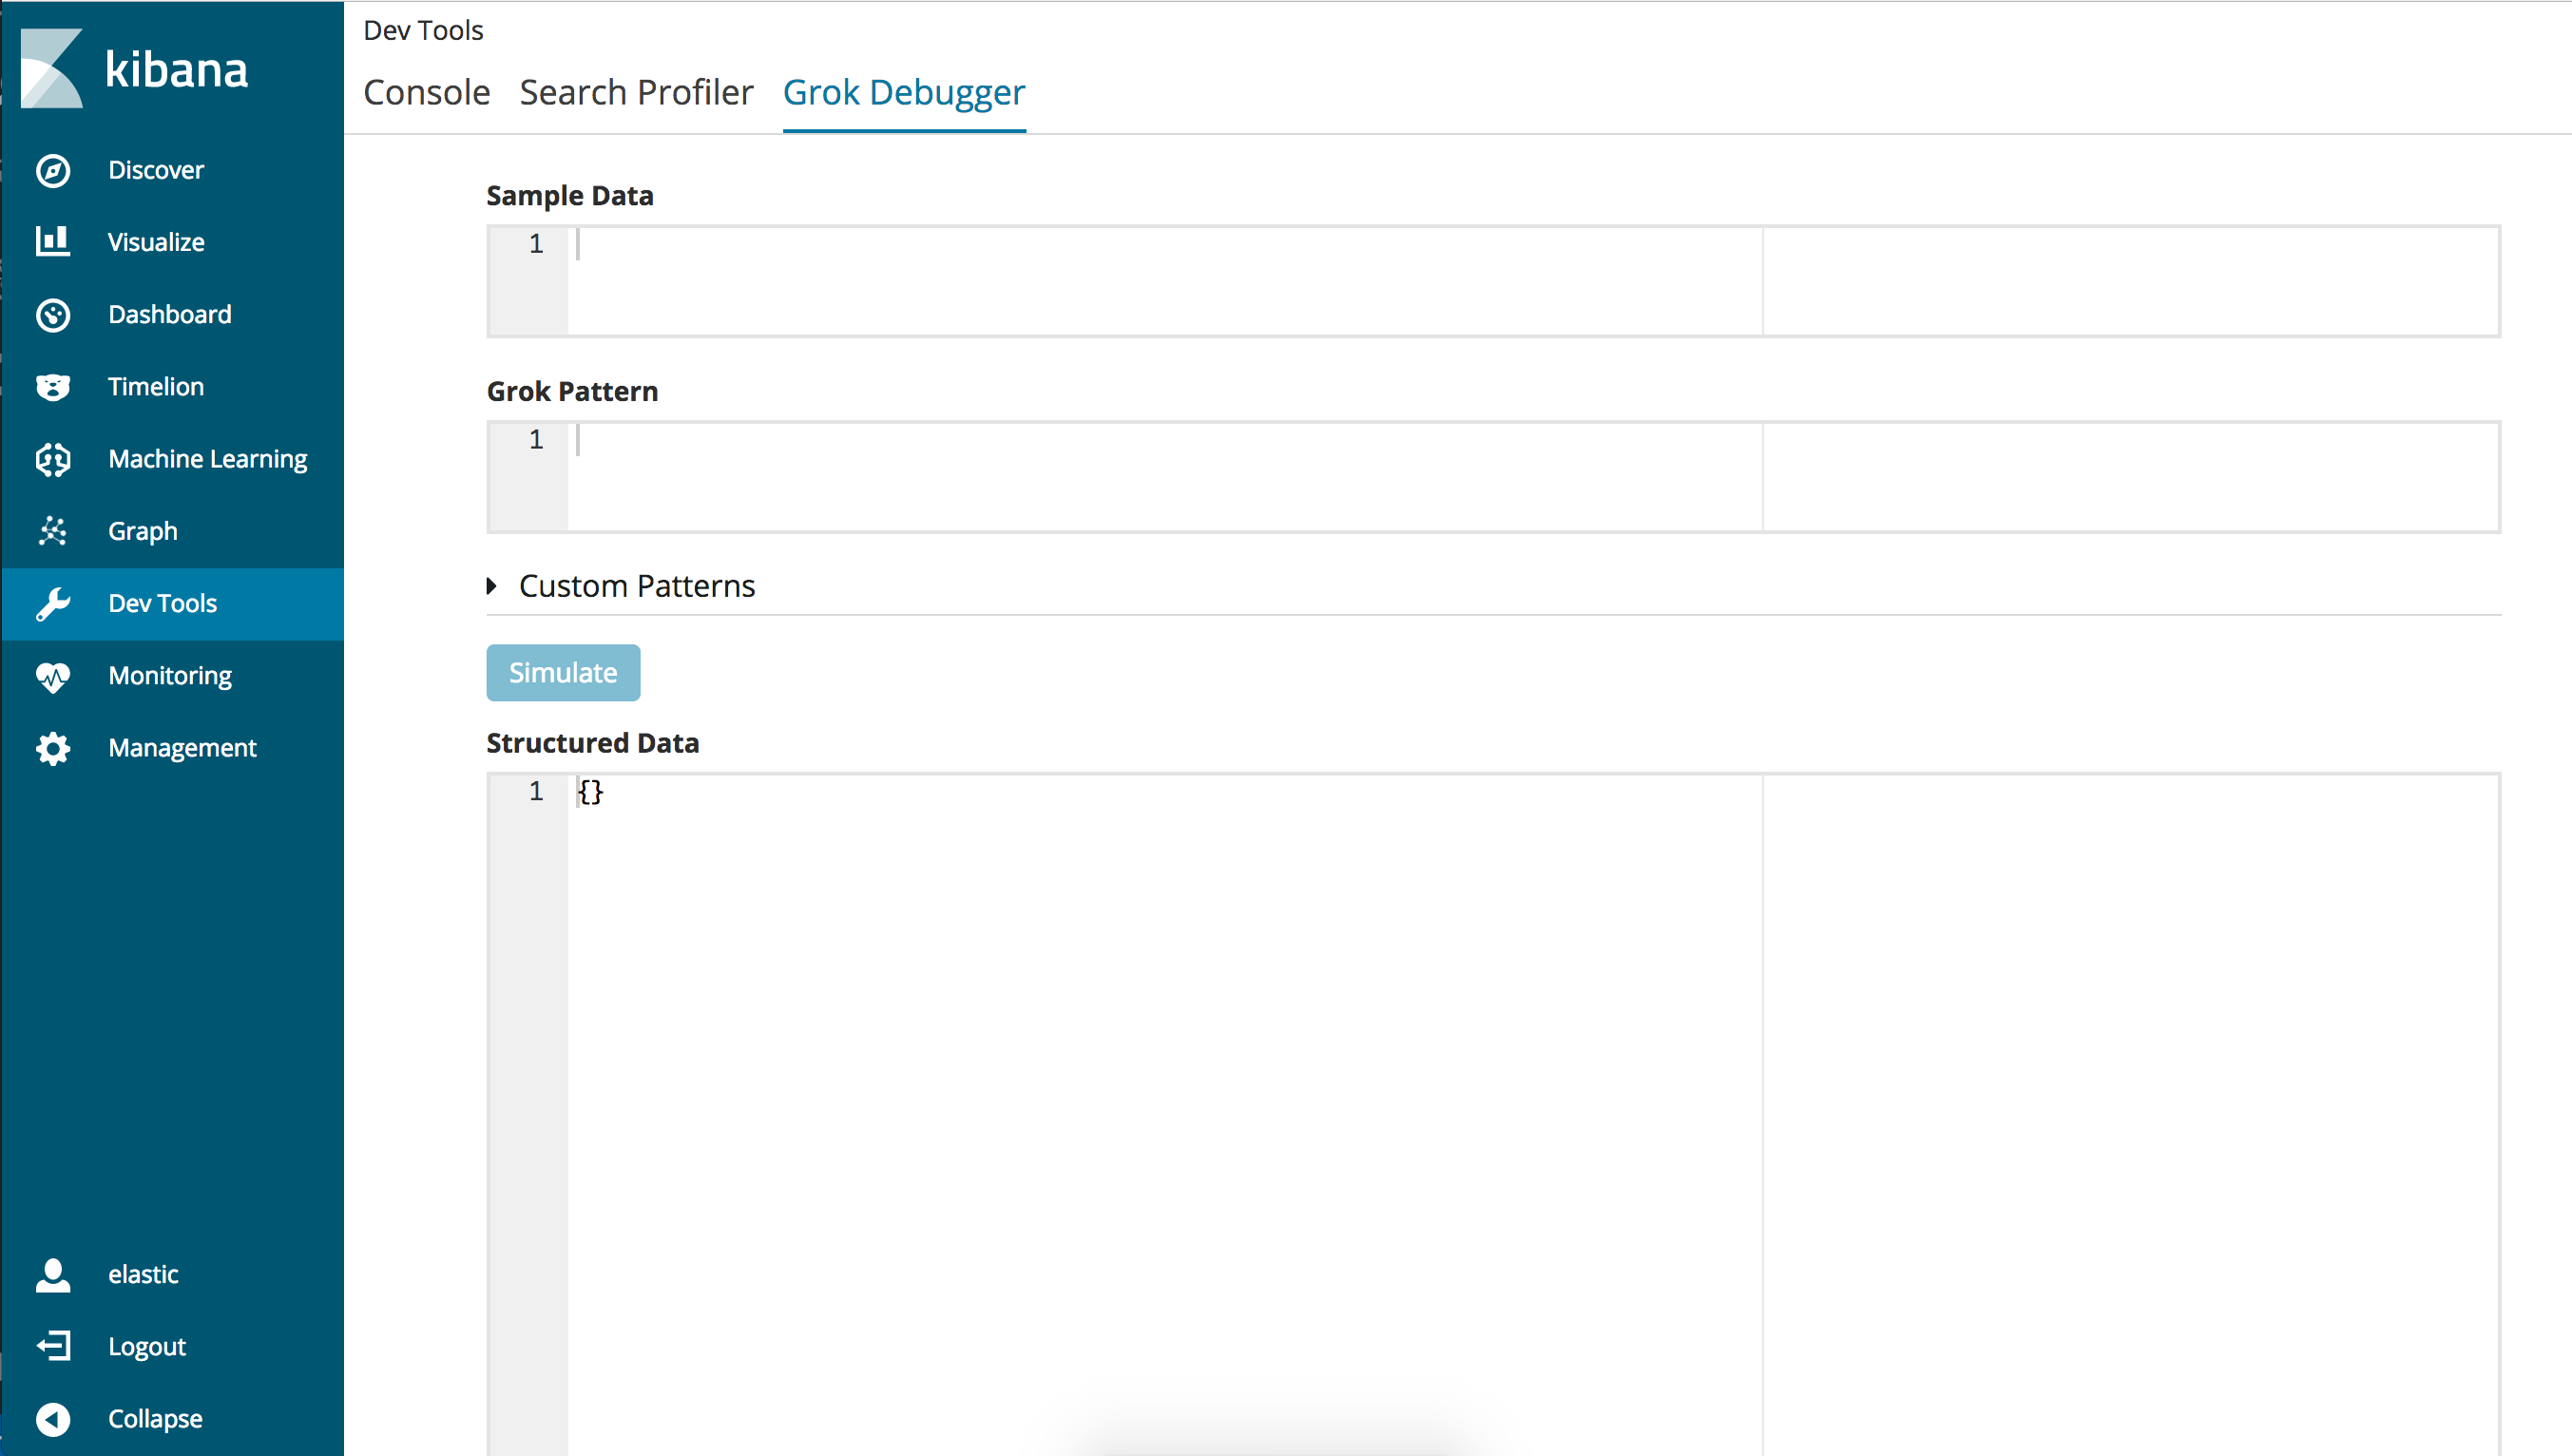
-
Under Sample Data, enter a sample message that is representative of the data you want to parse. For example:
55.3.244.1 GET /index.html 15824 0.043
-
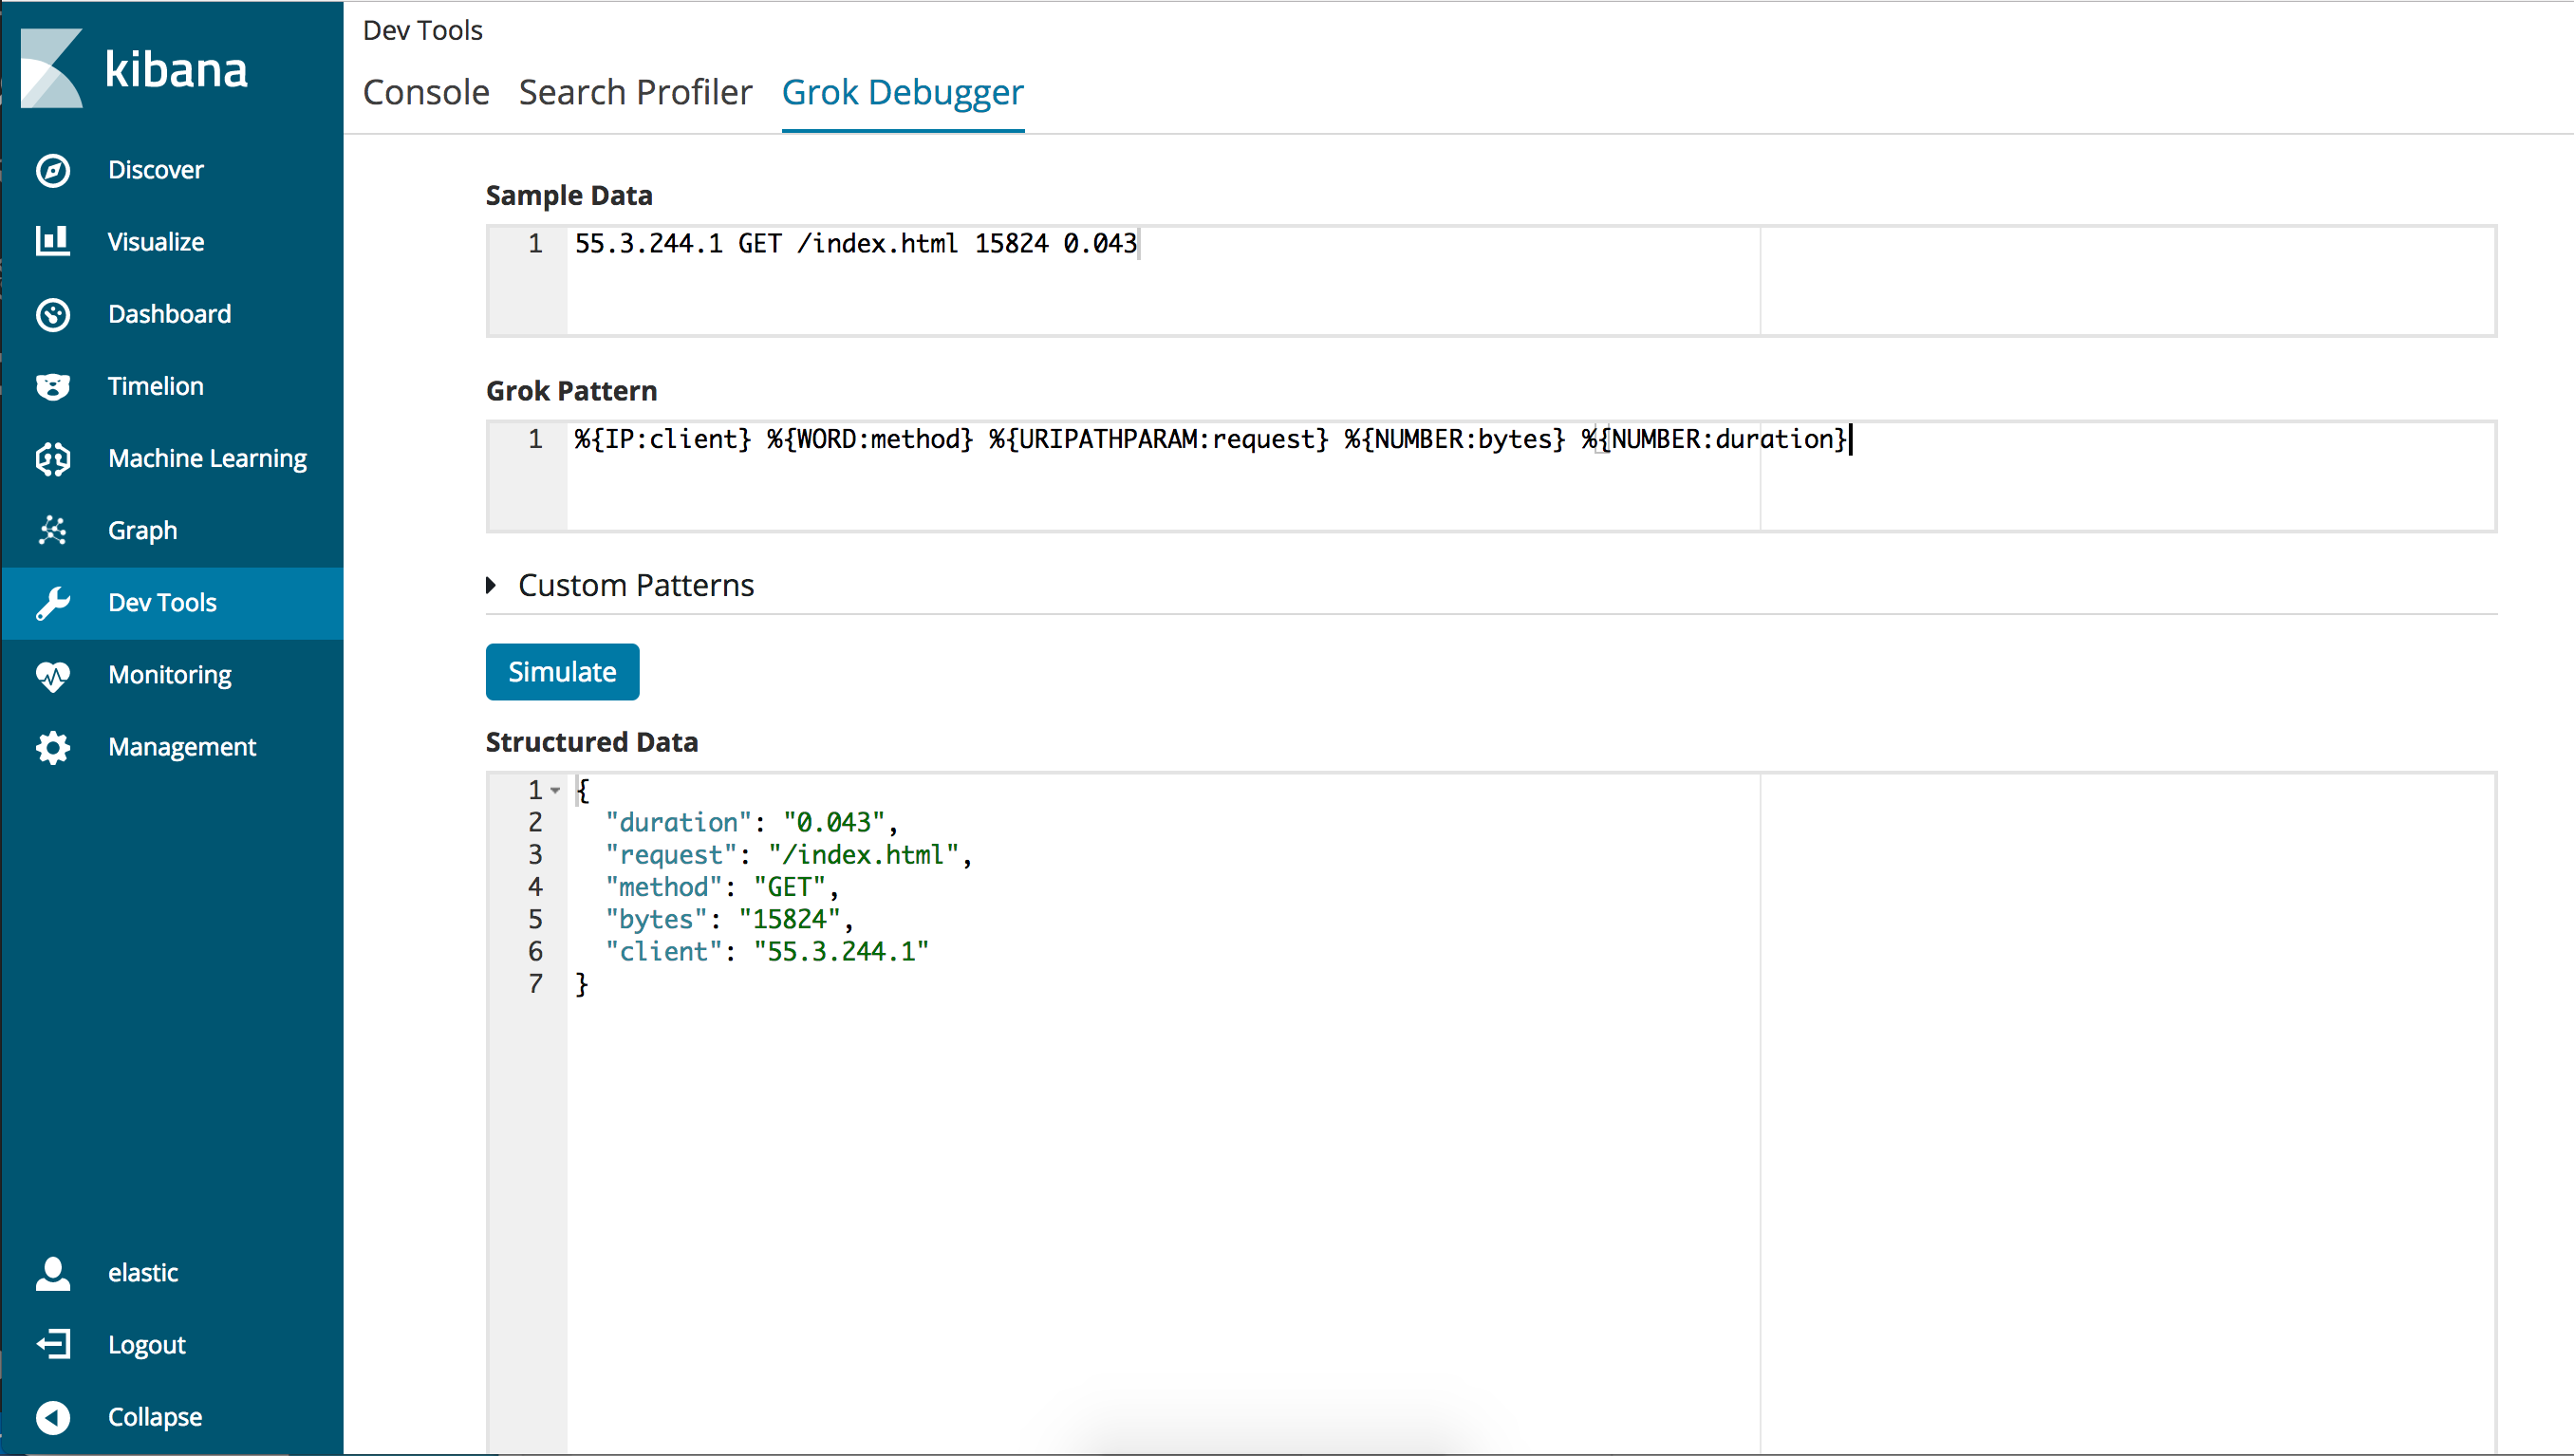
Under Grok Pattern, enter the grok pattern that you want to apply to the data.
For example, to parse the log line in the example, you use:
%{IP:client} %{WORD:method} %{URIPATHPARAM:request} %{NUMBER:bytes} %{NUMBER:duration} -
Click the Simulate button.
Under Structured Data, you’ll see the simulated event that results from applying the grok pattern:
Any errors in the pattern will appear at the top of the page. For example, here you see a parse exception because the pattern name is misspelled as
WORDDand therefore can’t be found in the pattern dictionary: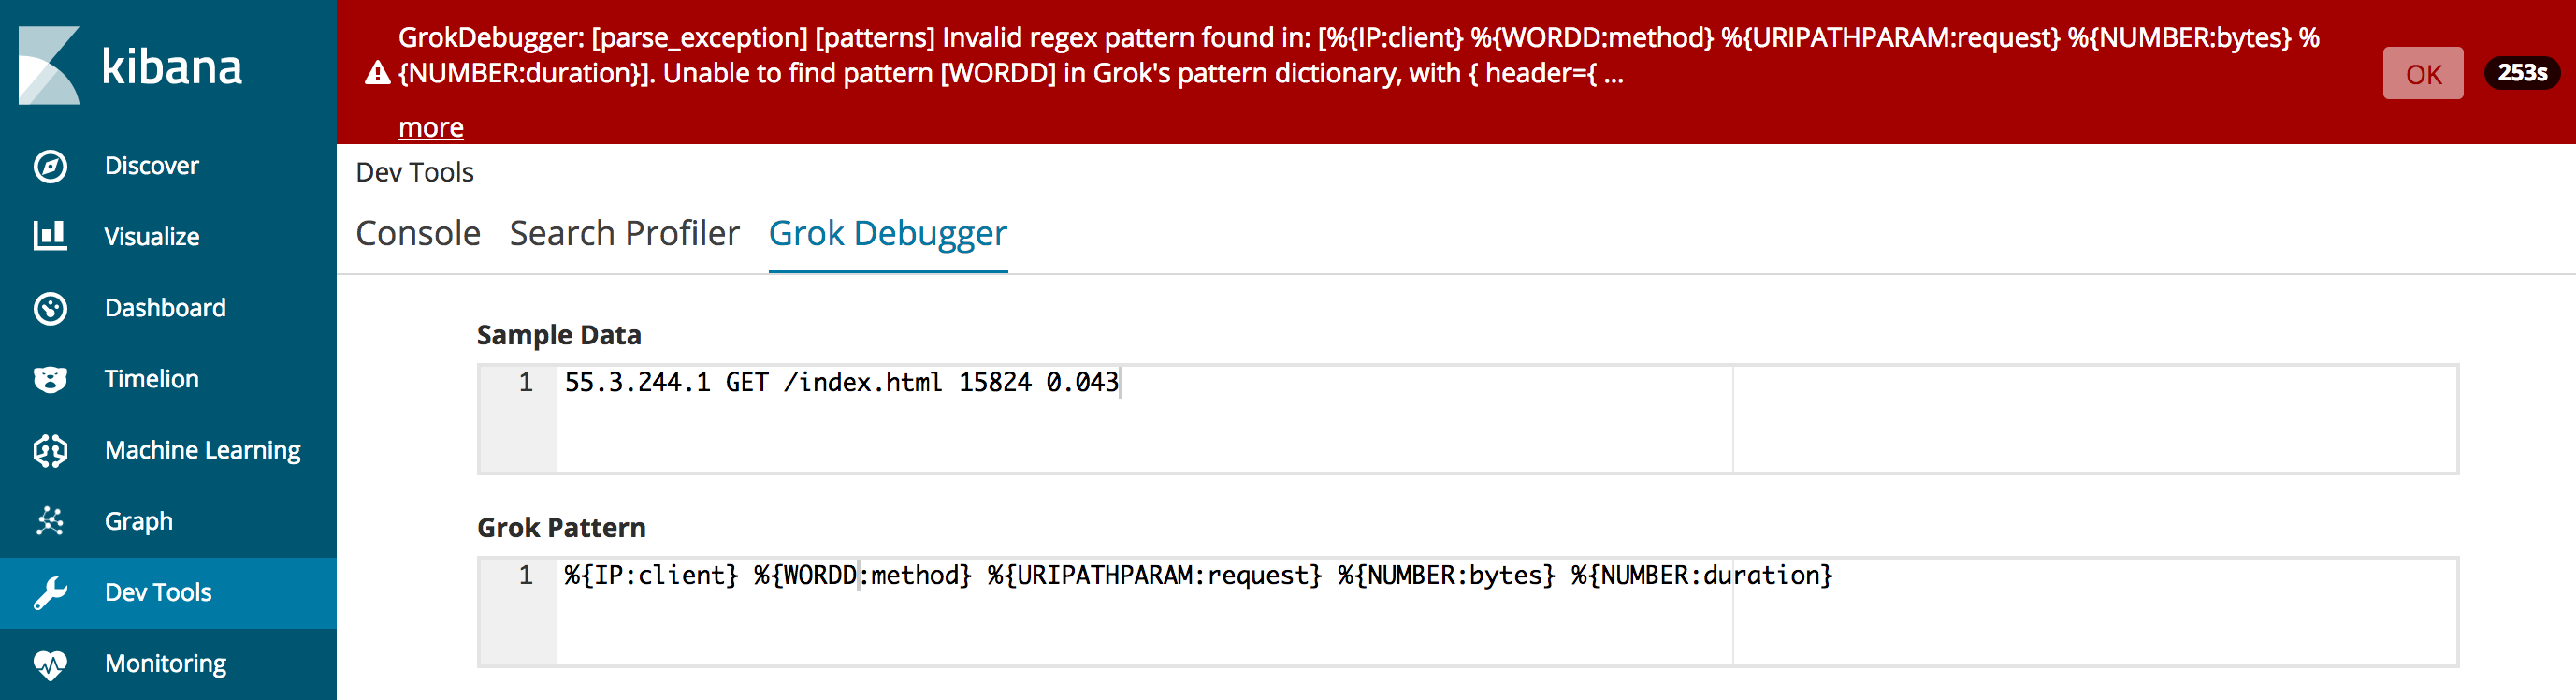
You can click the More link to see more detail about the message.
Click OK to dismiss the message and continue iterating over the grok pattern until there are no errors and the output matches the event that you expect.
Testing Custom Patterns
editIf the default grok pattern dictionary doesn’t contain the patterns you need, you may need to define custom patterns. You can use the Grok Debugger to test and debug customer patterns.
The custom patterns that you enter in the Grok Debugger are not saved. They’re only available for the current debugging session and have no side effects.
To test a custom pattern:
-
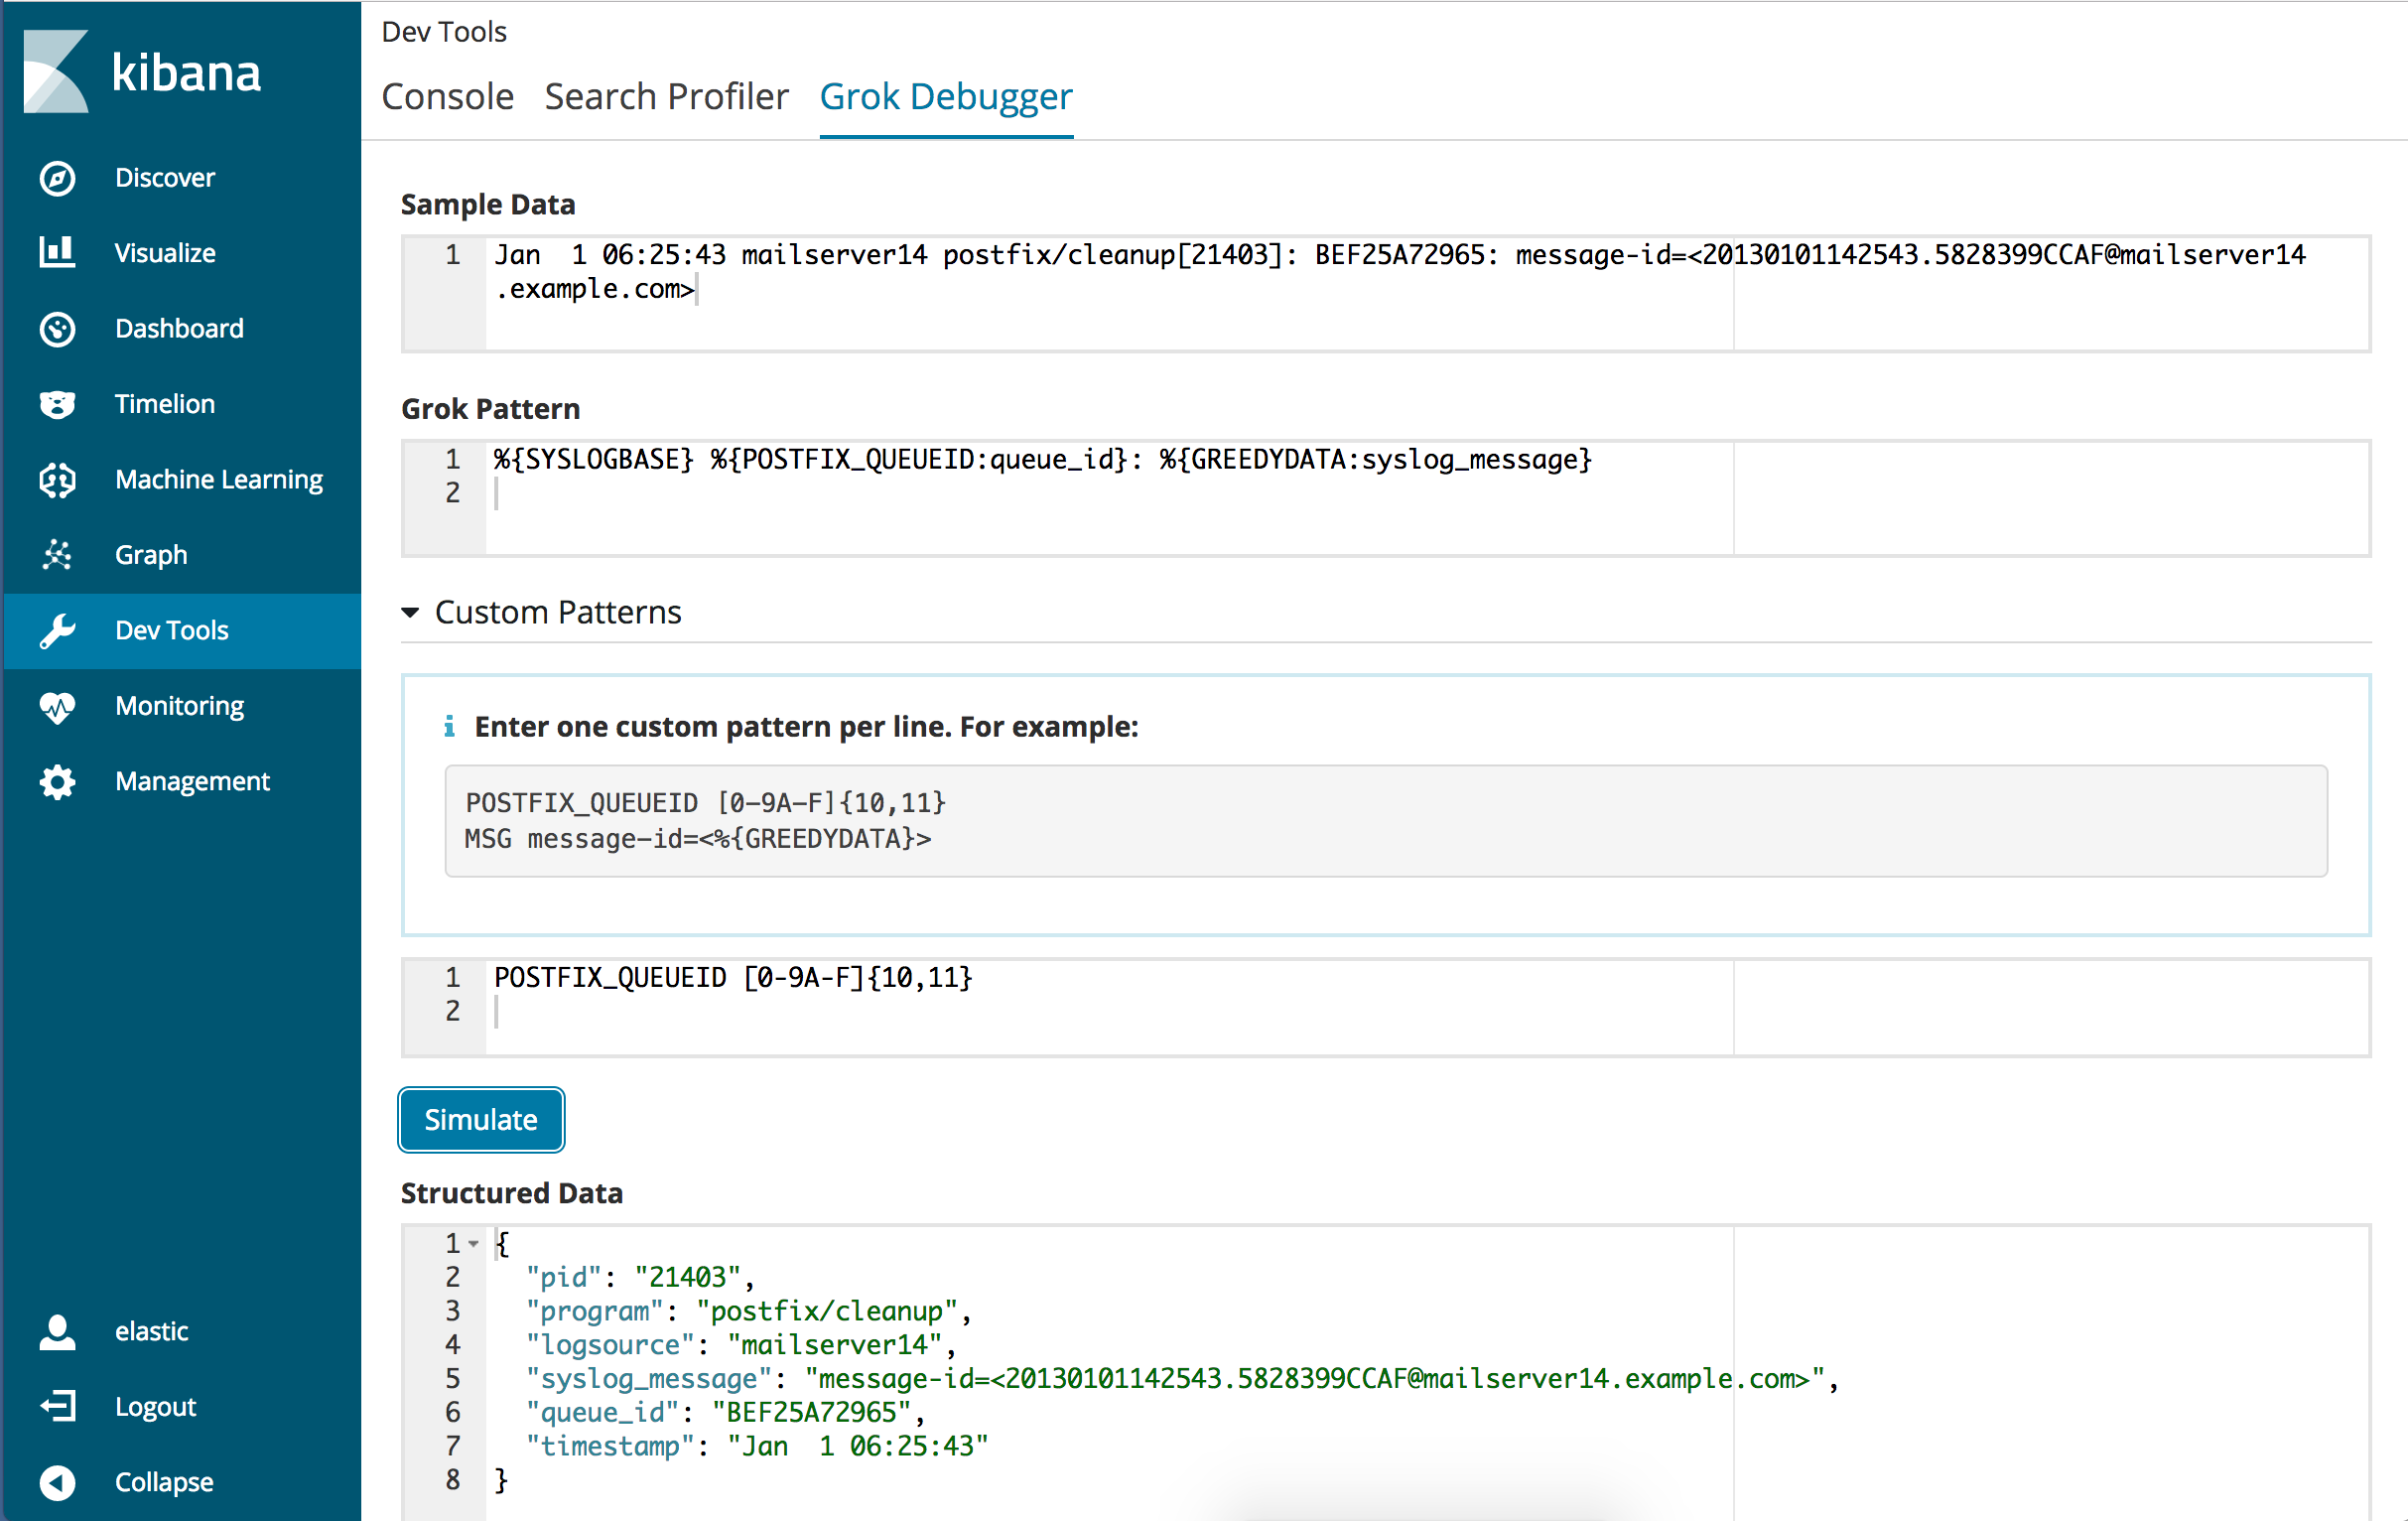
Repeat the steps that you followed previously to enter the sample message and grok pattern. For this example, let’s use the following sample message:
Jan 1 06:25:43 mailserver14 postfix/cleanup[21403]: BEF25A72965: message-id=<20130101142543.5828399CCAF@mailserver14.example.com>
And this grok pattern:
%{SYSLOGBASE} %{POSTFIX_QUEUEID:queue_id}: %{MSG:syslog_message}Notice that the grok pattern references custom patterns called
POSTFIX_QUEUEIDandMSG. -
Expand Custom Patterns and enter pattern definitions for any custom patterns that you want to use in the grok expression. Each pattern definition must be specified on its own line.
For the grok pattern in the example, you need to specify pattern definitions for
POSTFIX_QUEUEIDandMSG:POSTFIX_QUEUEID [0-9A-F]{10,11} MSG message-id=<%{GREEDYDATA}> -
Click the Simulate button.
Under Output, you’ll see the simulated output event that results from applying the grok pattern that contains the custom pattern:
If an error occurs, you can view the error message and continue iterating over the custom pattern until there are no errors and the output matches the event that you expect.