Visualizing Application Bottlenecks
editVisualizing Application Bottlenecks
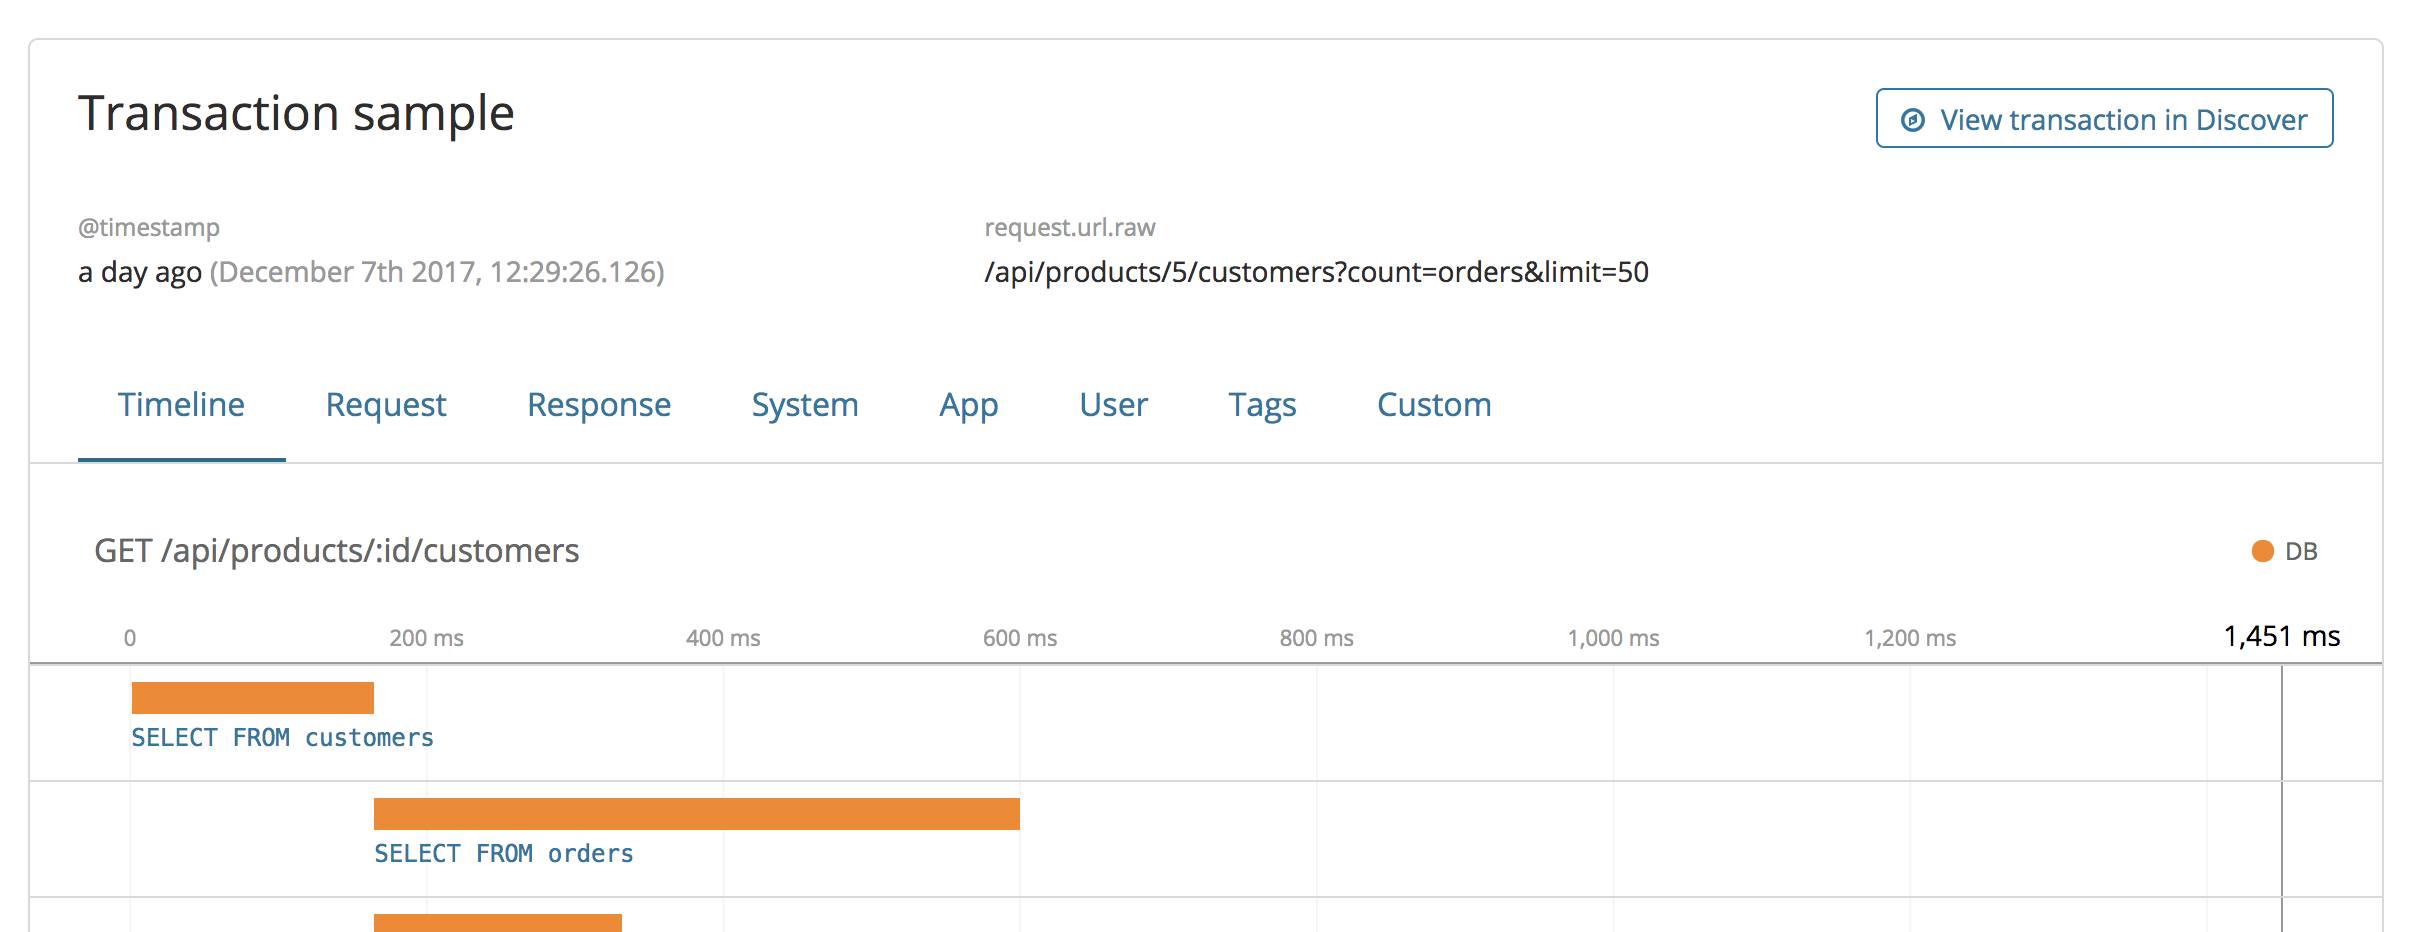
editElastic APM monitors transactions and errors in your application. A transaction can be a request to your server or a batch job or a custom transaction type. You can see information about response times, requests per minute, and status codes per endpoint. You can also dive into a specific request sample and get a complete waterfall view of what your application is spending its time on. For example, you might see that the bottlenecks are in database queries, cache calls, or external requests. This information enables you to easily compare and debug fast responses to slow responses.
For each incoming request and each application error, you can also see contextual information such as the request header, user information, system values, or custom data that you manually attached to the request.
Having access to application-level insights with just a few clicks can drastically decrease the time you spend debugging errors, slow response times, and crashes.