Getting Started
editGetting Started
editGraph is automatically enabled in Elasticsearch and Kibana.
To start exploring connections in your data:
-
Open Kibana in your web browser and log in. If you are running Kibana
locally, go to
http://localhost:5601/. -
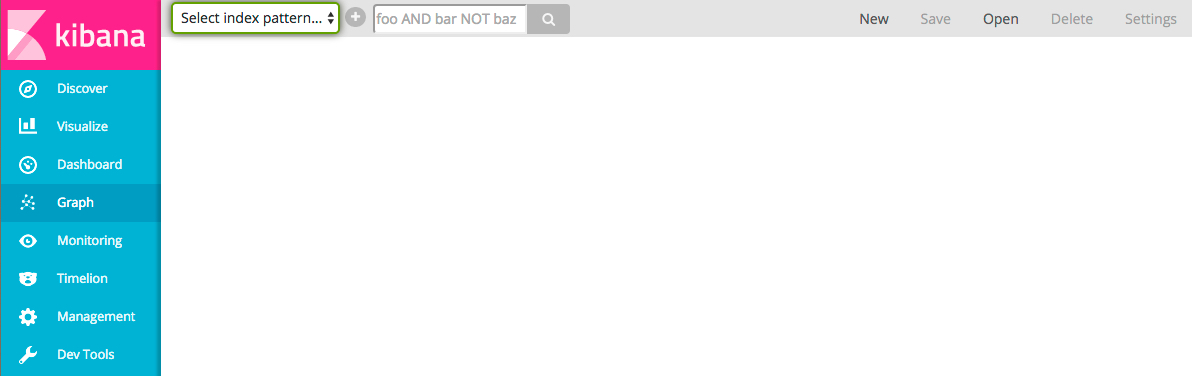
Click Graph in the side navigation to open the graph explorer.
-
Select an index pattern to specify what indices you want to explore.
For example, if you are indexing log data with Logstash, you could select the
logstash-*index pattern to visualize connections within the log entries. -
Select one or more multi-value fields that contain the terms you want to
graph. The vertices in the graph are selected from these terms. If you’re
visualizing connections between Apache log entries, you could select the
url.rawfield and thegeo.srcfield so you can look at which pages are being accessed from different locations. -
Enter a search query to discover relationships between terms in the selected fields. For example, to generate a graph of the successful requests to particular pages from different locations, you could search for the 200 response code:
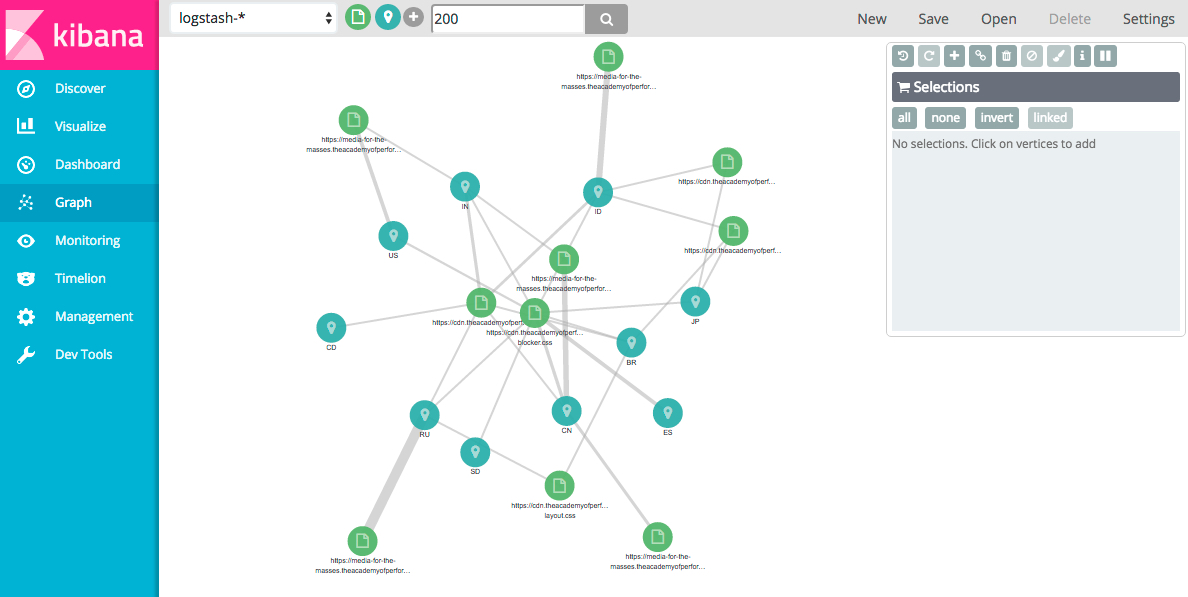
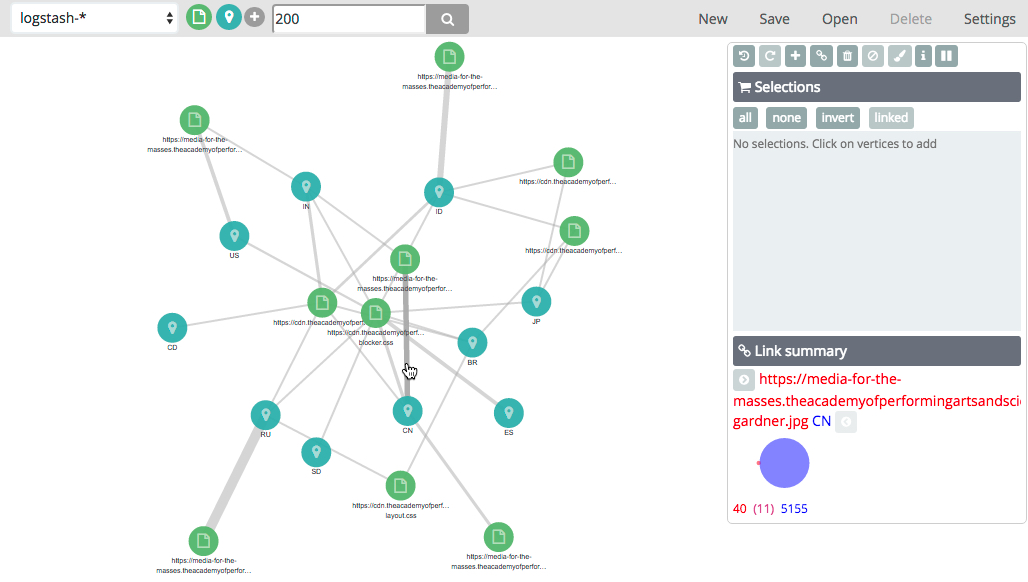
The weight of the connection between two vertices indicates how strongly they are related. You can click any connection to view more information about the relationship:
Once you have your initial graph, you can use the toolbar buttons to explore
additional connections. Click the Expand button
 to display additional vertices
that connect to your graph. Click the Link button
to display additional vertices
that connect to your graph. Click the Link button
 to display additional
connections between the displayed vertices. To explore a particular area of the
graph, select the vertices you are interested in and click the Expand or Link button.
To step back through your changes to the graph, click the Undo button
to display additional
connections between the displayed vertices. To explore a particular area of the
graph, select the vertices you are interested in and click the Expand or Link button.
To step back through your changes to the graph, click the Undo button
 .
.
To see more relationships within your data, you can submit additional queries.
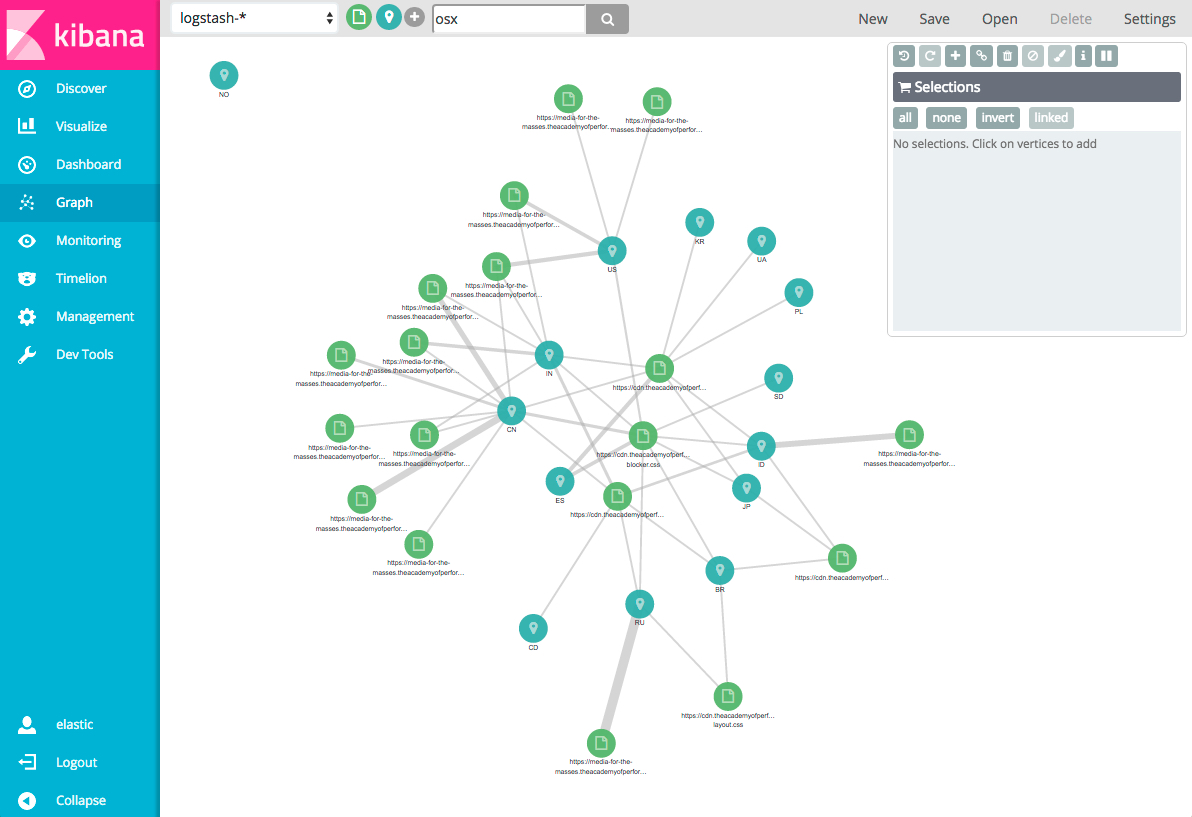
By default, when you submit a search query Graph searches all available
fields. You can constrain your search to a particular field using the Lucene
query syntax. For example, machine.os: osx.