Using mathematical functions
editUsing mathematical functions
editYou’ve learned how to create and style a Timelion visualization in the previous two sections. This section will explore the mathematical functions Timelion offers. You will continue to use the Metricbeat data to create a new Timelion visualization for inbound and outbound network traffic. To start, you’ll need to add a new Timelion visualization to the sheet.
In the top menu, click Add to add a second visualization. When added to the sheet, you’ll notice that the query bar has been replaced with the default .es(*) expression. This is because the query is associated with the visualization on the Timelion sheet you have selected.
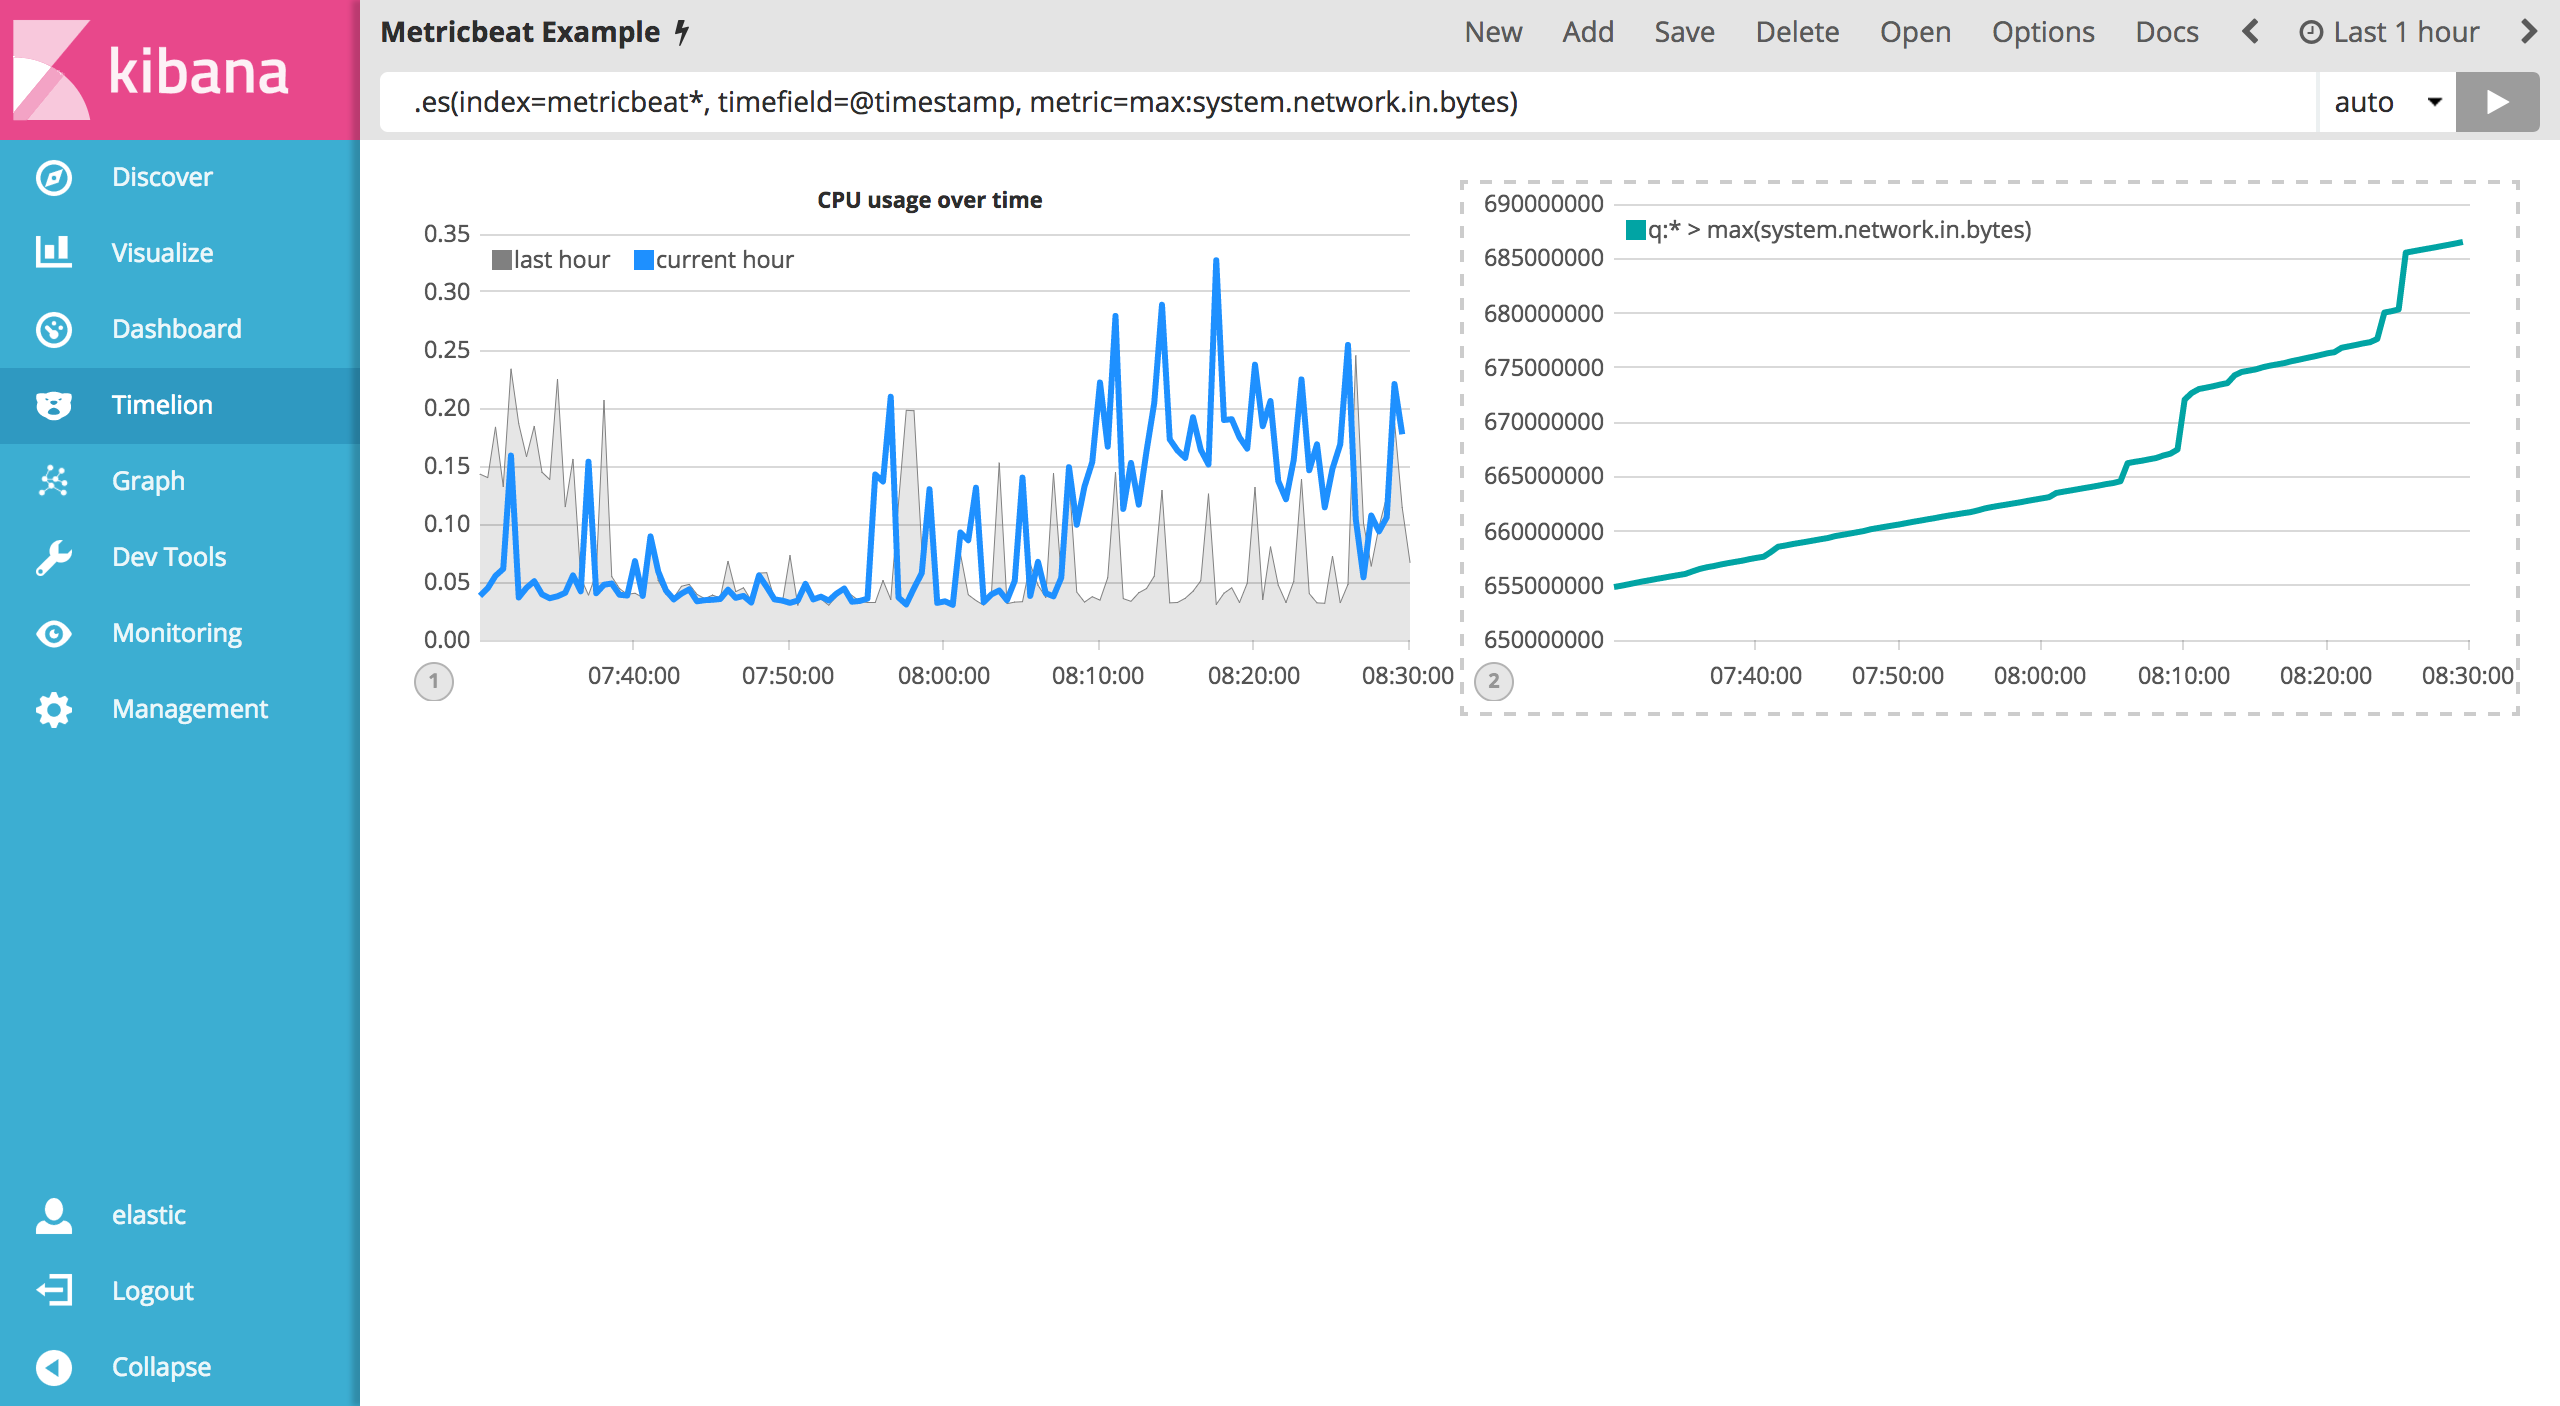
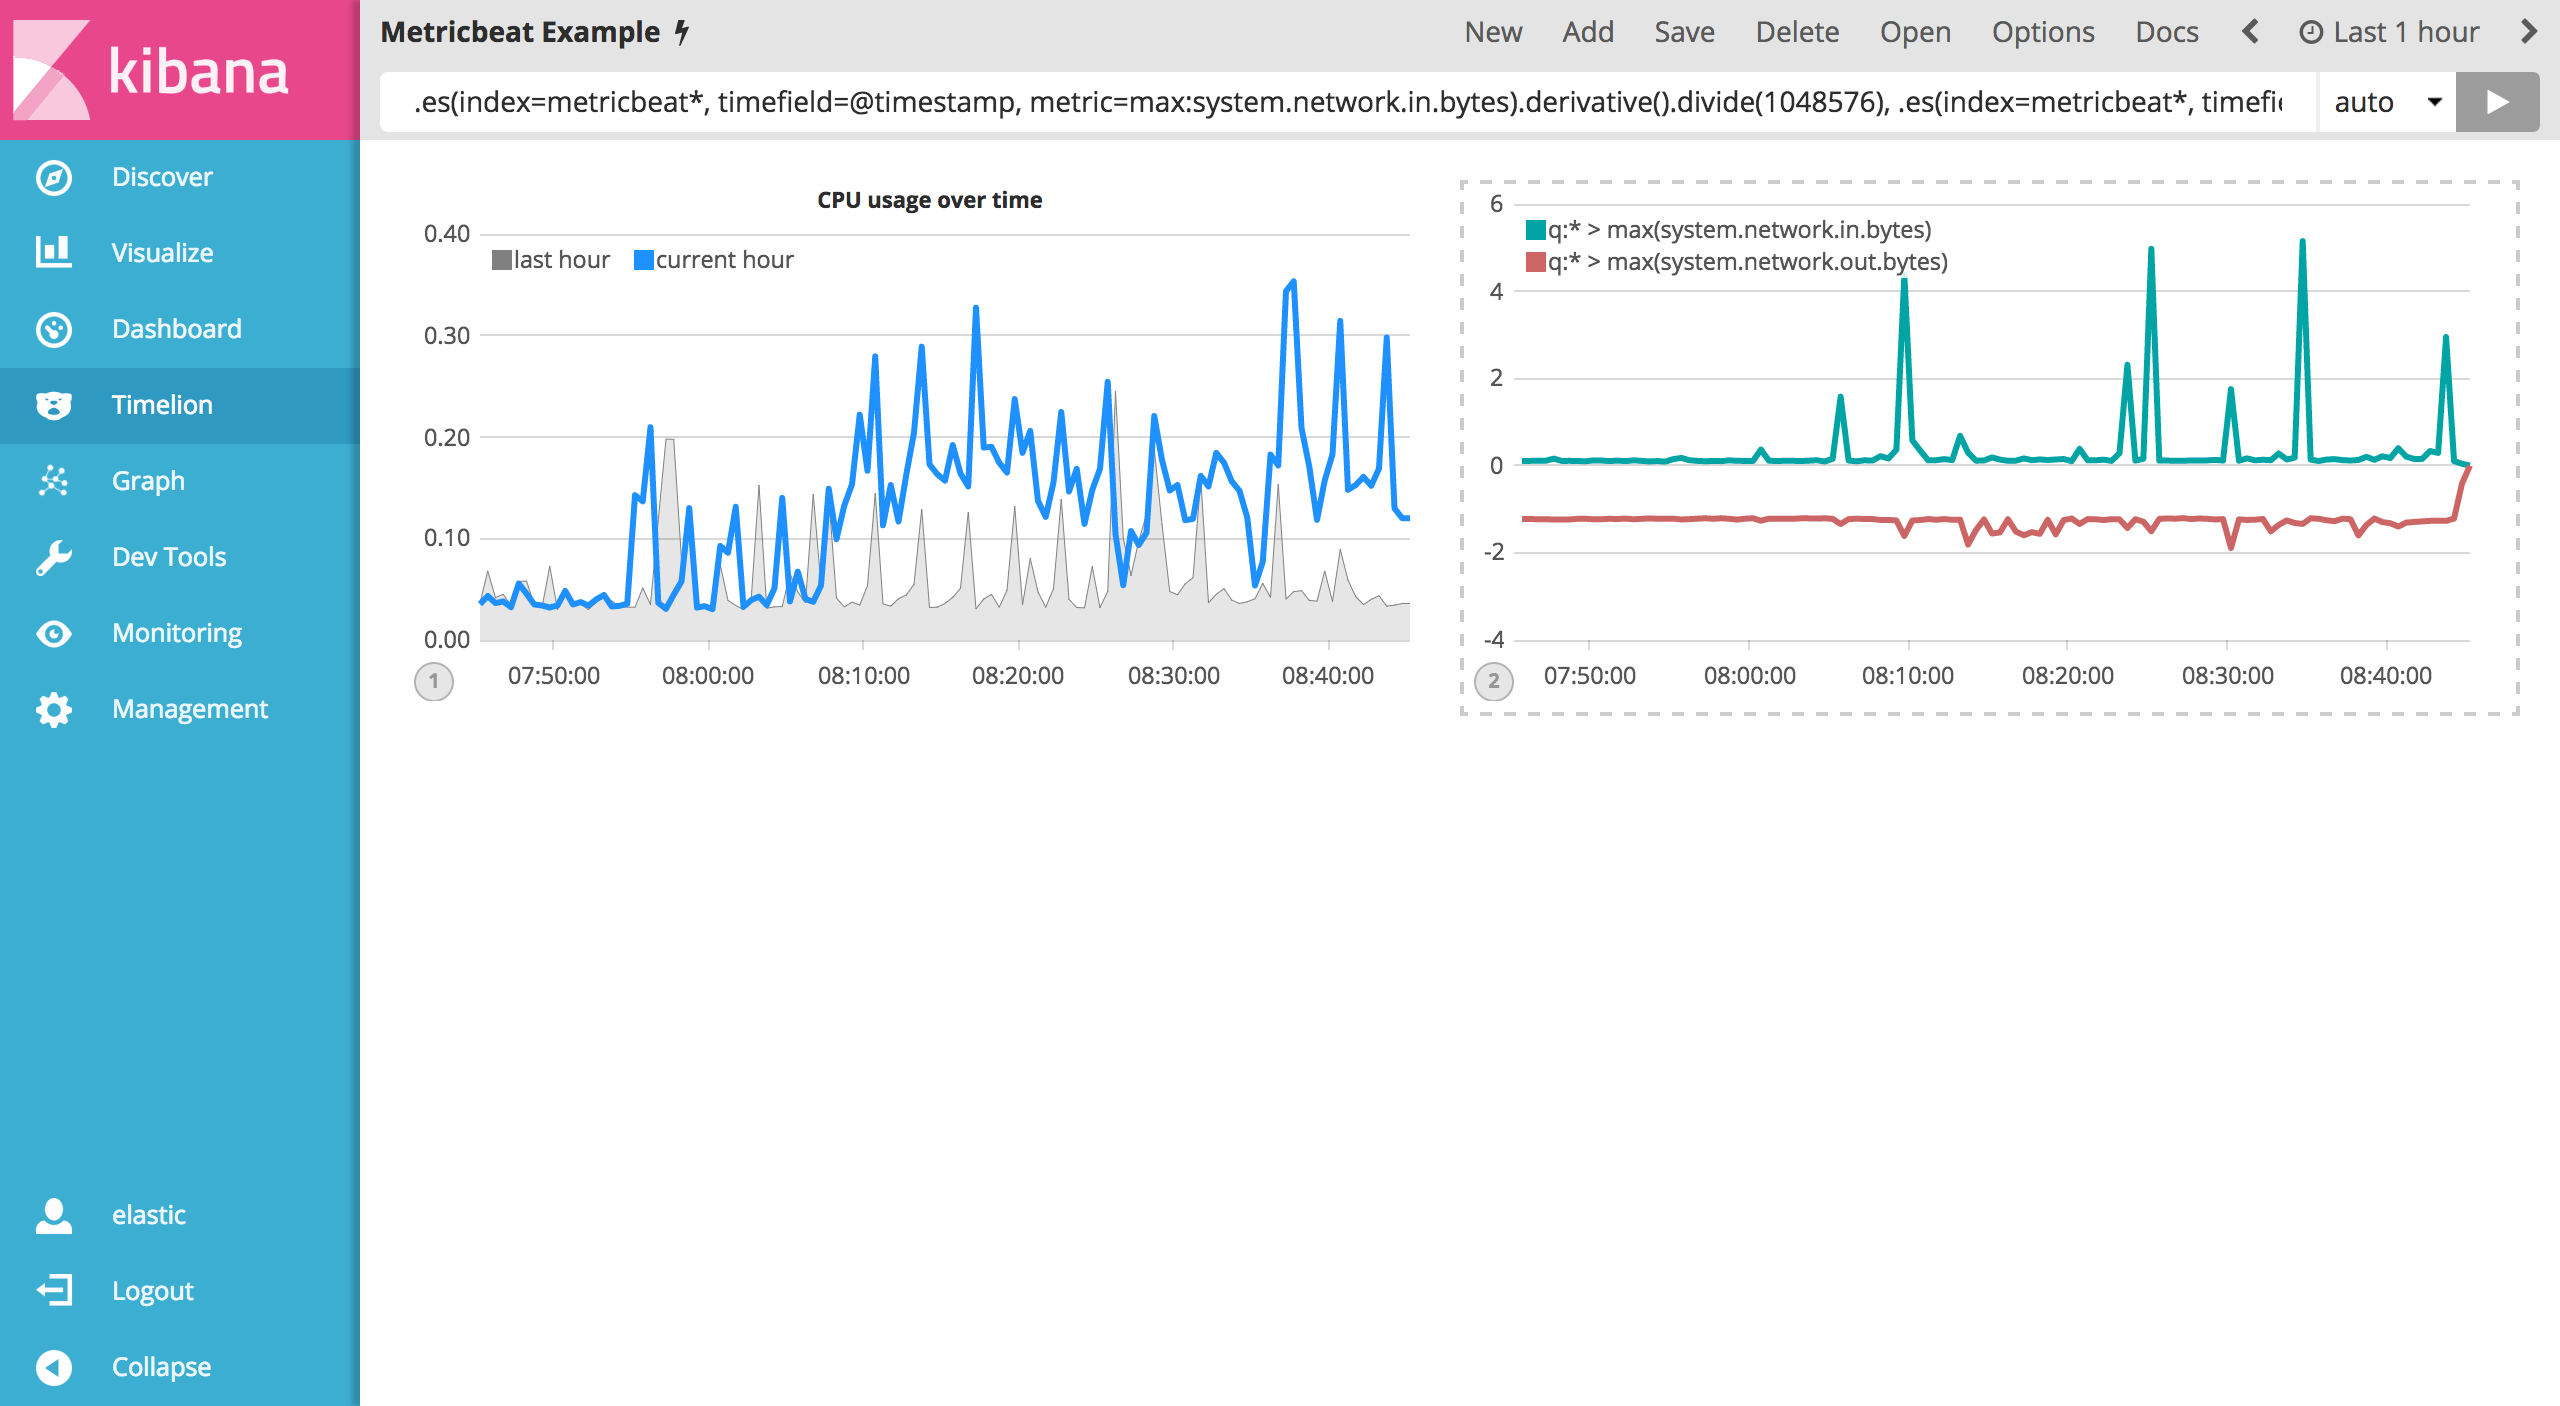
To start tracking the inbound / outbound network traffic, your first expression will calculate the maximum value of system.network.in.bytes. Enter the expression below into your Timelion query bar:
.es(index=metricbeat*, timefield=@timestamp, metric=max:system.network.in.bytes)
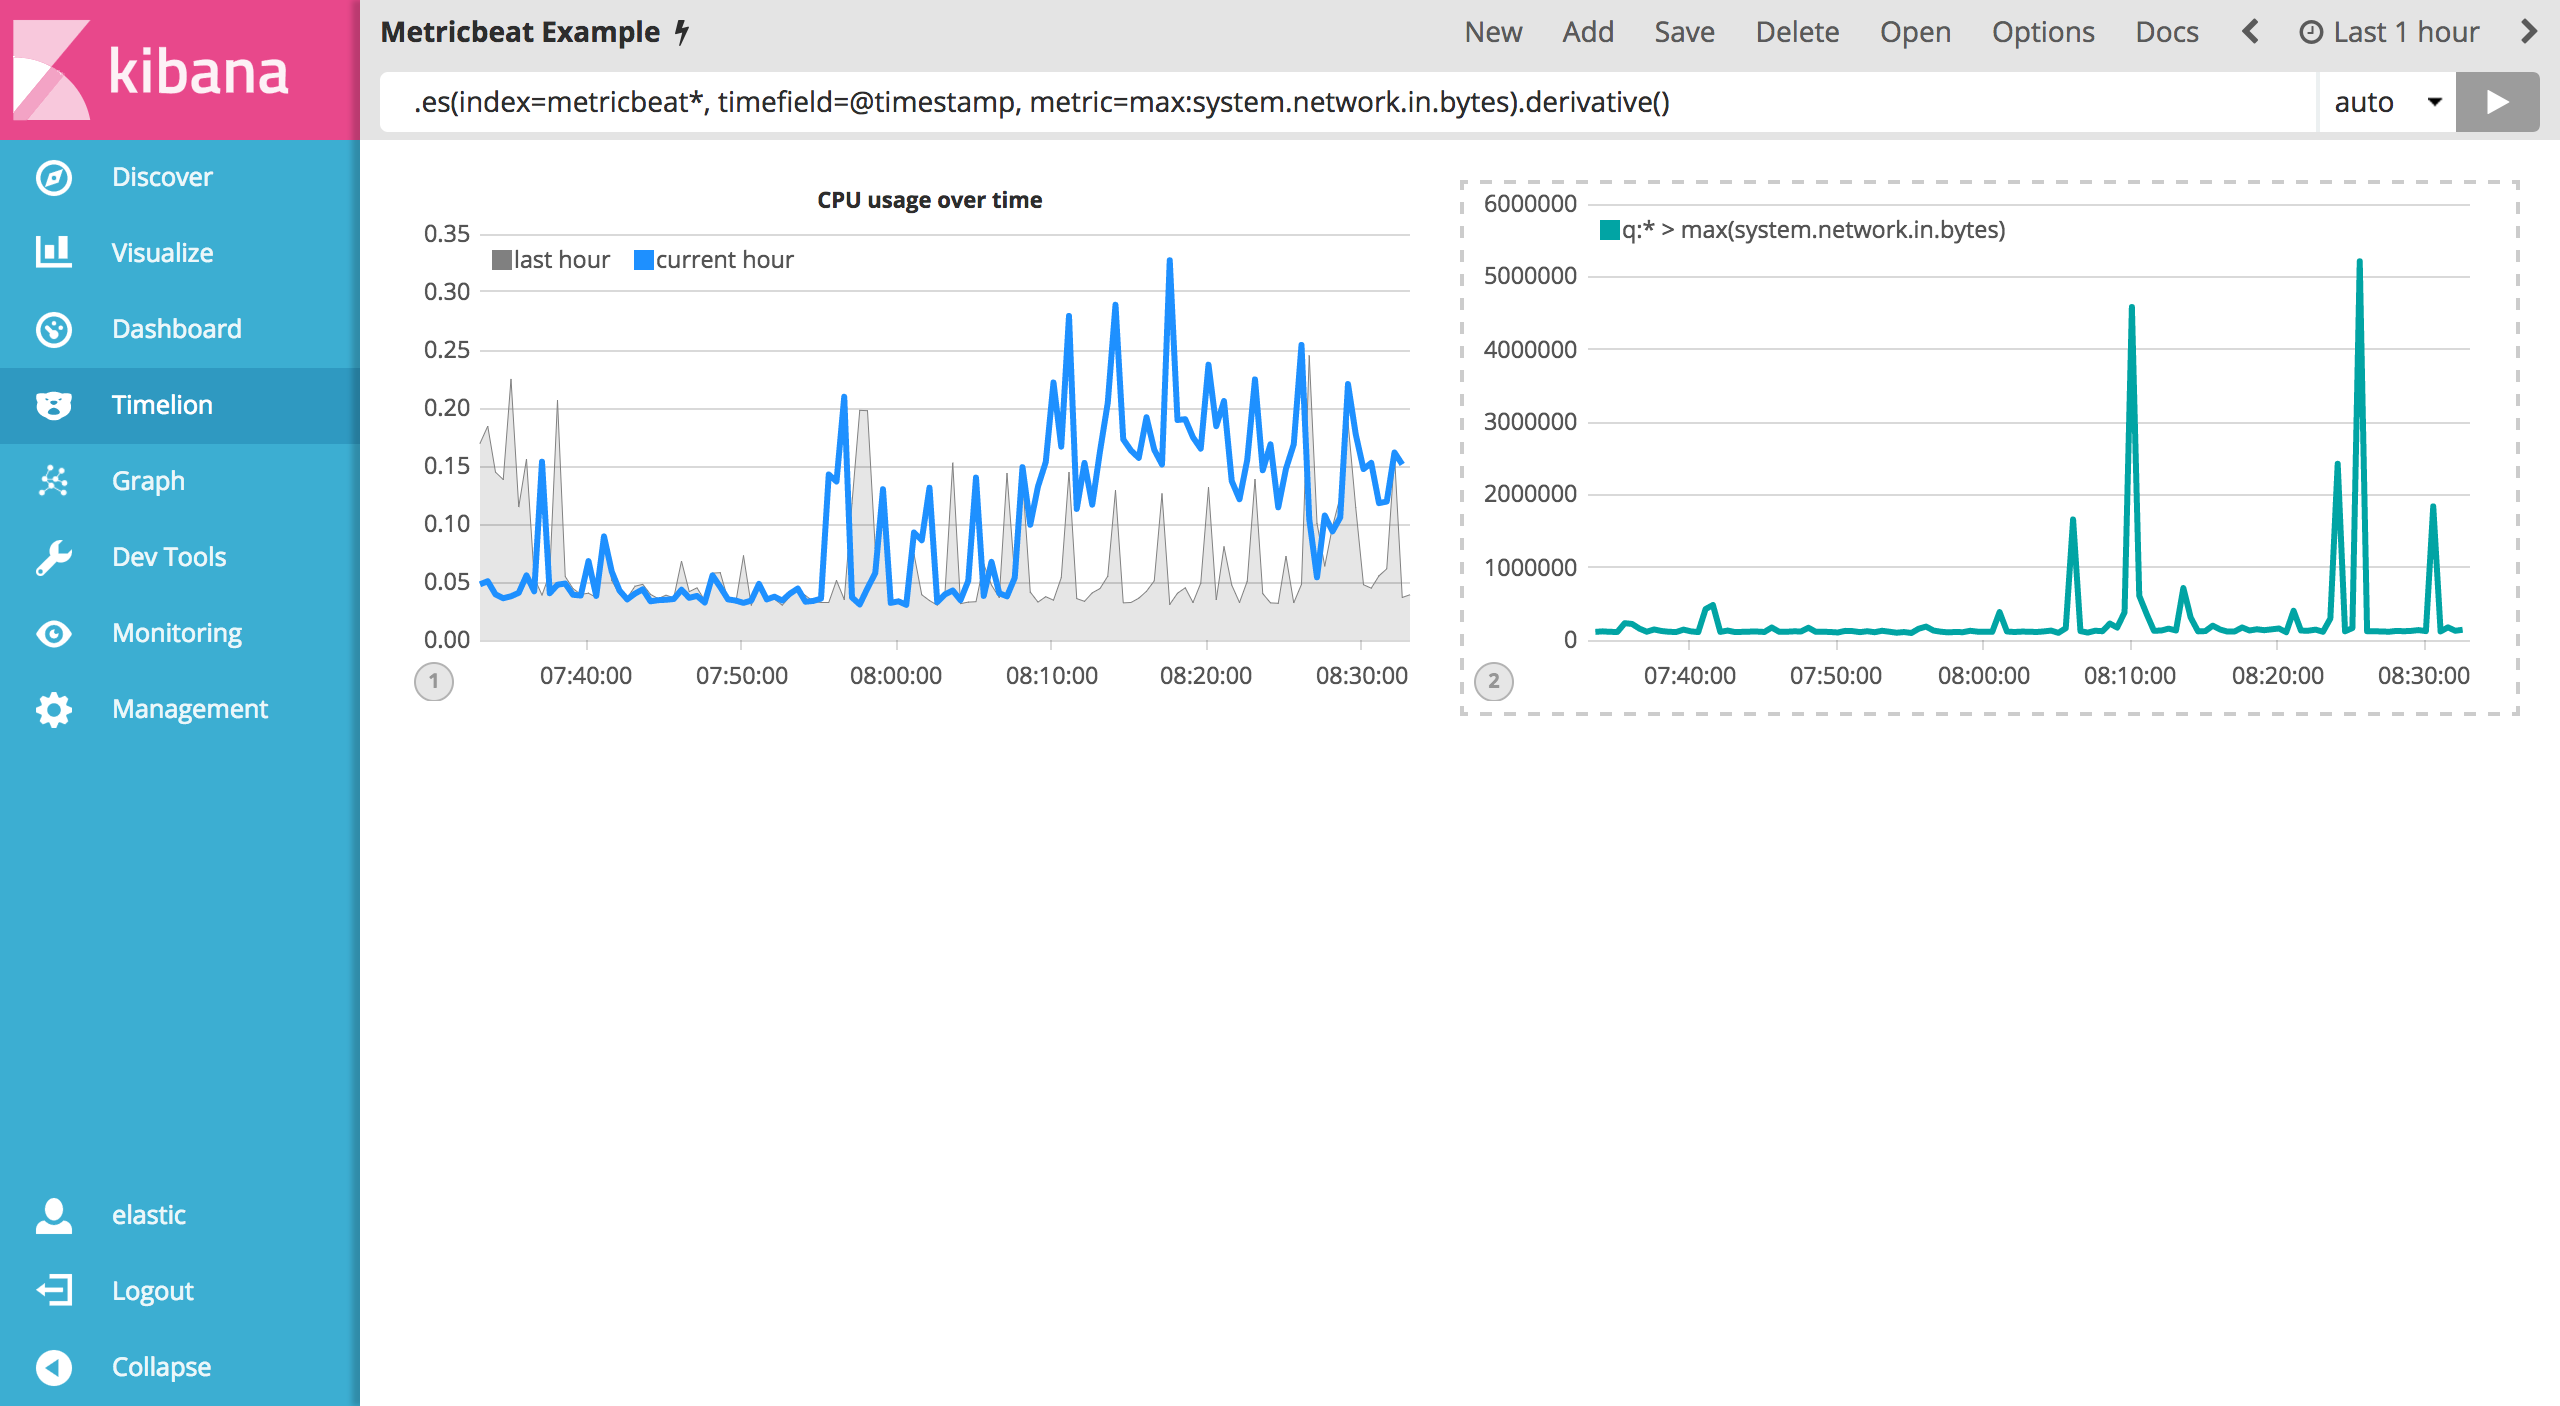
Monitoring network traffic is much more valuable when plotting the rate of change. The derivative() function is used do just that - plot the change in values over time. This can be easily done by appending the .derivative() to the end of an expression. Use the following expression to update your visualization:
.es(index=metricbeat*, timefield=@timestamp, metric=max:system.network.in.bytes).derivative()
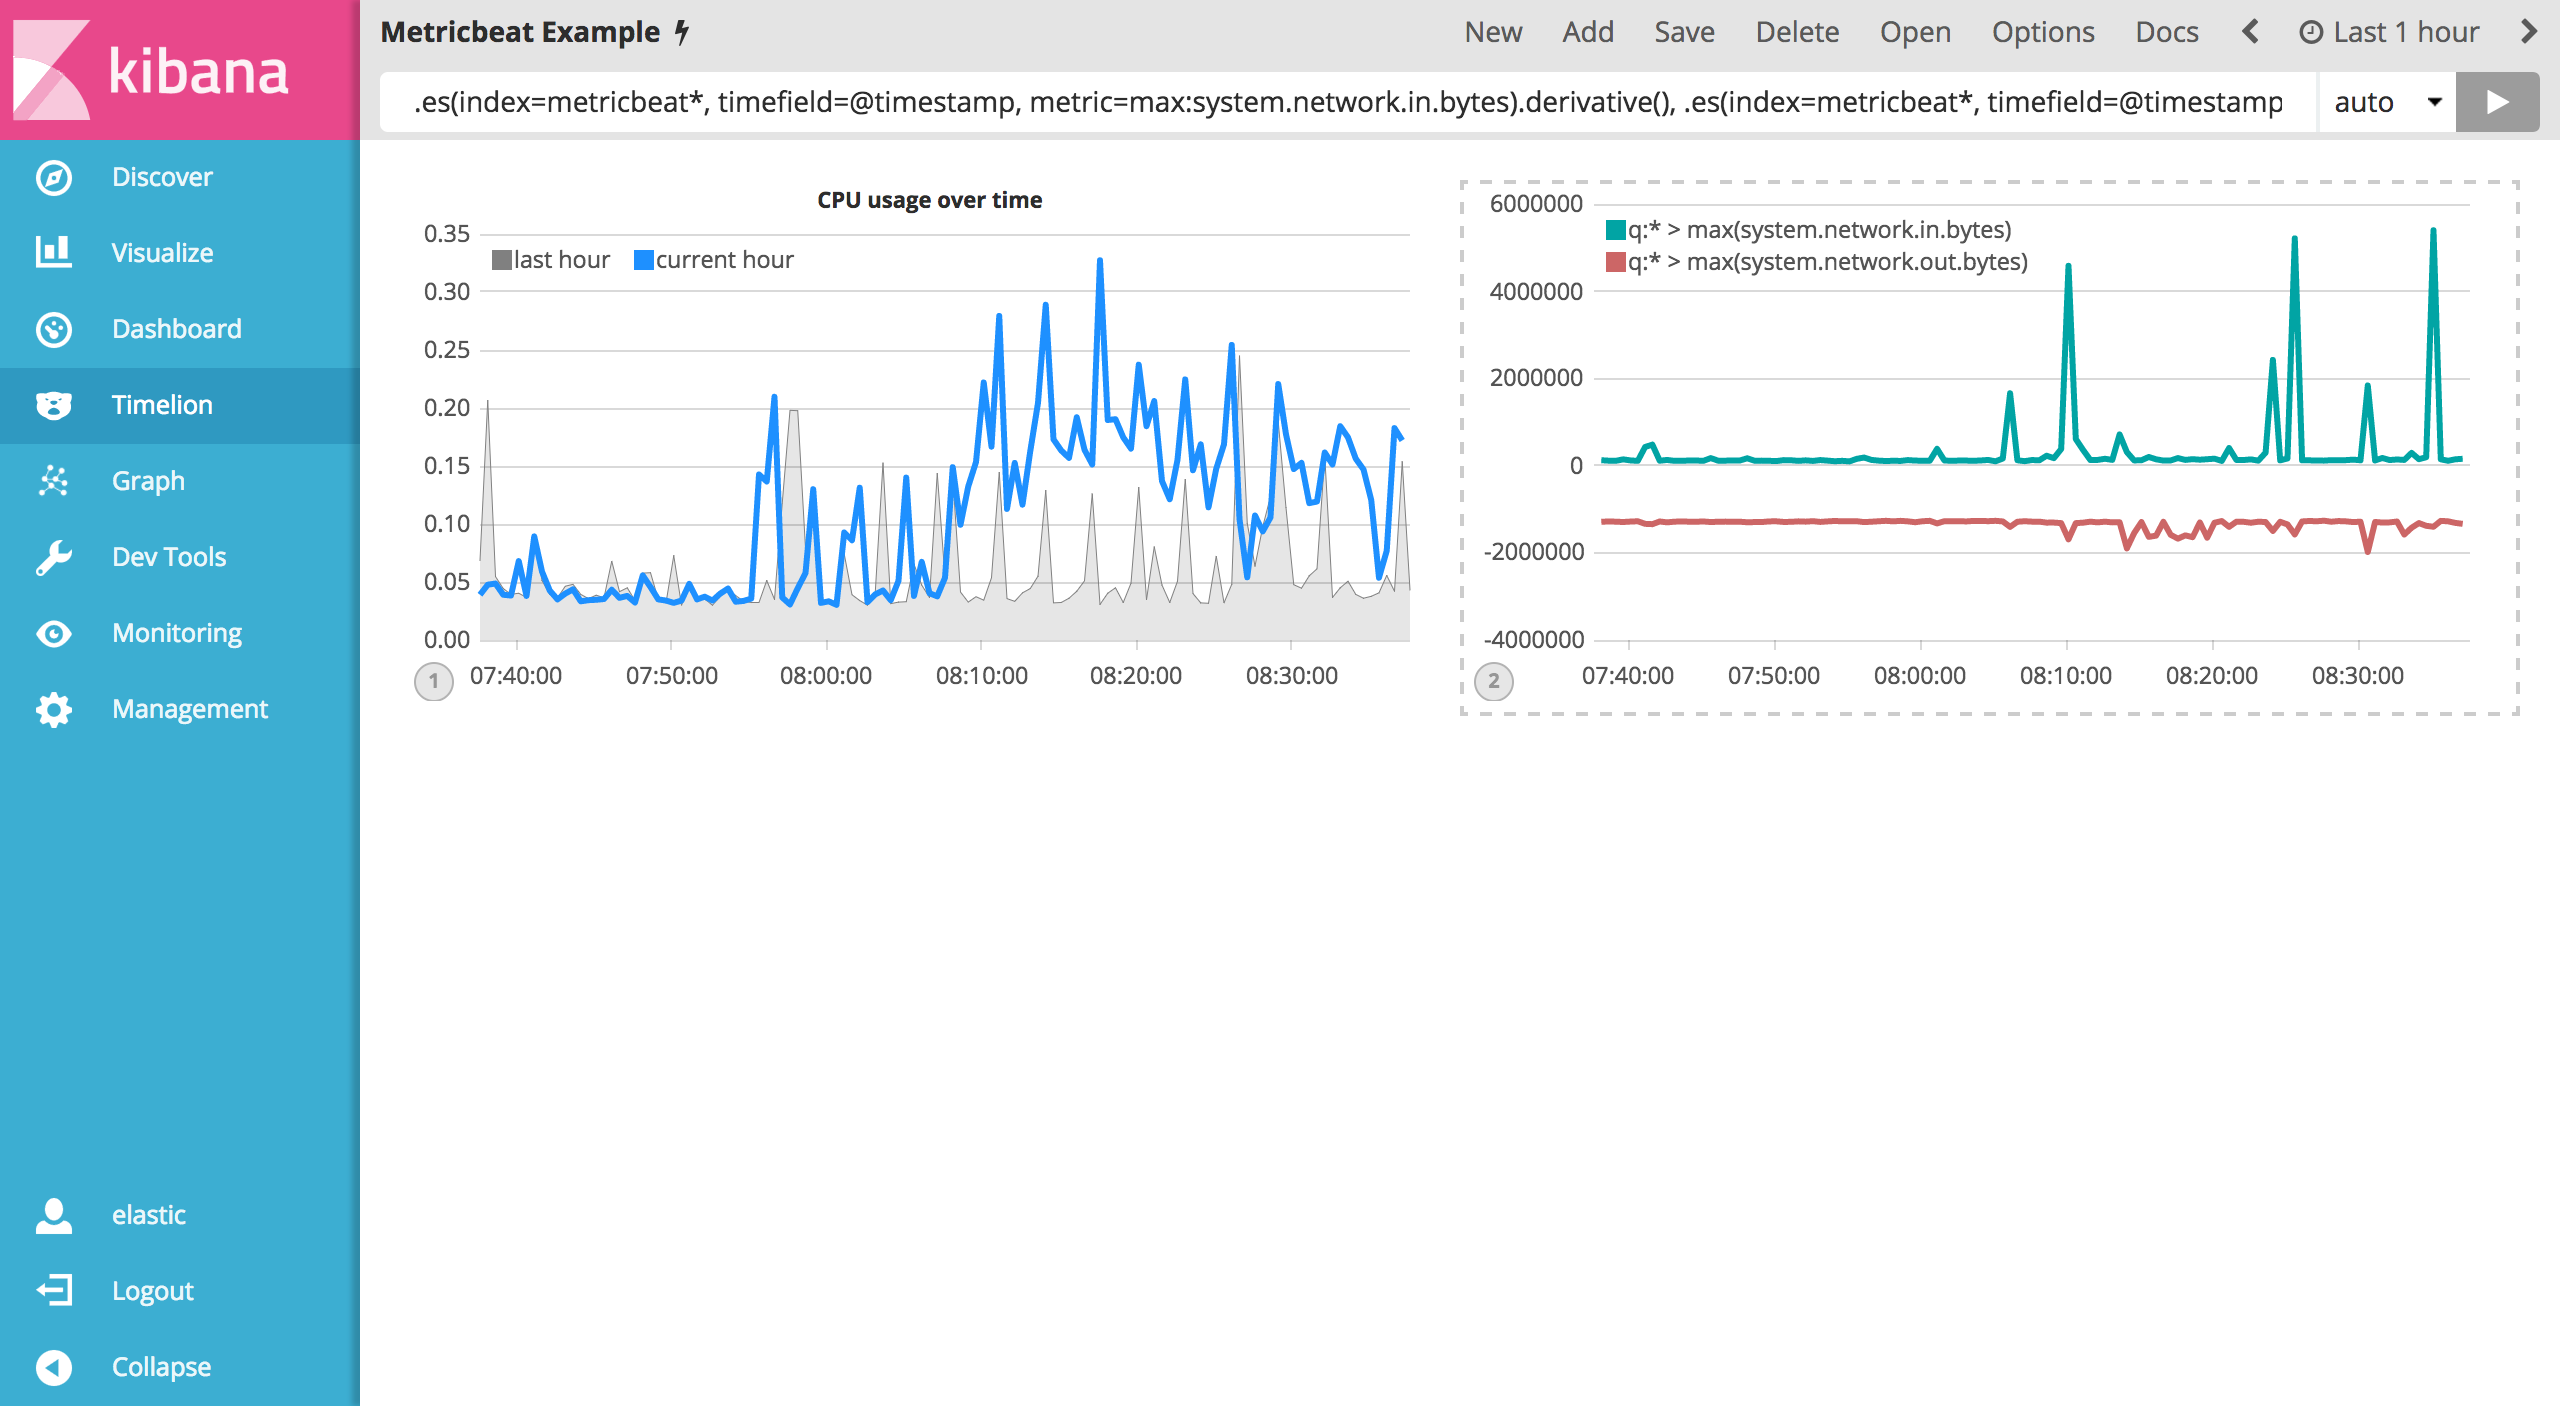
Now for the outbound traffic. You’ll need to add a similar calculation for system.network.out.bytes. Since outbound traffic is leaving your machine, it makes sense to represent this metric as a negative number. The .multiply() function will multiply the series by a number, the result of a series or a list of series. For this example, you will use .multiply(-1) to convert the outbound network traffic to a negative value. Use the following expression to update your visualization:
.es(index=metricbeat*, timefield=@timestamp, metric=max:system.network.in.bytes).derivative(), .es(index=metricbeat*, timefield=@timestamp, metric=max:system.network.out.bytes).derivative().multiply(-1)
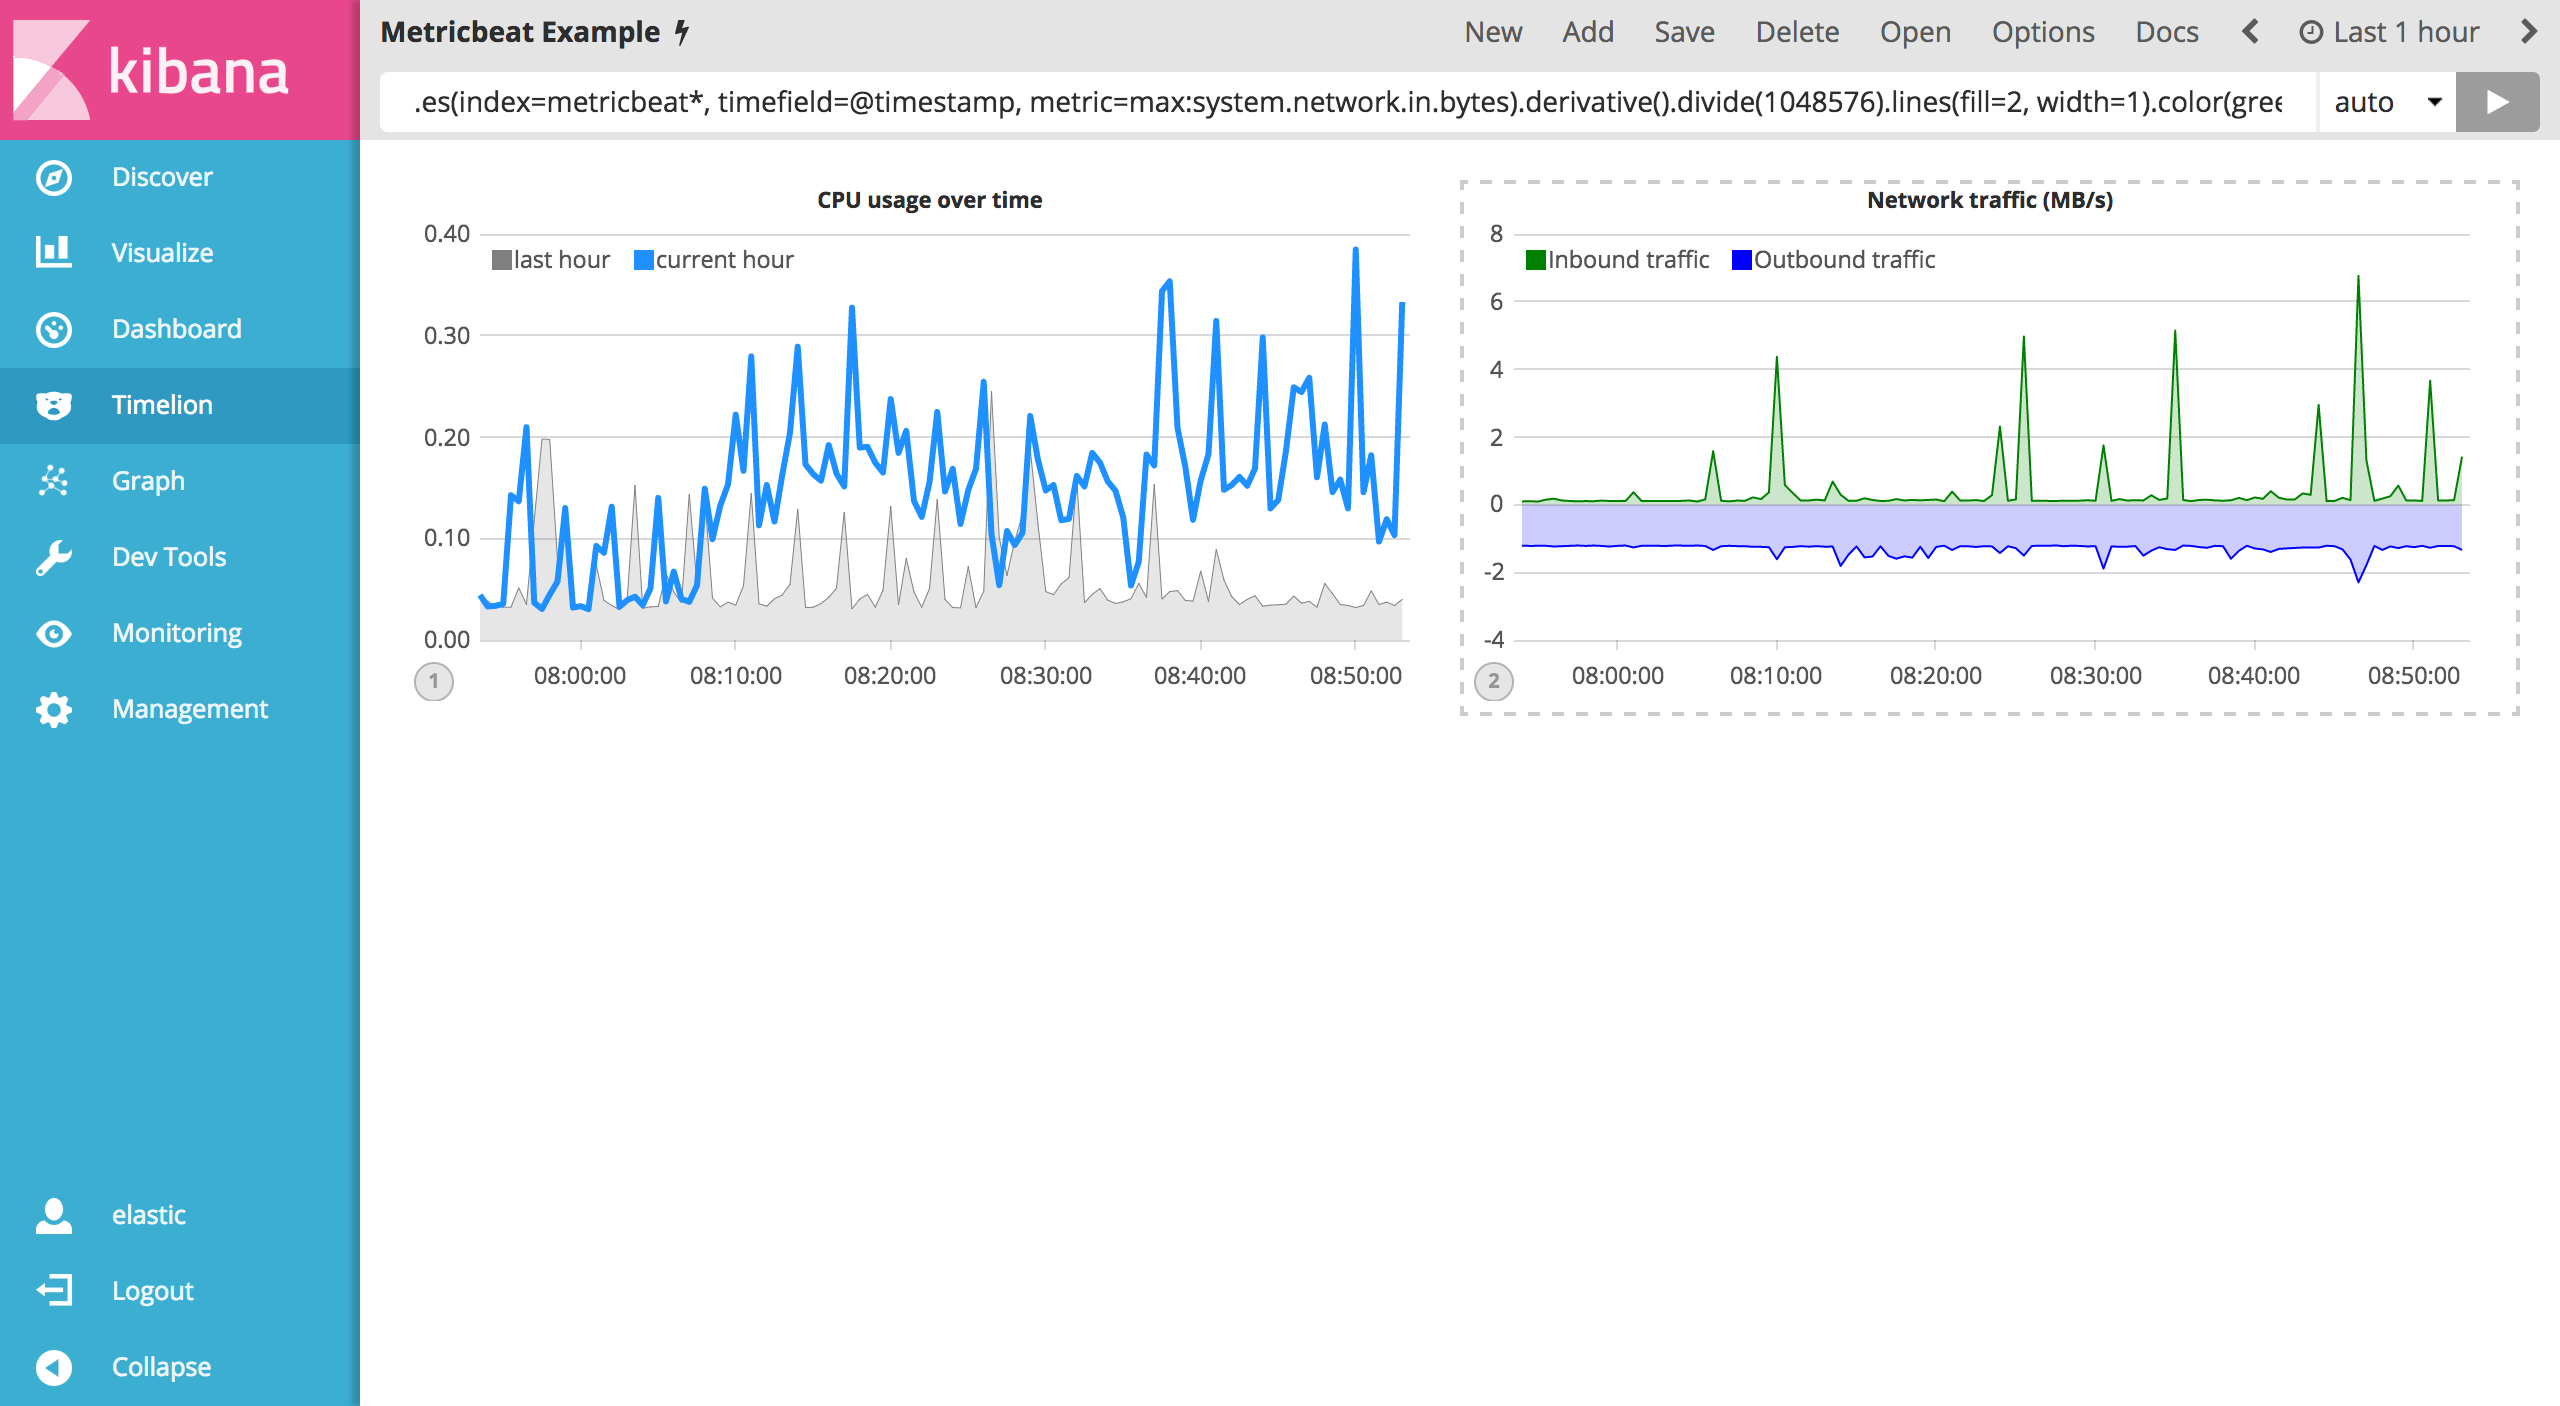
To make this visualization a bit easier to consume, convert the series from bytes to megabytes. Timelion has a .divide() function that can be used. .divide() accepts the same input as .multiply() and will divide the series by the divisor defined. Use the following expression to update your visualization:
.es(index=metricbeat*, timefield=@timestamp, metric=max:system.network.in.bytes).derivative().divide(1048576), .es(index=metricbeat*, timefield=@timestamp, metric=max:system.network.out.bytes).derivative().multiply(-1).divide(1048576)
Utilizing the formatting functions .title(), .label(), .color(), .lines() and .legend() learned in the last section, let’s clean up the visualization a bit. Use the following expression to update your visualization:
.es(index=metricbeat*, timefield=@timestamp, metric=max:system.network.in.bytes).derivative().divide(1048576).lines(fill=2, width=1).color(green).label("Inbound traffic").title("Network traffic (MB/s)"), .es(index=metricbeat*, timefield=@timestamp, metric=max:system.network.out.bytes).derivative().multiply(-1).divide(1048576).lines(fill=2, width=1).color(blue).label("Outbound traffic").legend(columns=2, position=nw)
Save your changes and continue on to the next section to learn about conditional logic and tracking trends.