How to ingest data into Elasticsearch Service
Elasticsearch is omnipresent for data search and analytics. Developers and communities leverage Elasticsearch for the most diverse use cases, from application search and website search, to logging, infrastructure monitoring, APM, and security analytics. While there now exist freely available solutions for these use cases, developers need to feed their data into Elasticsearch in the first place.
This article describes a few of the most common ways to ingest data into Elasticsearch Service. This might be a cluster which is either hosted on Elastic Cloud or on its on-premise variant, Elastic Cloud Enterprise. While we focus on these services, data ingestion into a self-managed Elasticsearch cluster looks almost the same. The only thing that changes is how you address the cluster.
Before we dive into technical details: should you experience any questions or issues while following this article, please do not hesitate to head over to discuss.elastic.co. A lively community is likely to be able to answer your questions.
Now, get ready to dive into data ingestion using the following methods:
- Elastic Beats
- Logstash
- Language clients
- Kibana Dev Tools
Ingesting into Elasticsearch Service
Elasticsearch provides a flexible RESTful API for communication with client applications. REST calls are therefore used to ingest data, perform search and data analytics, as well as to manage the cluster and its indices. Under the hood, all of the described methods rely on this API to ingest data into Elasticsearch.
For the remainder of this article, we assume that you have already created your Elasticsearch Service cluster. If you have not yet done so, sign up for a free trial on Elastic Cloud. Once you create a cluster, you will be provided with both a Cloud ID and password for the elastic superuser account. The Cloud ID is of the form cluster_name:ZXVy...Q2Zg==. It encodes the URL of your cluster and, as we will see, simplifies data ingestion into it.
Elastic Beats
Elastic Beats are a set of lightweight data shippers that allow to conveniently send data to Elasticsearch Service. Being lightweight, Beats do not incur much runtime overhead and they can therefore run and collect data on devices with limited hardware resources, such as IoT devices, edge device, or embedded devices. Beats are the perfect match if you need to collect data without having the resources to run resource-intensive data collectors. This kind of pervasive data collection on all of your networked devices allows you to quickly detect and react upon, for example, system-wide issues and security incidents.
Of course, Beats are not limited to resource-constrained systems. They can also be used on systems that have more hardware resources available.
The Beats fleet: an overview
Beats come in various flavors to collect different kinds of data:
- Filebeat allows you to read, preprocess and ship data from sources that come in the form of files. Even though most users use Filebeat to read log files, any sort of nonbinary file format is supported. Filebeat further supports a number of other data sources including TCP/UDP, containers, Redis, and Syslog. An abundance of modules ease the collection and parsing of log formats for common applications such as Apache, MySQL, and Kafka.
- Metricbeat collects and preprocesses system and service metrics. System metrics include information about running processes, as well as CPU / memory / disk / network utilization numbers. Modules are available to collect data from many different services including Kafka, Palo Alto Networks, Redis, and many more.
- Packetbeat collects and preprocesses live networking data, therefore enabling application monitoring, as well as security and network performance analytics. Among others, Packetbeat supports the following protocols: DHCP, DNS, HTTP, MongoDB, NFS, and TLS.
- Winlogbeat is all about capturing event logs from Windows operating systems, including application events, hardware events, and security and system events. The vast information available from the Windows event log is of much interest for many use cases.
- Auditbeat detects changes to critical files and collects events from the Linux Audit Framework. Different modules ease its deployment, which is mostly used in the security analytics use cases.
- Heartbeat uses probing to monitor the availability of systems and services. Heartbeat is therefore useful in a number of scenarios such as infrastructure monitoring and security analytics. ICMP, TCP, and HTTP are supported protocols.
- Functionbeat collects logs and metrics from within a serverless environment such as AWS Lambda.
Once you have decided which of those Beats to use in your specific scenario, getting started is as easy as described in the next section.
Getting started with Beats
In this section, we take Metricbeat as an example on how to get started with Beats. Steps that need to be taken for other Beats are very similar. Please also refer to the documentation and follow the steps for your specific Beat and operating system.
- Download and install the desired Beat. There are numerous ways to install Beats, but most users choose to either use the Elastic-provided repositories for the operating system's package manager (DEB/RPM), or to simply download and unzip the provided tgz/zip bundles.
- Configure the Beat and enable any desired modules.
- For example, to collect metrics about Docker containers running on your system, enable the Docker module with sudo metricbeat modules enable docker if you installed using the package manager. If instead you unzipped the tgz/zip bundle, use /metricbeat modules enable docker.
- The Cloud ID is a convenient way to specify the Elasticsearch Service to which the collected data is sent. Add the Cloud ID and authentication information to the Metricbeat configuration file (metricbeat.yml):
cloud.id: cluster_name:ZXVy...Q2Zg==
cloud.auth: "elastic:YOUR_PASSWORD"
    <ul><li>As mentioned earlier, <code>cloud.id</code> was provided to you upon creation of your cluster. <code>cloud.auth</code> is a colon-separated concatenation of a username and password that have been granted sufficient privileges within the Elasticsearch cluster.</li><li>To get started quickly, use the elastic superuser and the password that has been provided upon cluster creation. You can find the configuration file in the <code>/etc/metricbeat</code> directory if you installed using the package manager, or in the unzipped directory, if you used the tgz/zip bundle.</li></ul>
- Load prepackaged dashboards into Kibana. Most Beats and their modules come with predefined Kibana dashboards. Load those into Kibana with sudo metricbeat setup if you installed using the package manager; or with ./metricbeat setup in the unzipped directory, if you used the tgz/zip bundle.
- Run the Beat. Use sudo systemctl start metricbeat if you installed using your package manager on a systemd-based Linux system; or use ./metricbeat -e if you installed using the tgz/zip bundle
If all works as expected, data now starts to flow into your Elasticsearch Service.
Explore those prepackaged dashboards
Head over to Kibana within your Elasticsearch Service to inspect the data:
- Within Kibana Discover, select the metricbeat-* index pattern and you will be able to see the individual documents that have been ingested.
- The Kibana Infrastructure tab allows you to inspect your system and Docker metrics in a more graphical manner by showing different graphs about system resource usage (CPU, memory, network).
- Within Kibana Dashboards, select any of the dashboards prefixed with [Metricbeat System] to explore your data in an interactive manner.
Logstash
Logstash is a powerful and flexible tool to read, process, and ship data of any kind. Logstash provides a number of capabilities that are not currently available or too costly to perform with Beats, such as enriching documents by performing lookups against external data sources. However, this functionality and flexibility of Logstash comes at a price. Also, hardware requirements for Logstash are significantly higher than for Beats. As such, Logstash should generally not be deployed on low-resource devices. Logstash is therefore used as an alternative to Beats, should the functionality of the latter be insufficient for a specific use case.
A common architectural pattern is to combine Beats and Logstash: use Beats to collect data and use Logstash to perform any data processing that Beats are not capable of doing.
Related: Should I use Logstash or Elasticsearch ingest nodes?
Logstash overview
Logstash works by executing event processing pipelines, whereby each pipeline consists of at least one of each of the following:
- Inputs read from data sources. Many data sources are officially supported, including files, http, imap, jdbc, kafka, syslog, tcp, and udp.
- Filters process and enrich the data in various ways. In many cases, unstructured log lines first need to be parsed into a more structured format. Logstash therefore provides, among others, filters to parse CSV, JSON, key/value pairs, delimited unstructured data, and complex unstructured data on the basis of regular expressions (grok filters). Logstash further provides filters to enrich data by performing DNS lookups, adding geoinformation about IP addresses, or by performing lookups against a custom dictionary or an Elasticsearch index. Additional filters allow for diverse transformations of the data, for example, to rename, remove, copy data fields and values (mutate filter).
- Outputs write the parsed and enriched data to data sinks and are the final stage of the Logstash processing pipeline. While many output plugins are available, here we focus on ingestion into Elasticsearch Service using the elasticsearch output.
Get started with Logstash now. Watch our webinar and learn how to install and run Logstash properly.
Logstash sample pipeline
No two use cases are the same. It is therefore likely that you will have to develop Logstash pipelines that suit your very specific data inputs and requirements.
We present a sample Logstash pipeline that
- Reads the Elastic Blogs RSS feed
- Performs some light preprocessing of the data by copying/renaming fields and removing special characters and HTML tags
- Ingests the documents into Elaticsearch
The steps are as follows:
- Install Logstash via your package manager or by downloading and unzipping the tgz/zip file.
- Install the Logstash rss input plugin, which allows for reading RSS data sources: ./bin/logstash-plugin install logstash-input-rss
- Copy the following Logstash pipeline definition to a new file, such as ~/elastic-rss.conf:
input {
  rss {
    url => "/blog/feed"
    interval => 120
  }
}
filter {
  mutate {
    rename => [ "message", "blog_html" ]
    copy => { "blog_html" => "blog_text" }
    copy => { "published" => "@timestamp" }
  }
  mutate {
    gsub => [
      "blog_text", "<.*?>", "",
      "blog_text", "[\n\t]", " "
    ]
    remove_field => [ "published", "author" ]
  }
}
output {
  stdout {
    codec => dots
  }
  elasticsearch {
    hosts => [ "https://<your-elsaticsearch-url>" ]
    index => "elastic_blog"
    user => "elastic"
    password => "<your-elasticsearch-password>"
  }
}
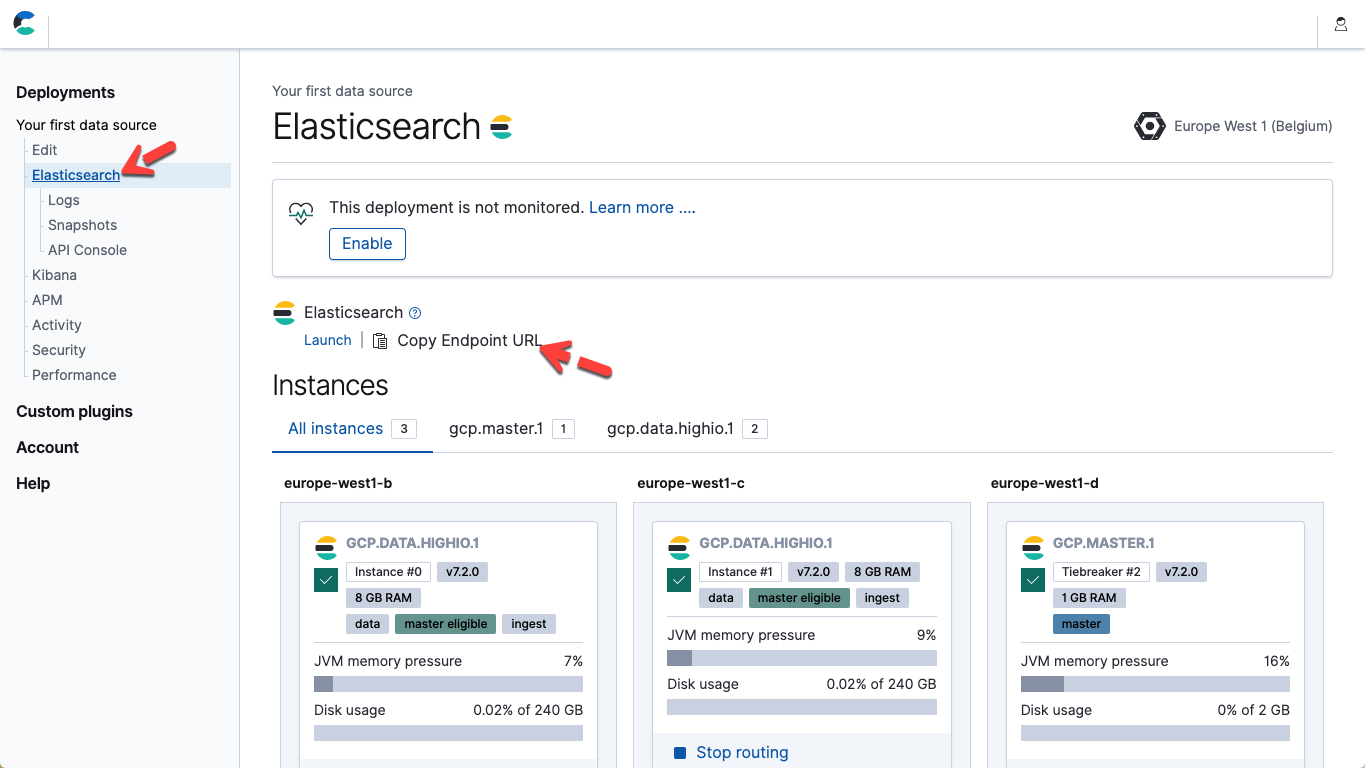
- Within the above file, modify parameters hosts and password to match your Elasticsearch Service endpoint and your password for the elastic user. In Elastic Cloud, you can obtain the Elasticsearch endpoint URL from the details of your deployment page (Copy Endpoint URL).
- Execute the pipeline by starting Logstash: ./bin/logstash -f ~/elastic-rss.conf
Starting up Logstash will take several seconds. You will start to see dots (.....) being printed to the console. Each dot represents one document that has been ingested into Elasticsearch.
- Open up Kibana. Within the Kibana Dev Tools Console, execute the following to confirm that 20 documents have been ingested:POST elastic_blog/_search
Language clients
In some situations, it is preferable to integrate data ingestion with your custom application code. For this, we recommend using one of the officially supported Elasticsearch clients. These clients are libraries that abstract away low-level details of the data ingestion and allow you to focus on the real work that is specific to your application. Official clients exist for Java, JavaScript, Go, .NET, PHP, Perl, Python, and Ruby. Please refer to the documentation for your language of choice for all details and code examples.If your application is written in a language not listed above, chances are there’s a community contributed client.Kibana Dev Tools
Our recommended tool of choice for developing and debugging Elasticsearch requests is the Kibana Dev Tools Console. Dev Tools exposes the full power and flexibility of the generic Elasticsearch REST API while abstracting away technicalities of the underlying HTTP requests. Unsurprisingly, you can use Dev Tools Console to PUT raw JSON documents into Elasticsearch:PUT my_first_index/_doc/1
{
"title" : "How to Ingest Into Elasticsearch Service",
"date" : "2019-08-15T14:12:12",
"description" : "This is an overview article about the various ways to ingest into Elasticsearch Service"
}
Misc REST clients
With Elasticsearch providing a generic REST interface, it is really up to you to find your favorite REST client to communicate with Elasticsearch and ingest documents. While we recommend first exploring the tools mentioned above, there are many reasons why you might consider alternatives. For example, curl is a tool that is quite often used as a last resort, be it for development, debugging, or for integration with custom scripts.Conclusions
There are numerous ways to ingest data into Elasticsearch Service. No two scenarios are the same; the choice of specific methods or tools to ingest data depends on your specific use case, requirements, and environment. Beats provide a convenient and lightweight out-of-the-box solution to collect and ingest data from many different sources. Packaged with the Beats are modules that provide the configuration for data acquisition, parsing, indexing, and visualization for many common databases, operating systems, container environments, web servers, caches, and so on. These modules provide a five-minute data-to-dashboard experience.Because Beats are lightweight, they are ideal for resource-constrained embedded devices, such as IoT devices or firewalls. Logstash, on the other hand, is a flexible tool to read, transform, and ingest data, providing a multitude of filters, inputs, and outputs. If the functionality of Beats isn’t sufficient for certain use cases, a common architectural pattern is to use Beats to collect data and to then pass it through Logstash for further processing before ingestion into Elasticsearch. We recommend using officially supported client libraries when ingesting data directly from your application. Kibana Dev Tools Console is the perfect fit for development and debugging. Lastly, the Elasticsearch REST API provides you with the flexibility to use your favorite REST client.
Learn how to ingest data into Elasticsearch with LogstashReady to dive in even further? We recommend reading the following related articles: