A Practical Introduction to Logstash
The Elastic Stack tries to make it as easy as possible to ingest data into Elasticsearch. Filebeat is a great tool for tailing files and comes with a set of modules which makes it possible to ingest a wide range of common log formats with minimal configuration. If the data you are looking to ingest is not covered by these modules, Logstash and Elasticsearch ingest nodes provide a flexible and powerful way to parse and process most types of text-based data.
In this blog post we will provide a short introduction to Logstash and show how to work with it when developing a configuration for parsing some sample Squid cache access logs and getting these ingested into Elasticsearch.
A brief overview of Logstash
Logstash is a plugin-based data collection and processing engine. It comes with a wide range of plugins that makes it possible to easily configre it to collect, process and forward data in many different architectures.
Processing is organized into one or more pipelines. In each pipeline, one or more input plugins receive or collect data that is then placed on an internal queue. This is by default small and held in memory, but can be configured to be larger and persisted on disk in order to improve reliability and resiliency.
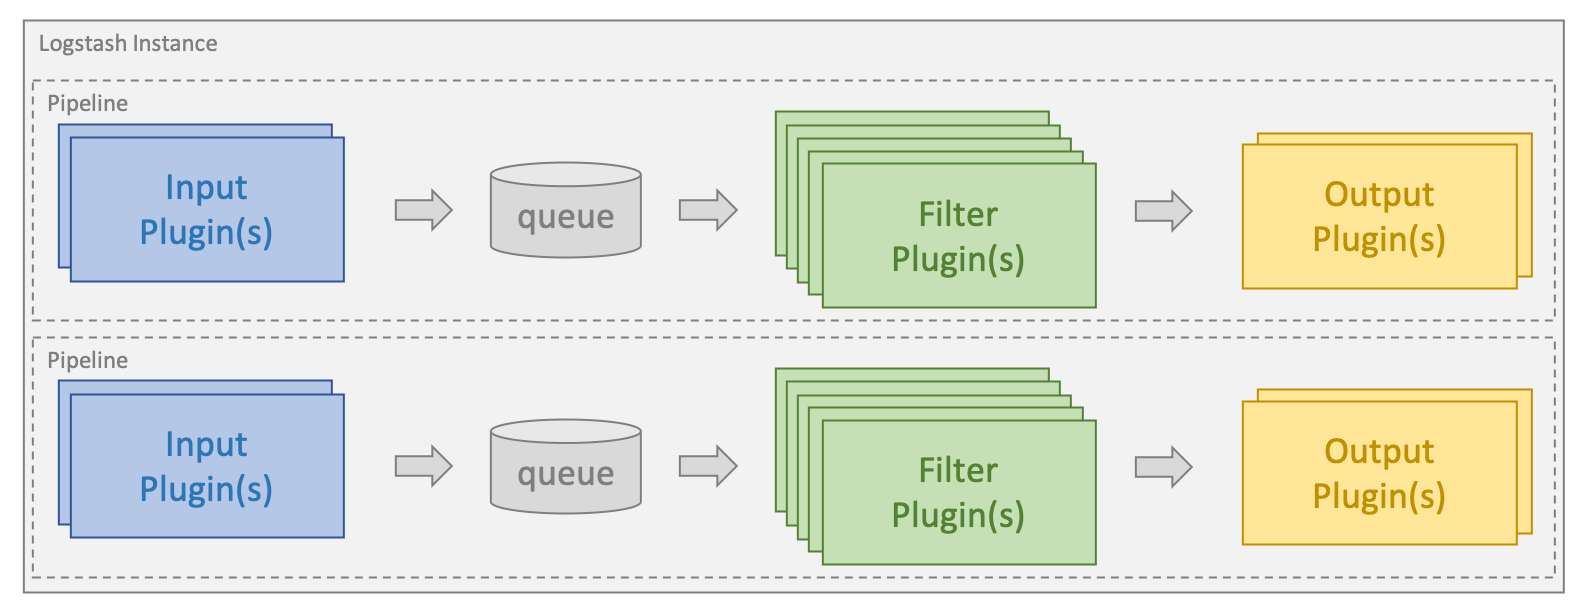
Processing threads read data from the queue in micro-batches and process these through any configured filter plugins in sequence. Logstash out-of-the-box comes with a large number of plugins targeting specific types of processing, and this is how data is parsed, processed and enriched.
Once the data has been processed, the processing threads send the data to the appropriate output plugins, which are responsible for formatting and sending data onwards, e.g. to Elasticsearch.
Input and output plugins can also have a codec plugin configured. This allows parsing and/or formatting of data before it is put onto the internal queue or sent to an output plugin.
Installing Logstash and Elasticsearch
In order to run the examples in this blog post, you will first need to install Logstash and Elasticsearch. Follow the links for instructions on how to do this for your operating system. We will be using version 6.2.4 of the Elastic Stack.
Specifying Pipelines
Logstash pipelines are created based on one or more configuration files. Before we get started, we will quickly walk you through the different options available. The directories described in this section can vary based on installation mode and operating system, and are defined in the documentation.
Single pipeline using a single configuration file
The easiest way to start Logstash, and the way we will use throughout this blog post, is to have Logstash create a single pipeline based on a single configuration file that we specify through the -f command line parameter.
Single pipeline using multiple configuration files
Logstash can also be configured to use all files in a specific directory as configuration files. This can be set either through the logstash.yml file or by passing a directory path through the command line using the -f command line parameter. This is the default if you install Logstash as a service.
When a directory is given, all files in that directory will be concatenated in lexicographical order and then parsed as a single config file. Data from all inputs will therefore be processed by all filters and sent to all outputs unless you control the flow using conditionals.
Using multiple pipelines
In order to use multiple pipelines within Logstash, you will need to edit the pipelines.yml files that comes with Logstash. This can be found in the settings directory and contains configurations files and configuration parameters for all pipelines supported by that Logstash instance.
Using multiple pipelines allows you to separate different logical flows, which can greatly reduce the complexity and amount of conditionals used. This makes configuration easier to tune and maintain. As the data flowing through a pipeline at the same time gets more homogenous, it can also lead to great performance gains as output plugins can be used more efficiently.
Creating a first configuration
Any Logstash configuration must contain at least one input plugin and one output plugin. Filters are optional. As a first example of what a simple configuration file can look like we will start with one that reads a set of test data from a file and outputs this to the console in a structured form. This is a configuration that is very useful when developing a configuration, as it allows you to quickly iterate and build the configuration. We will throughout this blog post assume our configuration file is called test.conf and that it is stored in the “/home/logstash” directory together with the file containing our test data:
input {
 file {
   path => ["/home/logstash/testdata.log"]
   sincedb_path => "/dev/null"
   start_position => "beginning"
  }
}
filter {
}
output {
  stdout {
    codec => rubydebug
  }
}
Here we see the three top level groupings that are part of every Logstash configuration: input, filter, and output. In the input section we have specified a file input plugin, and have provided the path of our test data file through the path directive. We set the start_position directive to “beginning” to instruct the plugin to read the file from the start whenever a new file is discovered.
In order to keep track of which data within each input file that have been processed, the Logstash file input plugin uses a file called sincedb to record the current position. As our configuration is used for development, we want the file to be reread repeatedly, and we therefore want to disable the use of the sincedb file. We do this by setting the sincedb_path directive to “/dev/null” on Linux-based systems. On Windows this would instead be set to “nul”.
Although the Logstash file input plugin is a great way to get started developing configurations, Filebeat is the recommended product for log collection and shipment off host servers. Filebeat can output logs to Logstash, and Logstash can receive and process these logs with the Beats input. The parsing logic outlined in this blog post is still applicable in either scenario, but Filebeat is more optimized for performance and requires lower resource usage which is ideal for running as an agent.
The stdout output plugin will write the data to the console and the rubydebug codec helps show the structure, which simplifies debugging during configuration development.
Starting up Logstash
To verify that Logstash and our configuration file works, we create a file named “testdata.log” in the “/home/logstash” directory. This contains the string “Hello Logstash!” followed by a newline.
Assuming we have the logstash binary in our path, we can start Logstash using the following command:
logstash -r -f "/home/logstash/test.conf"
In addition to the -f command line parameter we discussed earlier, we also used the -r flag. This tells Logstash to automatically reload the config whenever it identifies that the configuration has changed. This is very useful, especially during development. As we disabled the sincedb file, the input file will be reread every time the configuration is reloaded, which allows us to quickly test the config as we continue to develop it.
The output to the console from Logstash shows some logs related to it starting up. After that the file will be processed and you will see something like this:
{
 "message" => "Hello Logstash!",
 "@version" => "1",
 "path" => "/home/logstash/testdata.log",
 "@timestamp" => 2018-04-24T12:40:09.105Z,
 "host" => "localhost"
}
This is the event that Logstash has processed. You can see that the data is stored in the message field and that Logstash has added some metadata for the event in the form of the timestamp it was processed and where it originated.
This is all very good and proves that the mechanics are working. We will now add some more realistic test data and show how this can be parsed.
How do I parse my logs?
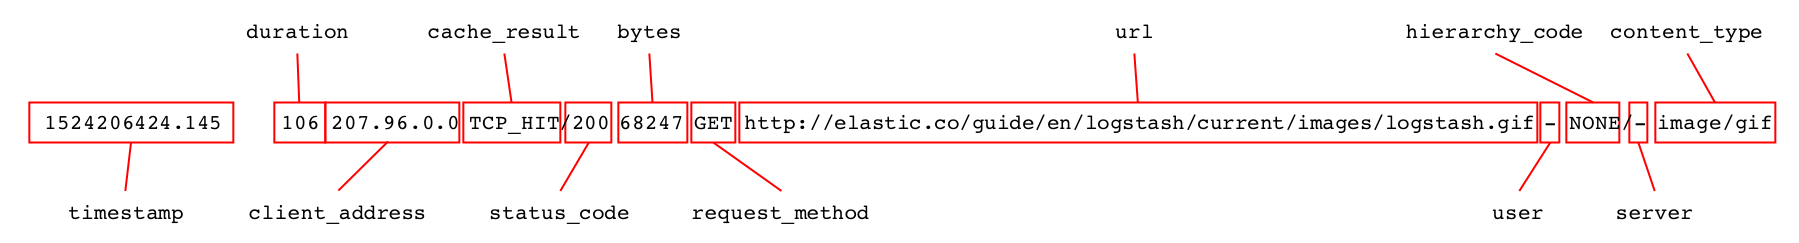
Sometimes there is a perfect filter that can be used to parse your data, e.g. the json filter in case your logs are in JSON format. A lot of the time we do however need to parse logs in different types of text formats. The example we will use in this blog post are a few lines of Squid cache access logs that looks as follows:
1524206424.034   19395 207.96.0.0 TCP_MISS/304 15363 GET http://elastic.co/android-chrome-192x192.gif - DIRECT/10.0.5.120 -
1524206424.145     106 207.96.0.0 TCP_HIT/200 68247 GET http://elastic.co/guide/en/logstash/current/images/logstash.gif - NONE/- image/gif
Each line contains information about one request to the Squid cache and can be broken down into a number of distinct fields that we need to parse.
When parsing text logs, there are especially two filters that are commonly used: dissect parses logs based on delimiters, while grok works based on regular expression matching.
The dissect filter works very well when the structure of the data is well defined and can be very fast and efficient. It is also often easier to get started with, especially for users lacking familiarity with regular expressions.
Grok is generally more powerful, and can handle a greater variety of data. The regular expression matching can however use more resources and be slower, especially if not optimized correctly.
Before we go ahead with the parsing, we replace the content of the testdata.log file with these two log lines and make sure each line is followed by a newline.
Parsing logs with dissect
When working with the dissect filter, you specify a sequence of fields to extract as well as the delimiters between these fields. The filter performs a single pass over the data and matches up the delimiters in the pattern. At the same time data between the delimiters are assigned to the specified fields. The filter does not validate the format of the data being extracted.
The separators used when parsing this data using the dissect filter are highlighted in pink below.

The first field contains the timestamp and is followed by one or more spaces, depending on the length of the following duration field. We can specify the timestamp field as %{timestamp}, but in order to make it accept a variable number of spaces as separator, we need to add a -> suffix to the field. All other separators in the log entry consists of just a single character. We can therefore start building out the pattern, resulting in the following filter section:
{
  "@version" => "1",
  "message" => "1524206424.034   19395 207.96.0.0 TCP_MISS/304 15363 GET http://elastic.co/android-chrome-192x192.gif - DIRECT/10.0.5.120 -",
  "@timestamp" => 2018-04-24T12:42:23.003Z,
  "path" => "/home/logstash/testdata.log",
  "host" => "localhost",
  "duration" => "19395",
  "timestamp" => "1524206424.034",
  "rest" => "TCP_MISS/304 15363 GET http://elastic.co/android-chrome-192x192.gif - DIRECT/10.0.5.120 -",
  "client_ip" => "207.96.0.0"
}
We can now continue building out the pattern step by step. Once we have successfully parsed out all fields, we can remove the message field so we do not hold the same data twice. We can do this using the remove_field directive, which only runs if the parsing was successful, resulting in the following filter block.
filter {
 dissect {
   mapping => {
     "message" => "%{timestamp->} %{duration} %{client_address} %{cache_result}/%{status_code} %{bytes} %{request_method} %{url} %{user} %{hierarchy_code}/%{server} %{content_type}"
    }
   remove_field => ["message"]
  }
}
When run against the sample data, the first record looks as follows:
{
 "user" => "-",
 "content_type" => "-",
 "host" => "localhost",
 "cache_result" => "TCP_MISS",
 "@timestamp" => 2018-04-24T12:43:07.406Z,
 "duration" => "19395",
 "request_method" => "GET",
 "url" => "http://elastic.co/android-chrome-192x192.gif",
 "timestamp" => "1524206424.034",
 "status_code" => "304",
 "server" => "10.0.5.120",
 "@version" => "1",
 "client_address" => "207.96.0.0",
 "bytes" => "15363",
 "path" => "/home/logstash/testdata.log",
 "hierarchy_code" => "DIRECT"
}
The documentation contains some good examples, and this blog post provides a good discussion around the design and purpose of the filter.
That was quite easy, wasn’t it? We are going to process this a bit further later on, but first let’s see how we can do the same thing with grok.
How do I best work with grok?
Grok uses regular expression patterns to match both fields and delimiters. The figure below shows the fields to be captured in blue and the delimiters in red.

Grok will start matching the configured patterns from the start and continue until the full event has been mapped or it has determined that a match can not be found. Depending on which types of patterns used, this may require grok to process parts of the data multiple times.
Grok comes with a wide range of ready-made patterns. Some of the more generic ones can be found here, but this repository also contains a large number of quite specialized patterns for common data types. There is actually one for parsing Squid access logs, but rather than simply using this directly, we will in this tutorial instead show how to go about constructing it from scratch. It does however show that it can be worthwhile checking in this repository if any suitable pattern already exists, before embarking on creating a custom pattern.
When creating a grok config, there are a number of standard patterns that are commonly used:
- WORD - pattern matching a single word
- NUMBER - pattern matching a positive or negative integer or floating-point number
- POSINT - pattern matching a positive integer
- IP - pattern matching an IPv4 or IPv6 IP address
- NOTSPACE - pattern matching anything that is not a space
- SPACE - pattern matching any number of consecutive spaces
- DATA - pattern matching a limited amount of any kind of data
- GREEDYDATA - pattern matching all remaining data
These are the patterns that we will use when building out our grok filter configuration. The way to create grok configurations is generally to start from the left and gradually build out the pattern, which capturing the rest of the data using a GREEDYDATA pattern. We can start out using the following pattern and filter block:
filter {
  grok {
    match => {
      "message" => "%{NUMBER:timestamp}%{SPACE}%{GREEDYDATA:rest}"
    }
  }
}
This pattern instructs grok to look for a number at the start of the string and store this in a field named timestamp. After that it matches a number of spaces before storing the rest of the data in a field named rest. When we switch the dissect filter block for this one, the first record comes out as follows:
 {
  "timestamp" => "1524206424.034",
  "rest" => "19395 207.96.0.0 TCP_MISS/304 15363 GET http://elastic.co/android-chrome-192x192.gif - DIRECT/10.0.5.120 -",
  "path" => "/home/logstash/testdata.log",
  "message" => "1524206424.034   19395 207.96.0.0 TCP_MISS/304 15363 GET http://elastic.co/android-chrome-192x192.gif - DIRECT/10.0.5.120 -",
  "@timestamp" => 2018-04-24T12:45:11.026Z,
  "@version" => "1",
  "host" => "localhost"
}
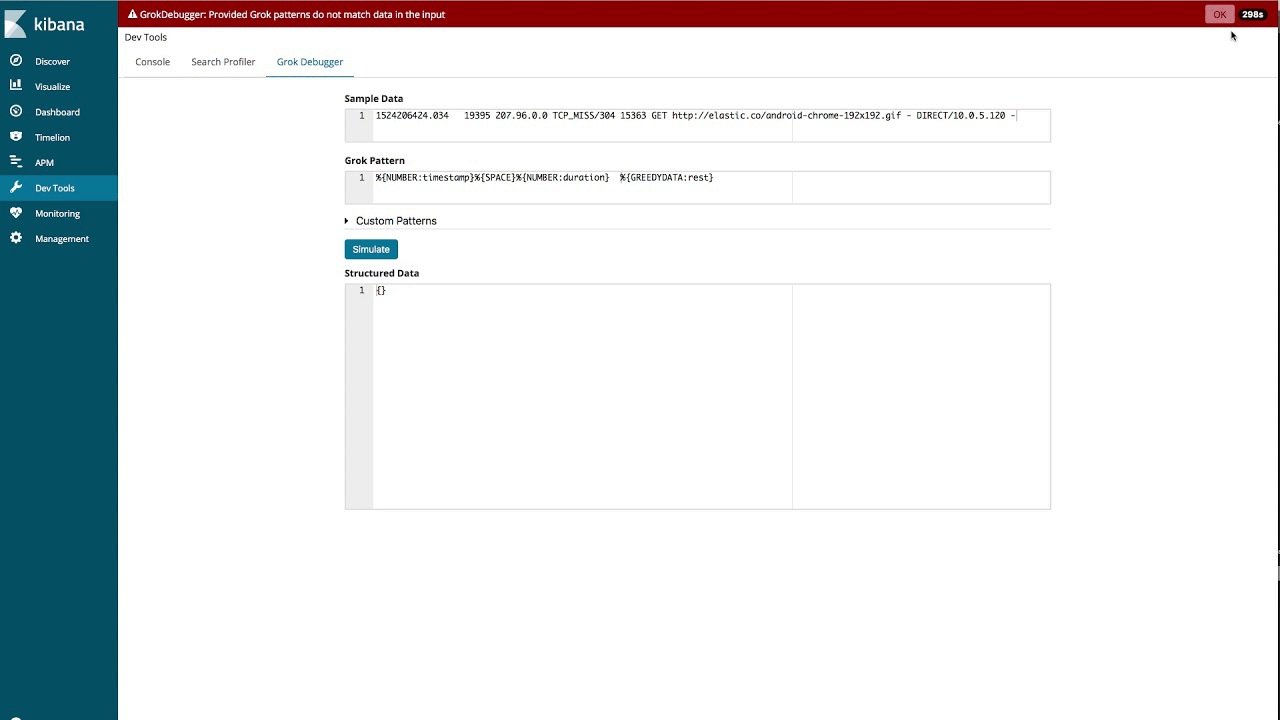
Using the grok debugger
Although we can develop the full pattern this way, there is a tool in Kibana that can help simplify grok pattern creation: the Grok Debugger. In the video below, we show how we can use this to build out the patterns for the example logs used in this blog post.
Once the configuration has been built out, we can drop the message field once the parsing has succeeded, which will make the filter block look like this:
filter {
 grok {
   match => {
     "message" => "%{NUMBER:timestamp}%{SPACE}%{NUMBER:duration}\s%{IP:client_address}\s%{WORD:cache_result}/%{POSINT:status_code}\s%{NUMBER:bytes}\s%{WORD:request_method}\s%{NOTSPACE:url}\s%{NOTSPACE:user}\s%{WORD:hierarchy_code}/%{NOTSPACE:server}\s%{NOTSPACE:content_type}"
    }
   remove_field => ["message"]
  }
}
This is similar to the ready-made pattern, but not identical. When run against the sample data, the first record is parsed the same way as when we used the dissect filter:
 {
  "request_method" => "GET",
  "cache_result" => "TCP_MISS",
  "@timestamp" => 2018-04-24T12:48:15.123Z,
  "timestamp" => "1524206424.034",
  "user" => "-",
  "bytes" => "15363",
  "path" => "/home/logstash/testdata.log",
  "hierarchy_code" => "DIRECT",
  "duration" => "19395",
  "client_address" => "207.96.0.0",
  "@version" => "1",
  "status_code" => "304",
  "url" => "http://elastic.co/android-chrome-192x192.gif",
  "content_type" => "-",
  "host" => "localhost",
  "server" => "10.0.5.120"
}
Tuning grok for performance
Grok is a very powerful and flexible tool for parsing data, but inefficient use of patterns can result in lower performance than expected. We would therefore recommend that you read this blog post about grok performance tuning before you start using grok in earnest.
Ensuring fields are of the right type
As you have seen in the examples above, all fields have been parsed out as string fields. Before we send this off to Elasticsearch in the form of JSON documents, we would like to change the bytes, duration, and status_code fields to integers and timestamp to float.
One way of doing this would be to use a mutate filter and its convert option.
mutate {
 convert => {
   "bytes" => "integer"
   "duration" => "integer"
   "status_code" => "integer"
   "timestamp" => "float"
  }
}
We can also achieve this directly in the dissect and grok filters. In the dissect filter, we would do this through the convert_datatype directive.
filter {
 dissect {
   mapping => {
     "message" => "%{timestamp->} %{duration} %{client_address} %{cache_result}/%{status_code} %{bytes} %{request_method} %{url} %{user} %{hierarchy_code}/%{server} %{content_type}"
    }
   remove_field => ["message"]
   convert_datatype => {
     "bytes" => "int"
     "duration" => "int"
     "status_code" => "int"
     "timestamp" => "float"
    }
  }
}
When using grok, you can specify the type directly after the field name in the pattern.
filter {
 grok {
   match => {
     "message" => "%{NUMBER:timestamp:float}%{SPACE}%{NUMBER:duration:int}\s%{IP:client_address}\s%{WORD:cache_result}/%{POSINT:status_code:int}\s%{NUMBER:bytes:int}\s%{WORD:request_method}\s%{NOTSPACE:url}\s%{NOTSPACE:user}\s%{WORD:hierarchy_code}/%{NOTSPACE:server}\s%{NOTSPACE:content_type}"
    }
   remove_field => ["message"]
  }
}
Using the date filter
The timestamp extracted from the log is in seconds and milliseconds since epoch. We would like to take this and convert it to a standard timestamp format that we can store in the @timestamp field. For this we will use the date filter plugin together with the UNIX pattern, which matches the data we have.
date {
 match => [ "timestamp", "UNIX" ]
}
All standard timestamps stored in Elasticsearch are in UTC timezone. As this also applies to our extracted timestamp, we do not need to specify any timezone. If you had a timestamp in another format, you could specify this format instead of the pre-defined UNIX pattern.
Once we have added this and the type conversions to our configuration, the first event looks like this:
 {
  "duration" => 19395,
  "host" => "localhost",
  "@timestamp" => 2018-04-20T06:40:24.034Z,
  "bytes" => 15363,
  "user" => "-",
  "path" => "/home/logstash/testdata.log",
  "content_type" => "-",
  "@version" => "1",
  "url" => "http://elastic.co/android-chrome-192x192.gif",
  "server" => "10.0.5.120",
  "client_address" => "207.96.0.0",
  "timestamp" => 1524206424.034,
  "status_code" => 304,
  "cache_result" => "TCP_MISS",
  "request_method" => "GET",
  "hierarchy_code" => "DIRECT"
}
It looks like we now have the format we want and are ready to start sending the data to Elasticsearch.
How do I send data to Elasticsearch?
Before we start sending data to Elasticsearch using the elasticsearch output plugin, we need to look at the role of mappings and how these differ from the types you can convert to in Logstash.
Elasticsearch has the ability to automatically detect string and numeric fields, and the selected mapping will be based on the first document it comes across that have a new field. Depending on what the data looks like, this may or may not give the correct mapping, e.g. if we have a field that is usually a float but may be `0` for some records. It is possible that this could be mapped as an integer instead of float depending on which document was processed first.
Elasticsearch also has the ability to automatically detect date fields, as long as they are in a the standard format the date filter produces.
Other types of fields, e.g. geo_point and ip, can not be detected automatically, and have to be explicitly defined through an index template. Index templates can be managed directly in Elasticsearch through an API, but it is also possible to have Logstash ensure the appropriate template is loaded through the elasticsearch output plugin.
For our data we are generally happy with the default mappings. The server field may contain a dash or a valid IP address, so we will not map this as an IP field. One field that requires manual mapping is the client_address field, which we want to be of the type ip. We also have a few string fields that we want to be able to aggregate over, but do not need to perform free-text search on. We will explicitly map these as keyword fields. These fields are: user, path, content_type, cache_result, request_method, server, and hierarchy_code.
We intend to store our data in time-based indices starting with the prefix squid-. We will assume that Elasticsearch is running with default configuration on the same host as Logstash for this example.
We can then create the following template stored in a file called squid_mapping.json:
{
 "index_patterns": ["squid-*"],
 "mappings": {
   "doc": {
     "properties": {
       "client_address": { "type": "ip" },
       "user": { "type": "keyword" },
       "path": { "type": "keyword" },
       "content_type": { "type": "keyword" },
       "cache_result": { "type": "keyword" },
       "request_method": { "type": "keyword" },
       "server": { "type": "keyword" },
       "hierarchy_code": { "type": "keyword" }
      }
    }
  }
}
This template is configured to apply to all indices matching the index pattern squid-*. For the document type doc (default in Elasticsearch 6.x) it specifies the mapping for the client_address field to be ip and the other specified fields to be mapped a keyword.
We could upload this directly to Elasticsearch, but will instead show how to configure the elasticsearch output plugin to handle it. In the output section of our Logstash configuration, we will add a block like this:
elasticsearch {
 hosts => ["localhost:9200"]
 index => "squid-%{+YYYY.MM.dd}"
 manage_template => true
 template => "/home/logstash/squid_mapping.json"
 template_name => "squid_template"
}
If we now run this configuration and index the sample documents into Elasticsearch, we end up with the following when we retrieve the resulting mappings for the index through the get mapping API:
 {
  "squid-2018.04.20" : {
    "mappings" : {
      "doc" : {
        "properties" : {
          "@timestamp" : {
            "type" : "date"
          },
          "@version" : {
            "type" : "text",
            "fields" : {
              "keyword" : {
                "type" : "keyword",
                "ignore_above" : 256
              }
            }
          },
          "bytes" : {
            "type" : "long"
          },
          "cache_result" : {
            "type" : "keyword"
          },
          "client_address" : {
            "type" : "ip"
          },
          "content_type" : {
            "type" : "keyword"
          },
          "duration" : {
            "type" : "long"
          },
          "hierarchy_code" : {
            "type" : "keyword"
          },
          "host" : {
            "type" : "text",
            "fields" : {
              "keyword" : {
                "type" : "keyword",
                "ignore_above" : 256
              }
            }
          },
          "path" : {
            "type" : "keyword"
          },
          "request_method" : {
            "type" : "keyword"
          },
          "server" : {
            "type" : "keyword"
          },
          "status_code" : {
            "type" : "long"
          },
          "timestamp" : {
            "type" : "float"
          },
          "url" : {
            "type" : "text",
            "fields" : {
              "keyword" : {
                "type" : "keyword",
                "ignore_above" : 256
              }
            }
          },
          "user" : {
            "type" : "keyword"
          }
        }
      }
    }
  }
}
We can see that our template has been applied and that the fields we specified are mapped correctly. As the main focus of this blog post is Logstash, we have only scratched the surface of how mappings work. You can read more about this essential topic in the documentation.
Conclusions
In this blog post we have shown how to best work with Logstash while developing a sample, custom configuration and ensure this is written successfully to Elasticsearch. This has however only scratched the surface on what you can achieve with Logstash. Have a look at the documents and blog posts we have linked to throughout this blog post, but also have a look at the official getting started guide and have a look at all the input, output, and filter plugins that are available. Once you have an understanding of what is available, Logstash quickly becomes the Swiss Army knife of data processing.
If you run into problems or have additional questions, you can always reach out to us in the Logstash category in our Discuss forum. If you would like to look at other sample data and logstash confs there are more examples at https://github.com/elastic/examples/ .
Happy parsing!!!