Packetbeat
Lightweight shipper for network data
Monitoring your network traffic is critical to gaining observability and securing your environment — ensuring high levels of performance and security. Packetbeat is a lightweight network packet analyzer that sends data from your hosts and containers to Logstash or Elasticsearch.
Monitor services and applications
Network protocols like HTTP let you keep a pulse on application latency and errors, response times, SLA performance, user access patterns and trends, and more.
Packetbeat enables you to access this data to understand how traffic is flowing through your network. It’s totally passive, has zero latency overhead, and doesn’t interfere with your infrastructure. Explore the live demo.
Pick a protocol. Or build your own.
Packetbeat is also a library. It supports many application layer protocols, from database to key-value stores to HTTP and low-level protocols. Choose the one you need or add your own by submitting a pull request.

Search and analyze network traffic
Skip performing a variety of incantations to get your data into proper shape for search and analysis. Packetbeat takes care of this for you in real time, on your target servers.

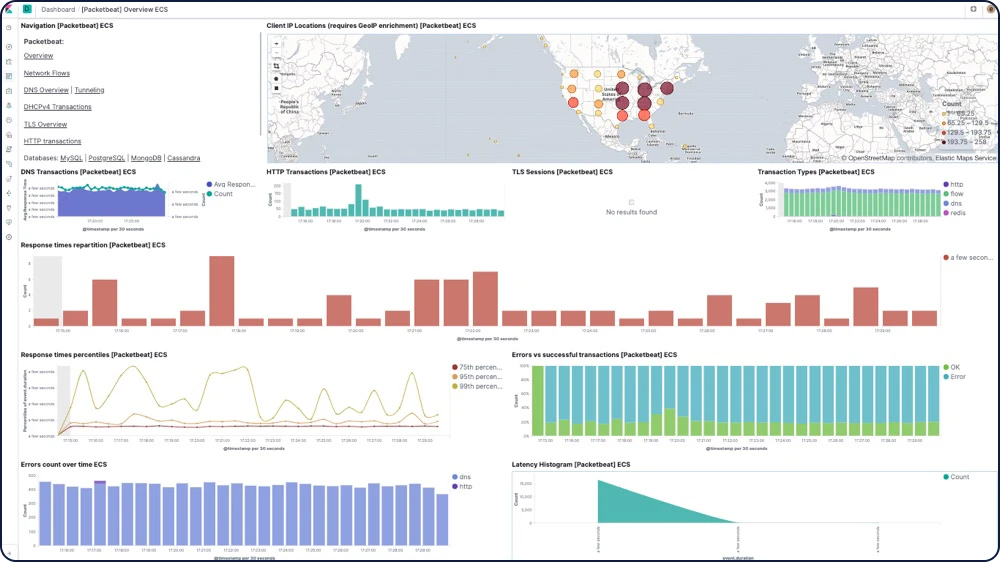
Ship to Elasticsearch or Logstash. Visualize in Kibana.
Packetbeat supports Elastic Common Schema (ECS) and is part of the Elastic Stack — meaning it works seamlessly with Logstash, Elasticsearch, and Kibana. Whether you want to transform or enrich your network data with Logstash, fiddle with some analytics in Elasticsearch, or review data in Kibana on a dashboard or in Elastic Security, Packetbeat makes it easy.
It doesn't miss a beat
Spool your network traffic info to disk so your pipeline doesn’t skip a data point — even when downstream issues occur. Packetbeat retains your network data and then ships it all to Elasticsearch or Logstash when things are back to normal.