Elastic SIEM for home and small business: SIEM overview
Note: The “SIEM for home and small business” blog series contains configurations relevant to the beta release of Elastic SIEM using Elastic Stack 7.4. We recommend using Elastic Stack 7.6 and newer, as Elastic SIEM was made generally available in 7.6. Please also note the Elastic SIEM solution mentioned in this post is now referred to as Elastic Security.
Hello, security enthusiasts! This is part seven (can you believe it?) of the Elastic SIEM for home and small business blog series. If you haven’t read the first six blogs in the series, you may want to before going any further. In the prerequisite blogs we created our Elasticsearch Service deployment (part 1), secured access to our cluster by restricting privileges for users and Beats (part 2), then we created an ingest pipeline for GeoIP data and reviewed our Beats configurations (part 3). In the Beats blogs, we configured data collection from our Windows, CentOS, and macOS systems.
Before we dive in...
Now that we are collecting data from our systems, our hard work is about to pay off as we walk through the Elastic SIEM app!
If you have been following the blog series from the beginning, then you are most likely running Elastic SIEM version 7.4. Even though version 7.5 and version 7.6 have been released, we will finish out this blog series with version 7.4 for version consistency. Now that Elastic SIEM is generally available in 7.6, I highly recommend upgrading your cluster (especially since the GeoIP issue is fixed in 7.6). If you have already upgraded your cluster or are running a newer version, some of the displays in Kibana may look different than what is available in 7.4.
Please keep in mind that while we configured data collection from our Windows, CentOS, and macOS systems, we have not completed collecting data from all of the devices on our network. For better visibility of your environment, you will want to collect data from other devices — especially network data sources (for example a Palo Alto Firewall, a Cisco ASA, or Ubiquiti devices). While we may add some standalone device collection blogs, I recommend taking a look at some of the ways you can collect data from your environment, including Logstash Input Plugins and Filebeat Modules. Remember that you will need to collect ECS-compliant data for it to be displayed in the SIEM app.
Reviewing our data with all systems configured
Since we will not make any administrative cluster changes during our review, we will sign in using the SIEM user account we created in blog 2. After signing in with the SIEM user account (I will be using my rob account), click the SIEM app.
SIEM Overview page
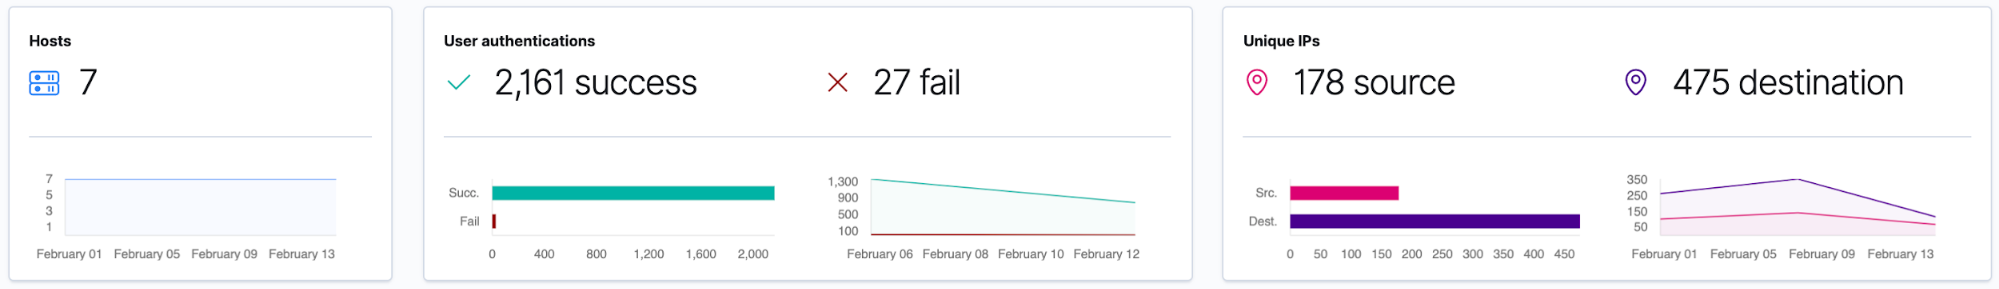
The first page we are taken to in the SIEM app is the Overview page. Here is the data from the last 24 hours from my systems:
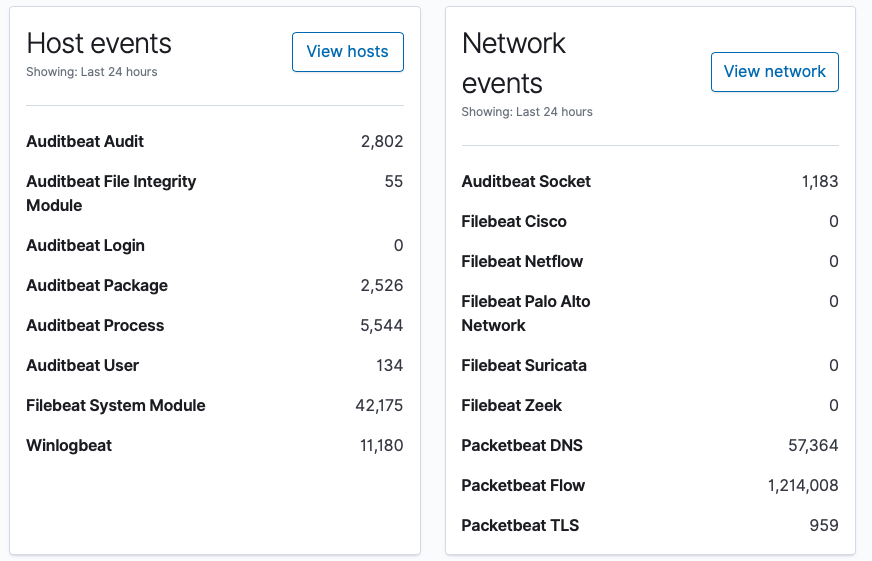
Next we will look at the Hosts and Network pages for more information.
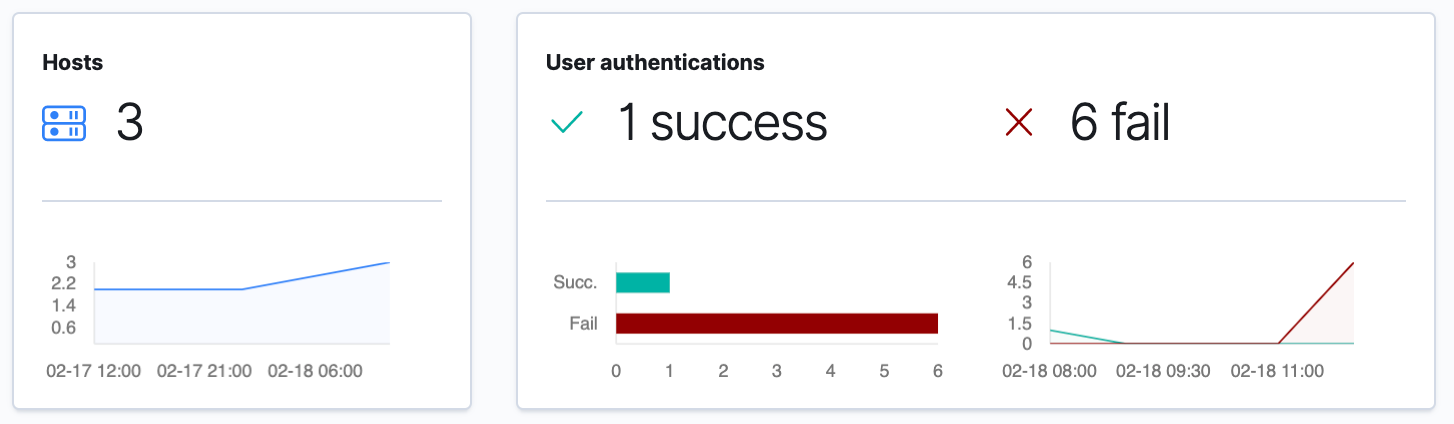
SIEM Hosts page
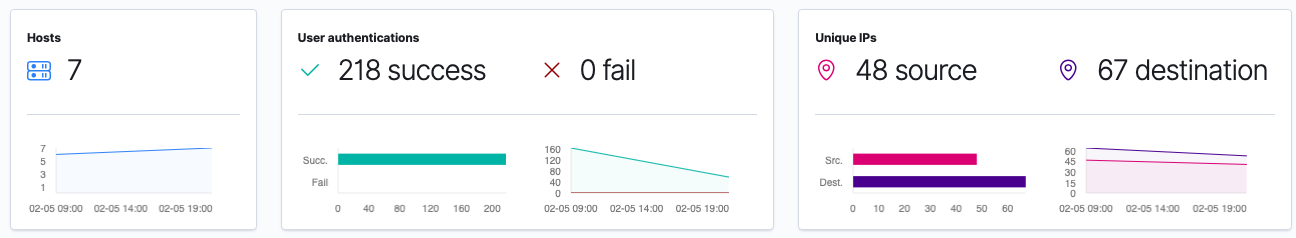
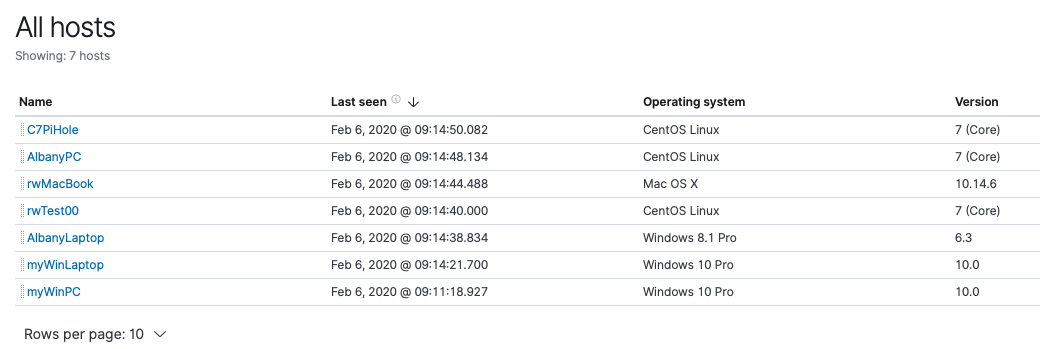
Here I am glad to see there are no authentication failures. I can also see the list of hosts that have reported in, as well as the last time they sent data to my cluster:
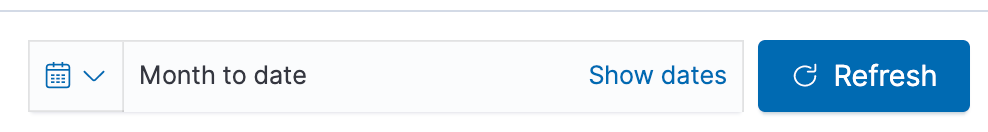
By default, the SIEM app shows us the last 24 hours’ worth of data, but we have more than that in our cluster. I’m going to select Month to date in the time picker to see what data has been collected during this month:
I’m going to set my time selection back to the last 24 hours, since our time selection will be remembered when we move to the Network page. I am also going to try to sign in with the incorrect username and password on a device, to see if I can raise any authentication failures in the SIEM app.
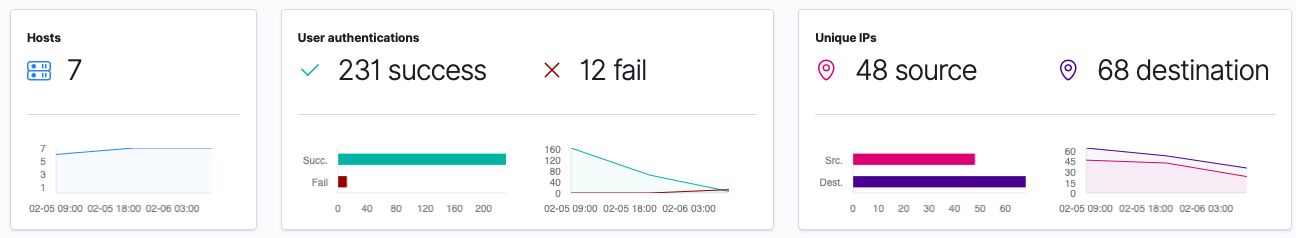
This data was expected, as the authentication failures were generated by me attempting to access one of my systems.
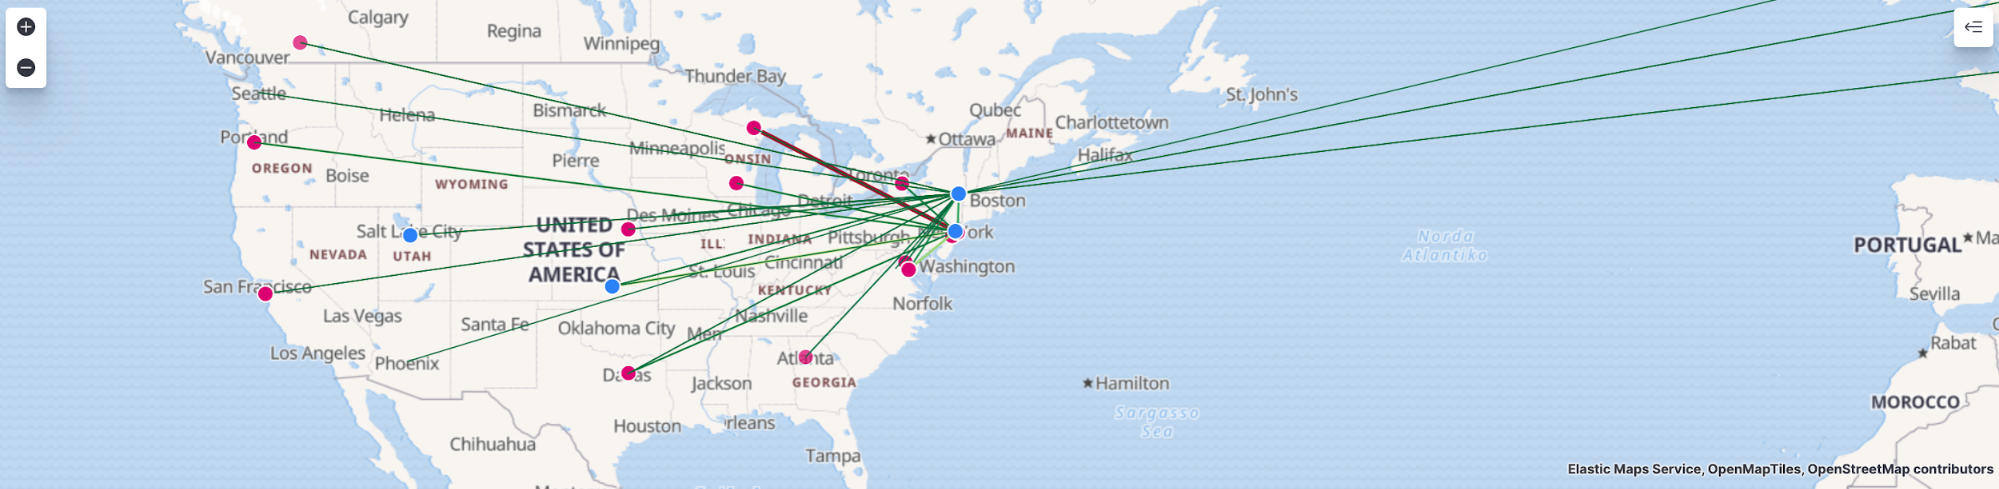
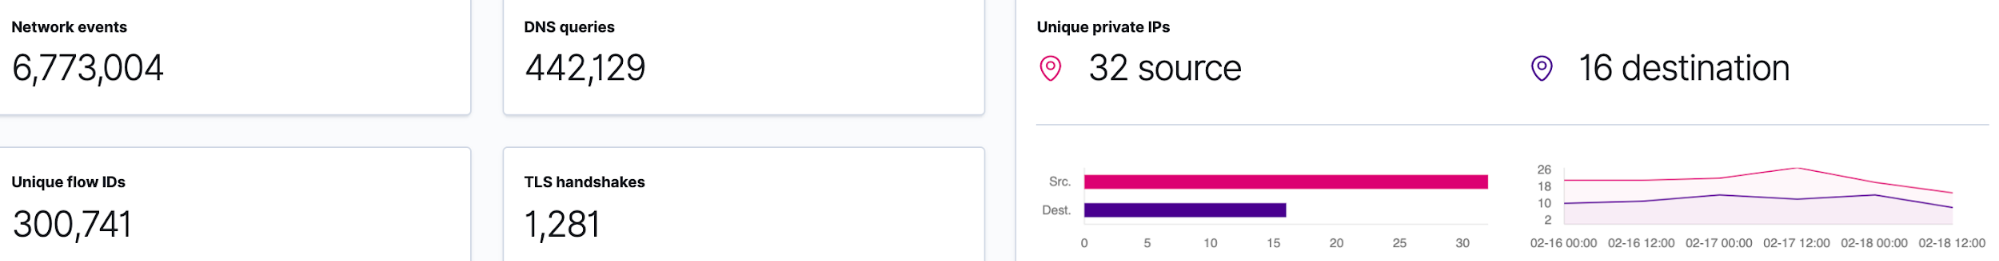
SIEM Network page
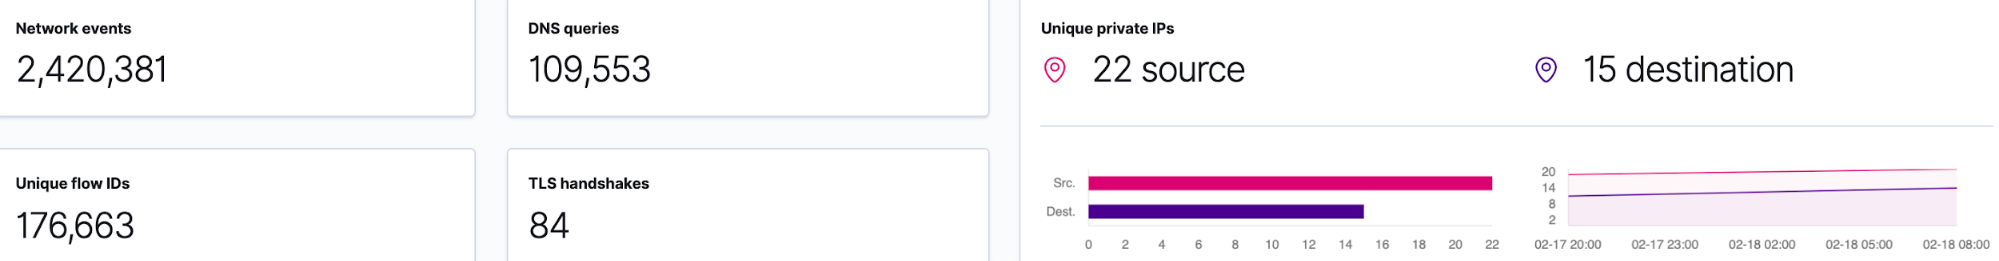
On the SIEM Network page, we are presented with both a map to correlate GeoIP data, as well as an overview of the data collected.
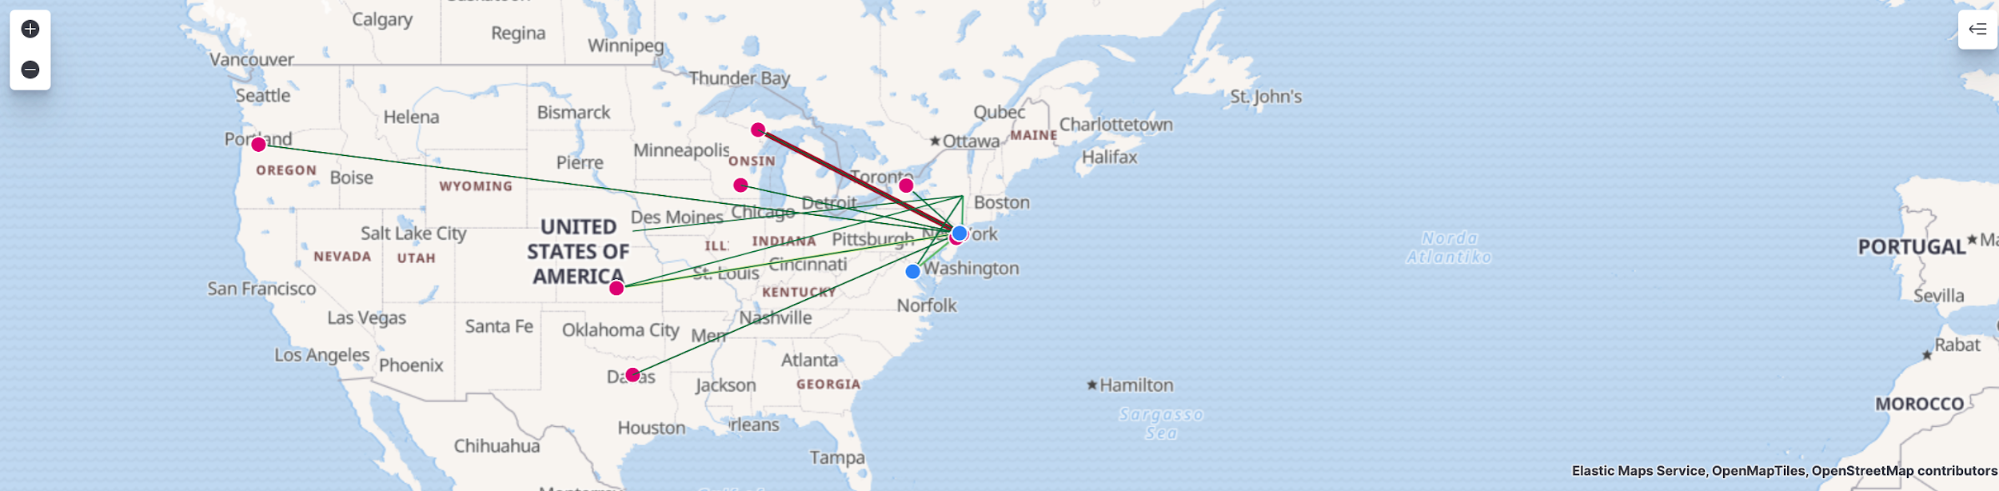
Next, I will select Week to date in the time picker to see what data has been collected during this week:
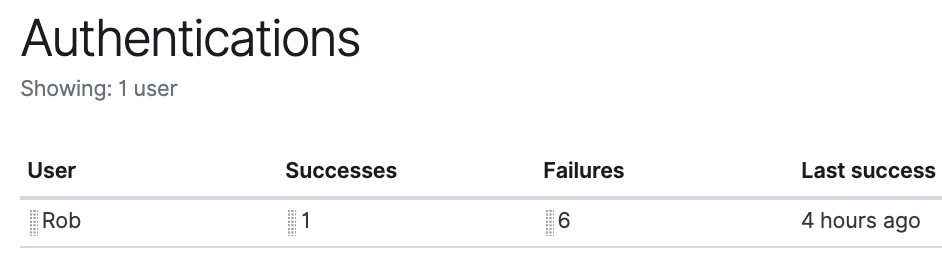
Elastic SIEM Timeline
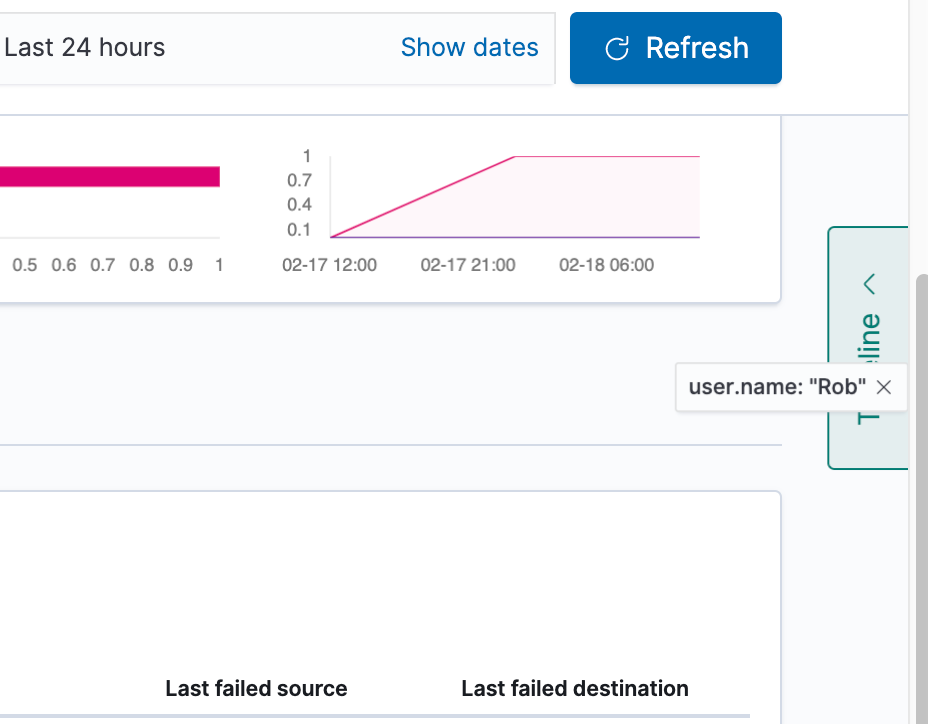
Next, we will dig further into our data via the SIEM Timeline. We will go back to the Hosts page and scroll down to the “Authentications” section. Here I see the user Rob has a few authentication failures. I will filter for this user by entering user.name:”Rob” in the filter:

Next, we will click and drag the user Rob over to the Timeline box on the right-hand side:
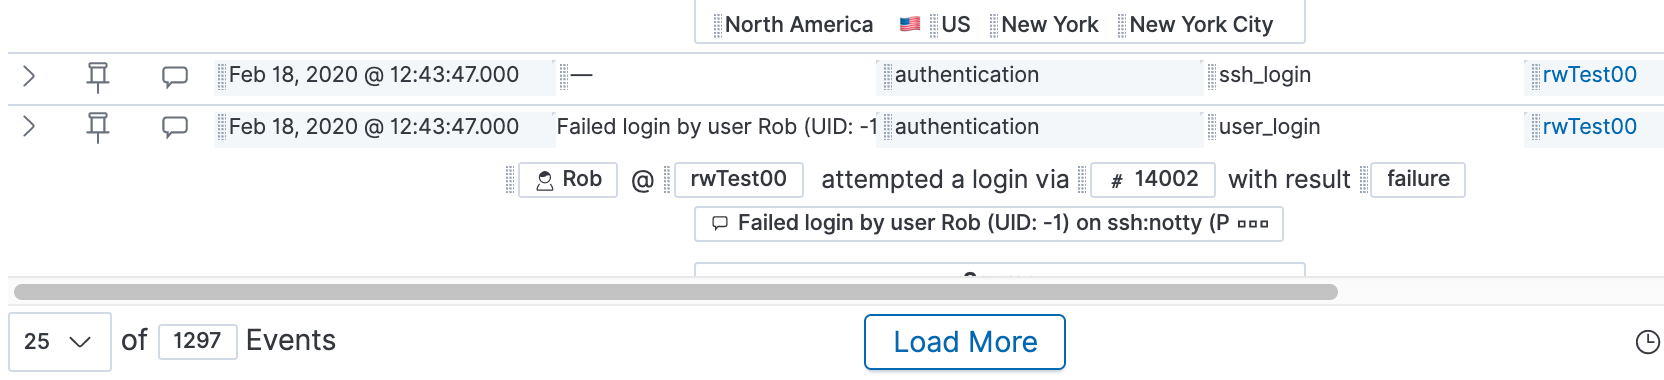
Let’s drop this into the “Timeline” box and see what information is available. It looks like we have almost 1,300 events from today in this timeline:
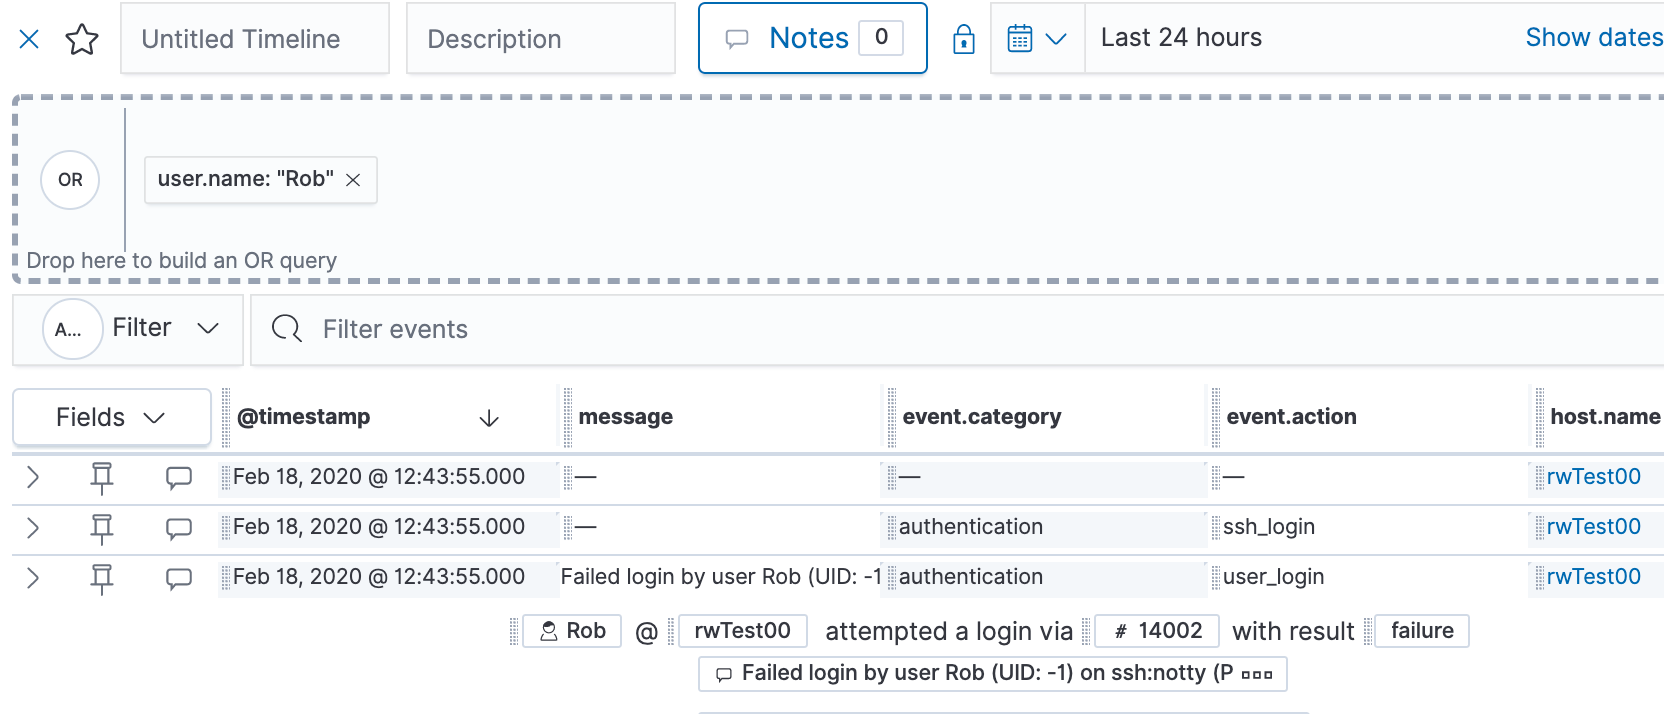
Let’s name this Timeline “Rob Auth's” and give it a description of “Authentication events for the user Rob”. Lastly, we’ll add a note that we’ve added these to the timeline from the events today.
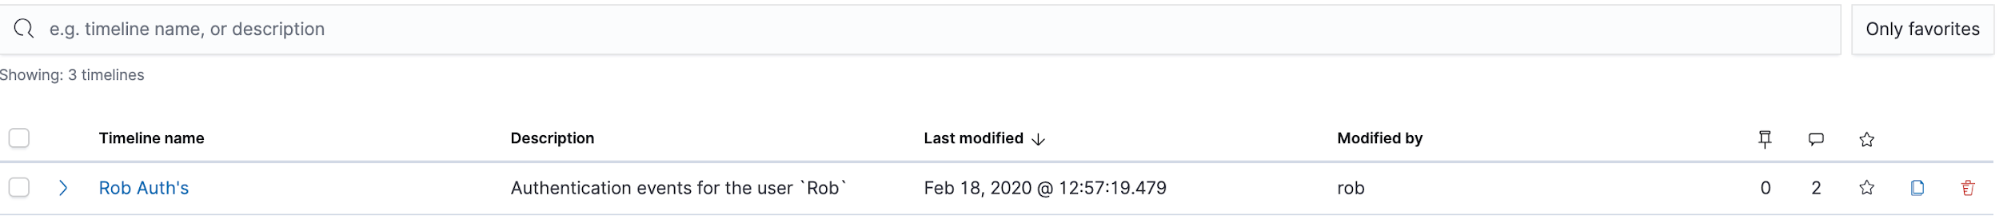
After we add our note, let’s click “Add Note.” Then we can close out of the note and Timeline, then review the “Timelines” page. In the “Timelines” page, we will be able to see any of the timelines we create from our data:
This is just the beginning — so much more has been added in version 7.5 and version 7.6! You can now leverage the power of Elastic SIEM to monitor activity for your home or small business network.
Next steps: Our data in Elastic Maps
I recommend reading through the Elastic SIEM Get up and running guide to see what options are available for collecting data from the remaining devices in your network. In the next blog, we will review our data in Elastic Maps. We’ll then finish up the series by reviewing ways to maintain our Elasticsearch Service deployment.
Follow along with this Elastic SIEM for home and small business blog series as we develop a powerful, yet simple, security solution at home (or for your small business). Remember that once we install and configure Beats on our systems, we can go to the SIEM app to see what data is available.
- Part 1: Getting started
- Part 2: Securing cluster access
- Part 3: GeoIP data and Beats config
- Part 4: Beats on Windows
- Part 5: Beats on CentOS
- Part 6: Beats on macOS
- Part 7: SIEM overview
A few last things...
If you run into any issues, the first place we’d recommend turning is to our documentation. It can help with many common issues. If you still have outstanding questions, check out our Elastic forums for additional help. Or, if you want to talk to the Elastic Support team directly, you have direct access to a team of experts if you’ve deployed on Elasticsearch Service. If you are self-hosting, you can start an Elastic subscription today and have direct access to our support team. Be safe out there!