Elastic SIEM for home and small business: Beats on Windows
Note: The “SIEM for home and small business” blog series contains configurations relevant to the beta release of Elastic SIEM using Elastic Stack 7.4. We recommend using Elastic Stack 7.6 and newer, as Elastic SIEM was made generally available in 7.6. Please also note the Elastic SIEM solution mentioned in this post is now referred to as Elastic Security.
Hey, there. This is part four of the Elastic SIEM for home and small business blog series. If you haven’t read the first, second, and third blogs, you may want to before going any further. In the Getting started blog, we created our Elasticsearch Service deployment and started collecting data from one of our computers using Winlogbeat. In the Securing cluster access blog, we secured access to our cluster by restricting privileges for users and Beats. In the GeoIP data and Beats config blog, we created an ingest pipeline for GeoIP data and reviewed our Beats configurations.
Identifying our data collection needs on Windows
In the first blog, we determined that we need to use Auditbeat, Filebeat, Packetbeat, and Winlogbeat to collect log files, activities of users and processes, and network data. We do not need to install all of those Beats applications on our Windows devices, only the Beats we need to collect data relevant to us. In this blog, we will install and configure Winlogbeat, Packetbeat, and (optionally) Auditbeat on a Windows 10 computer.
Even though we started with the default configuration of Windows events using Winlogbeat, we will have a more thorough review of the data we can collect using Beats on Windows 10. We will revisit the first device we configured in the first blog but also go through the entire installation process to cover a few more capabilities.
For data collection from our Windows systems, we will focus on log files, network data, and activities of users and processes. We will use Winlogbeat to collect the event logs, optionally Packetbeat to collect client-specific network data, and optionally Auditbeat for file-integrity data and system data. When we configure Winlogbeat we will also install Sysinternals System Monitor (Sysmon), and when we configure Packetbeat we will also install Npcap.
In order to get started we need to download the necessary software (applicable to your system type: Winlogbeat, Sysmon, Packetbeat, Npcap, and Auditbeat), administrative access to our Windows system, and a copy of our Beats common configuration settings. After we download the software, we will extract the files to C:\Program Files\Elastic\ where each Beat will go into their own respective folder (for example Winlogbeat will be extracted to C:\Program Files\Elastic\winlogbeat-7.4.0\) and the third-party applications will go into a separate thirdparty folder (for example Sysmon will be extracted to C:\Program Files\Elastic\thirdparty\sysmon). For each Beat, I am including the version number in the folder name for my own version control.
Determining which Windows event log sources to collect
Using Get-EventLog with PowerShell
The reason we will use Winlogbeat is so we can collect Windows events, but how do we decide which log sources should be configured? We can find more in the event_logs.name section of the Winlogbeat guide. For a simple list we can use the Get-EventLog PowerShell module. Otherwise we can use the Get-WinEvent PowerShell module to tell us which log sources are available and which log sources have data.
Since this blog is not about PowerShell, I will show you the commands I ran to give me the list of log sources. In an Administrative PowerShell session we will issue the Get-EventLog -List command to show us a basic list of event logs available on our Windows 10 system:
PS C:\Windows\system32> Get-EventLog -List
  Max(K) Retain OverflowAction        Entries Log
  ------   ------ --------------       ------- ---
     512      7 OverwriteOlder             751 ACEEventLog
  20,480      0 OverwriteAsNeeded        2,471 Application
  20,480      0 OverwriteAsNeeded            0 HardwareEvents
     512      7 OverwriteOlder               0 Internet Explorer
     512      7 OverwriteOlder           2,772 isaAgentLog
  20,480      0 OverwriteAsNeeded            0 Key Management Service
     128      0 OverwriteAsNeeded            0 OAlerts
  20,480      0 OverwriteAsNeeded       35,347 Security
  20,480      0 OverwriteAsNeeded        9,009 System
  15,360      0 OverwriteAsNeeded          288 Windows PowerShell
PS C:\Windows\system32>
Based on this output, we know we should collect from the Security, System, and Application event logs. This output from issuing Get-EventLog -List tells us there are 2,471 Application events, 35,347 Security events, 9,009 System events, 288 Windows PowerShell events, 751 ACEEventLog events (for my AMD graphics card), and a few other event log sources.
Next we will determine the amount of log sources available from the Get-EventLog module and compare it with the amount of log sources available from the Get-WinEvent module:
PS C:\Windows\system32> $GetEventLogSources=Get-EventLog -List
PS C:\Windows\system32> $GetEventLogSources.count
10
PS C:\Windows\system32> $GetWinEventSources=Get-WinEvent -ListLog *
PS C:\Windows\system32> $GetWinEventSources.count
423
PS C:\Windows\system32>
Based on this output, we see that there are 10 log sources available from the Get-EventLog module, but there are 423 log sources available from the Get-WinEvent module. We should find out how many log sources have data.
Using Get-WinEvent with PowerShell
PS C:\Windows\system32> $GetWinEventSources=Get-EventLog -List
PS C:\Windows\system32> $GetWinEventSources.count
423
PS C:\Windows\system32> $populatedSources=$GetWinEventSources | Where-Object {$_.RecordCount -gt 0}
PS C:\Windows\system32> $populatedSources.count
126
In this blog we are going to collect the following event logs: Application, System, Security, Windows PowerShell, Microsoft-Windows-PowerShell/Operational, and Microsoft-Windows-Sysmon/Operational. We will configure Winlogbeat to collect data from these log sources.
If you want to look at the entire list of populated event sources, you can issue $populatedSources in your PowerShell console. In the example below, we will export the list of populated sources to a file called populatedSources.txt so we can reference this later. Even though there are 126 log sources with data, we do not need to collect all of them. You can read through Microsoft’s Event Logging guide if you need more information.
PS C:\Windows\system32> $populatedSources | Format-Table -Property LogName,RecordCount | Out-File c:\Users\myUserPath\Desktop\populatedSources.txt
Using the GeoIP ingest pipeline
Before we start installing and configuring Beats on our Windows system, I want to cover the GeoIP ingest processor issue in more detail. There is a workaround that will allow us to enrich data with GeoIP information, but it depends on many variables. Essentially you will have to enable logging for each respective Beat, then look at the logs to confirm data is being sent to your Elasticsearch Service deployment.
In the GeoIP data and Beats config blog, we created an ingest pipeline for GeoIP data, then we commented out the output.elasticsearch.pipeline: geoip-info setting. The reason I disabled use of the GeoIP ingest processor was to reduce (or prevent) frustration. Quite simply, you can read through (and follow) Elasticsearch GitHub issue 46193 for more detail around why I have currently chosen to disable these settings.
At a high level, the GeoIP ingest processor does not allow an array of IP addresses. This is a problem for systems running both IPv4 and IPv6 as well as systems with multiple network adapters (both physical and virtual). Any time Beats passes an array of IPs to Elasticsearch while using the GeoIP ingest processor a Failed to publish events: temporary bulk send failure error message will be generated.
When netinfo.enabled: true is set on devices with multiple interfaces or addresses, Beats will include IP addresses and MAC addresses as fields host.ip and host.mac. This means the respective Beat will attempt to send an array of values for host.ip which causes the error.
While the example Beats common configurations have netinfo.enabled: false (instead of true) and commented out the output.elasticsearch.pipeline: geoip-info setting; the way to tell Beats to use the GeoIP ingest pipeline is to uncomment the output.elasticsearch.pipeline: geoip-info setting in your Beats configuration file.
If you decide to use the GeoIP ingest pipeline you should also configure logging for each Beat. The reason we need to configure logging is that the Beat will run even though data is not being sent to Elasticsearch. For this blog, we will store our logs in the C:\Program Files\Elastic\logs\ folder, but you will need to look for an Failed to publish events: temporary bulk send failure error message that will look similar to this:
ERROR pipeline/output.go:121 Failed to publish events: temporary bulk send failure
Again, this has to do with passing an array of IPs to Elasticsearch using the GeoIP ingest processor. With that said, feel free to follow Elasticsearch GitHub issue 46193 for updates.
Winlogbeat on Windows
Installing Winlogbeat
Since we’ve downloaded Winlogbeat, it’s a good idea to read through the Winlogbeat installation guide to get started. We’ve extracted the files to C:\Program Files\Elastic\winlogbeat-7.4.0\ (I’ve kept the version number in the folder name for my own version control), have opened an Administrative PowerShell session, and will install the service using the .\install-service-winlogbeat.ps1 command (shown below). After installing Winlogbeat, do not start the service until we finish initial configuration.
PS C:\> cd C:\Program Files\Elastic\winlogbeat-7.4.0\
PS C:\Program Files\Elastic\winlogbeat-7.4.0> .\install-service-winlogbeat.ps1
Security warning
Run only scripts that you trust. While scripts from the internet can be useful,
this script can potentially harm your computer. If you trust this script, use
the Unblock-File cmdlet to allow the script to run without this warning message.
Do you want to run C:\Program Files\Winlogbeat\install-service-winlogbeat.ps1?
[D] Do not run  [R] Run once [S] Suspend  [?] Help (default is “D”): R
Status   Name           DisplayName
------   ----           -----------
Stopped  winlogbeat     winlogbeat
PS C:\Program Files\Elastic\winlogbeat-7.4.0> cd ..
PS C:\Program Files\Elastic>
Error: cannot be loaded because running scripts is disabled on this system
Note: if you receive a .\install-service-winlogbeat.ps1 : File C:\Program Files\Elastic\winlogbeat-7.4.0\install-service-winlogbeat.ps1 cannot be loaded because running scripts is disabled on this system. error, you will need to issue the Unblock-File command against the install-service-winlogbeat.ps1 file, as shown below, before issuing the .\install-service-winlogbeat.ps1 command.
PS C:\Program Files\Elastic\winlogbeat-7.4.0> .\install-service-winlogbeat.ps1
.\install-service-winlogbeat.ps1 : File C:\Program Files\Elastic\winlogbeat-7.4.0\install-service-winlogbeat.ps1
cannot be loaded because running scripts is disabled on this system. For more information, see
about_Execution_Policies at https:/go.microsoft.com/fwlink/?LinkID=135170.
At line:1 char:1
+ .\install-service-winlogbeat.ps1
+ ~~~~~~~~~~~~~~~~~~~~~~~~~~~~~~~~
    + CategoryInfo          : SecurityError: (:) [], PSSecurityException
    + FullyQualifiedErrorId : UnauthorizedAccess
PS C:\Program Files\Elastic\winlogbeat-7.4.0> Unblock-File .\install-service-winlogbeat.ps1
PS C:\Program Files\Elastic\winlogbeat-7.4.0>
Do not start the Winlogbeat service until we finish initial configuration.
Alternatively, you may need to modify the execution policy on your Windows system. For this blog, we will set the execution policy to RemoteSigned for this PowerShell session using the Set-ExecutionPolicy RemoteSigned -Scope Process command and entering Y for Yes:
PS C:\Program Files\Elastic\winlogbeat-7.4.0> Set-ExecutionPolicy RemoteSigned -Scope Process
Execution Policy Change
The execution policy helps protect you from scripts that you do not trust. Changing the execution policy might expose
you to the security risks described in the about_Execution_Policies help topic at
https:/go.microsoft.com/fwlink/?LinkID=135170. Do you want to change the execution policy?
[Y] Yes  [A] Yes to All  [N] No [L] No to All  [S] Suspend [?] Help (default is "N"): Y
PS C:\Program Files\Elastic\winlogbeat-7.4.0>
Remember, do not start the Winlogbeat service until we finish initial configuration.
Sysinternals System Monitor (Sysmon)
Before we continue configuring Winlogbeat, we are going to use the Sysmon module, which requires that we install Sysinternals System Monitor (Sysmon). Note that Sysmon is not bundled with Windows or Winlogbeat and must be installed independently. If you do not want to use the default configurations, you can use a Sysmon configuration file. While we will not cover using a Sysmon configuration file in this blog, a great place to start is with the sysmon-config from SwiftOnSecurity. If you decide to use the sysmon-config from SwiftOnSecurity, make sure you read through all the documentation in the GitHub repo.
Once we have extracted Sysmon to our thirdparty folder (for the blog the path is C:\Program Files\Elastic\thirdparty\sysmon) we can proceed with the installation. In our Administrative PowerShell session we will install Sysmon using the .\Sysmon64.exe -accepteula -i command:
PS C:\Program Files\Elastic> cd .\thirdparty\sysmon\
PS C:\Program Files\Elastic\thirdparty\sysmon> .\Sysmon64.exe -accepteula -i
System Monitor v10.2 - System activity monitor
Copyright (C) 2014-2019 Mark Russinovich and Thomas Garnier
Sysinternals - www.sysinternals.com
Sysmon64 installed.
SysmonDrv installed.
Starting SysmonDrv.
SysmonDrv started.
Starting Sysmon64..
Sysmon64 started.
PS C:\Program Files\Elastic\thirdparty\sysmon> cd ..\..
PS C:\Program Files\Elastic>
Remember, Sysmon will use default settings if you do not specify a configuration file.
Configuring Winlogbeat
After we have installed Winlogbeat and Sysmon on this Windows computer, we need to update our winlogbeat.yml configuration file. Since we have already determined our common Beats configurations, we only need to finalize our Winlogbeat-specific options, which will be stored in the first section of the file. Make sure to read through the winlogbeat.reference.yml page or the winlogbeat.reference.yml file in the C:\Program Files\Elastic\winlogbeat-7.4.0\ folder. For clarity, the Beats common configuration sections will be stored below the Winlogbeat-specific options.
If you plan on using the GeoIP ingest processor, you should configure logging for Winlogbeat. Since we will store our log files in the C:\Program Files\Elastic\logs\ folder, our logging configuration will look like this:
#=== Winlogbeat logging ===
# Initially use `info` for the logging.level, set logging.level to `debug` if you see
# an `Failed to publish events: temporary bulk send failure` error message in the logs
logging.level: info
logging.to_files: true
logging.files:
  path: C:\Program Files\Elastic\logs\
  name: winlogbeat
  keepfiles: 7
  permissions: 0644
We will add the Winlogbeat logging section to our configuration but leave it commented out for now. With that said, here are the Winlogbeat-specific options I have set in winlogbeat.yml:
#=== Winlogbeat specific options ===
winlogbeat.event_logs:
  - name: Application
    ignore_older: 72h
  - name: System
  - name: Security
    ignore_older: 24h
    processors:
      - drop_event.when.and: # drop local service login events
        - equals.event.code: '4672'
        - equals.winlog.event_data.SubjectUserName: 'LOCAL SERVICE'
      - script:
          lang: javascript
          id: security
          file: ${path.home}/module/security/config/winlogbeat-security.js
  - name: Windows PowerShell
    ignore_older: 72h
  - name: Microsoft-Windows-PowerShell/Operational
    ignore_older: 72h
    event_id: 4103, 4104
  - name: Microsoft-Windows-Sysmon/Operational
    ignore_older: 24h
    processors:
      - script:
          lang: javascript
          id: sysmon
          file: ${path.home}/module/sysmon/config/winlogbeat-sysmon.js
#=== Winlogbeat logging ===
# Configure logging for Winlogbeat if you plan on using the GeoIP ingest processor
# Initially use `info` for the logging.level, set logging.level to `debug` if you see
# an `Failed to publish events: temporary bulk send failure` error message in the logs
#logging.level: info
#logging.to_files: true
#logging.files:
#  path: C:\Program Files\Elastic\logs\
#  name: winlogbeat
#  keepfiles: 7
#  permissions: 0644
#=== Beats Common Configs Here ===
You may have noticed the drop_event.when.and entry in the Security log section, which is an example using the drop events processor. You may have also noticed the event_id configuration in the Microsoft-Windows-PowerShell/Operational, which is an example to whitelist event IDs. For reference, this example configuration can be found in the examples GitHub repo under Security Analytics/SIEM-at-Home.
Next, we will add the settings from our Beats common configuration settings to our winlogbeat.yml configuration file. We will use the settings from the General, Top Level Processor, Elastic Cloud, Xpack Monitoring, and Queue sections and add them to the end of our configuration file. Our completed winlogbeat.yml file now looks like this:
#=== Winlogbeat specific options ===
winlogbeat.event_logs:
  - name: Application
    ignore_older: 72h
  - name: System
  - name: Security
    ignore_older: 24h
    processors:
      - drop_event.when.and: # drop local service login events
        - equals.event.code: '4672'
        - equals.winlog.event_data.SubjectUserName: 'LOCAL SERVICE'
      - script:
          lang: javascript
          id: security
          file: ${path.home}/module/security/config/winlogbeat-security.js
  - name: Windows PowerShell
    ignore_older: 72h
  - name: Microsoft-Windows-PowerShell/Operational
    ignore_older: 72h
    event_id: 4103, 4104
  - name: Microsoft-Windows-Sysmon/Operational
    ignore_older: 24h
    processors:
      - script:
          lang: javascript
          id: sysmon
          file: ${path.home}/module/sysmon/config/winlogbeat-sysmon.js
#=== Winlogbeat logging ===
# Configure logging for Winlogbeat if you plan on using the GeoIP ingest processor
# Initially use `info` for the logging.level, set logging.level to `debug` if you see
# an `Failed to publish events: temporary bulk send failure` error message in the logs
#logging.level: info
#logging.to_files: true
#logging.files:
#  path: C:\Program Files\Elastic\logs\
#  name: winlogbeat
#  keepfiles: 7
#  permissions: 0644
# Configuration applicable for all beats on a specific device
#=== General ===
name: myWinPC
tags: ["myTag", "myWinPC"]
fields:
  env: myEnv
  version: 11-26-2019
#=== Top Level Processor ===
processors:
  - add_host_metadata:
      # netinfo.enabled should be set to `false` until GitHub issue
      # https://github.com/elastic/elasticsearch/issues/46193 is resolved
      netinfo.enabled: false
      Geo: # These Geo configurations are optional
        location: 40.7128, -74.0060
        continent_name: North America
        country_iso_code: US
        region_name: New York
        region_iso_code: US-NY
        city_name: New York City
        name: myHomeLocation
  - add_locale: ~
  - add_cloud_metadata: ~
  - add_fields:
      #when.network.source.ip: 10.101.101.0/24
      when.network.source.ip: private
      fields:
        source.geo.location:
          lat: 40.7128
          lon: -74.0060
        source.geo.continent_name: North America
        source.geo.country_iso_code: US
        source.geo.region_name: New York
        source.geo.region_iso_code: US-NY
        source.geo.city_name: New York City
        source.geo.name: myHomeLocation
      target: ''
  - add_fields:
      #when.network.destination.ip: 10.101.101.0/24
      when.network.destination.ip: private
      fields:
        destination.geo.location:
          lat: 40.7128
          lon: -74.0060
        destination.geo.continent_name: North America
        destination.geo.country_iso_code: US
        destination.geo.region_name: New York
        destination.geo.region_iso_code: US-NY
        destination.geo.city_name: New York City
        destination.geo.name: myHomeLocation
      target: ''
#=== Elastic Cloud ===
# These settings simplify using beats with the Elastic Cloud (https://cloud.elastic.co/).
cloud.id: "My_Elastic_Cloud_Deployment:abcdefghijklmnopqrstuvwxyz1234567890ABCDEFGHIJKLMNOPQRSTUVWXYZ"
cloud.auth: "home_beats:0987654321abcDEF"
# The geoip-info pipeline is used to enrich GeoIP information in Elasticsearch
# You must configure the pipeline in Elasticsearch before enabling the pipeline in Beats.
# The `output.elasticsearch.pipeline: geoip-info` setting should be commented out until
# until GitHub issue https://github.com/elastic/elasticsearch/issues/46193 is resolved
#output.elasticsearch.pipeline: geoip-info
# The `max_retries` setting is the number of times to retry publishing an event after
# a publishing failure. After the specified number of retries, the events are typically dropped.
output.elasticsearch.max_retries: 5
# When deploying beats to multiple systems or locations, uncomment the following
# setup.template.* and setup.ilm.* configurations after running the beats setup command
# Otherwise, uncomment the following configurations for beats that will only publish data
#setup.template.enabled: false
#setup.ilm.check_exists: false
#setup.ilm.overwrite: false
#=== Xpack Monitoring ===
# When monitoring is enabled, the beat will ship monitoring data to the cluster
monitoring.enabled: true
#=== Queue ===
# See the 'Configure the internal queue' documentation for each Beat before
# configuring the queue. Note that only one queue type can be configured.
# You need to uncomment the specific queue type you decide to use.
# The `queue.mem` settings will cache events to memory in case access to the
# Elasticsearch cluster, via the internet, is unavailable (internet outage)
#queue.mem:
#  events: 4096
#  flush.min_events: 512
#  flush.timeout: 1s
# The `queue.spool` settings will cache events to disk in case the system is offline
# NOTE: The file spool queue is a beta functionality in 7.4
queue.spool:
  file:
    size: 512MiB
    page_size: 16KiB
    prealloc: ~
  write:
    buffer_size: 10MiB
    flush.timeout: 1s
    flush.min.events: 1024
Once the file is updated, don’t forget to save the changes made to winlogbeat.yml before proceeding.
Starting Winlogbeat
Now that the configuration file is updated it is time to set up Winlogbeat with our Elasticsearch Service deployment. Running the setup command only needs to be performed once for each Beat. In our Administrative PowerShell session, we’ll issue the .\winlogbeat.exe setup command then confirm we receive “Index setup finished” and “Loaded dashboards” messages (shown below).
PS C:\Program Files\Elastic\winlogbeat-7.4.0> .\winlogbeat.exe setup
Index setup finished.
Loading dashboards (Kibana must be running and reachable)
Loaded dashboards
PS C:\Program Files\Elastic\winlogbeat-7.4.0>
Now that we’ve set up the index and loaded the dashboards, it is time to start the Winlogbeat service! In our Administrative PowerShell session, we will issue the Start-Service winlogbeat command (see below), then we will optionally configure Packetbeat and Auditbeat.
PS C:\Program Files\Elastic\winlogbeat-7.4.0> start-service winlogbeat
PS C:\Program Files\Elastic\winlogbeat-7.4.0> get-service winlogbeat
Status   Name           DisplayName
------   ----           -----------
Running  winlogbeat     winlogbeat
PS C:\Program Files\Elastic\winlogbeat-7.4.0> cd ..
PS C:\Program Files\Elastic>
We will navigate back to the C:\Program Files\Elastic folder in our Administrative PowerShell session, so we can optionally install and configure Packetbeat and Auditbeat on this Windows computer. If you are using the GeoIP ingest pipeline and do not see data coming from Winlogbeat for this device in your Elastic cluster then you should uncomment the logging section and restart Winlogbeat.
Packetbeat on Windows
While it is ideal to deploy Packetbeat to either existing application servers or dedicated servers (to get traffic from mirror ports or tap devices), some data can be collected on workstations. Since we’ve downloaded Packetbeat, it’s a good idea to read through the Packetbeat installation guide before we get started. For Packetbeat to run on our Windows device, there is a requirement to download and install a packet sniffing library, such as Npcap, which implements the libpcap interfaces. Note that a packet sniffing library is not bundled with Packetbeat, so it must be installed independently.
Npcap
Once we have downloaded Npcap to our thirdparty folder (for the blog the path is C:\Program Files\Elastic\thirdparty) we can proceed with the installation. In our Administrative PowerShell session we will install Npcap using the .\npcap-<versionnumber> /winpcap_mode=yes command (I’m installing Npcap version 0.9984, as shown below):
PS C:\Program Files\Elastic> cd .\thirdparty\
PS C:\Program Files\Elastic\thirdparty> .\npcap-0.9984.exe /winpcap_mode=yes
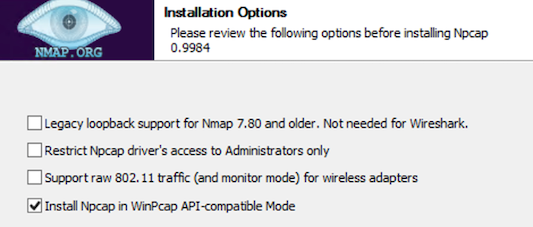
After issuing the .\npcap-<versionnumber> /winpcap_mode=yes command you will need to navigate through the interface to complete the installation. Packetbeat only requires the WinPcap API-compatible mode so we will install Npcap in WinPcap API-compatible mode as stated in the installation guide.
After the installation finishes, we can close the Npcap setup window. In our Administrative PowerShell session we will validate Npcap is running then navigate back to the C:\Program Files\Elastic folder:
PS C:\Program Files\Elastic\thirdparty> get-service npcap
Status     Name    DisplayName
------     ----    -----------
Running    npcap   Npcap Packet Driver (NPCAP)
PS C:\Program Files\Elastic\thirdparty> cd ..
PS C:\Program Files\Elastic>
Installing Packetbeat
After we have installed Npcap we need to install Packetbeat. We’ve extracted the files to C:\Program Files\Elastic\packetbeat-7.4.0\ (I’ve kept the version number in the folder name for my own version control) and, using our Administrative PowerShell session, will install the service by issuing the .\install-service-packetbeat.ps1 command (shown below). After installing Packetbeat, do not start the service until we finish initial configuration.
PS C:\Program Files\Elastic> cd .\packetbeat-7.4.0
PS C:\Program Files\Elastic\packetbeat-7.4.0> .\install-service-packetbeat.ps1
Security warning
Run only scripts that you trust. While scripts from the internet can be useful,
this script can potentially harm your computer. If you trust this script, use
the Unblock-File cmdlet to allow the script to run without this warning message.
Do you want to run C:\Program Files\Packetbeat\install-service-packetbeat.ps1?
[D] Do not run  [R] Run once [S] Suspend  [?] Help (default is “D”): R
Status   Name           DisplayName
------   ----           -----------
Stopped  packetbeat     packetbeat
PS C:\Program Files\Elastic\packetbeat-7.4.0>
Note: If you run into any errors, see the ‘Error: cannot be loaded because running scripts is disabled on this system’ notes in the Winlogbeat section of this blog.
Configuring Packetbeat
After we have installed Npcap and Packetbeat on this Windows computer, we need to update our packetbeat.yml configuration file. Since we have already determined our common Beats configurations, we only need to finalize our Packetbeat-specific options, which will be stored in the first section of the file. Make sure to read through the packetbeat.reference.yml page or the packetbeat.reference.yml file in the C:\Program Files\Elastic\packetbeat-7.4.0\ folder. For clarity, the Beats common configuration sections will be stored below the Packetbeat-specific options.
When running Packetbeat on Windows we are not able to capture traffic from all interfaces, instead we have to set a specific interface to capture from. In order to determine the interface we need to capture, we will run the .\packetbeat.exe devices command as mentioned in the device section of the set traffic capturing options guide.
PS C:\Program Files\Elastic\packetbeat-7.4.0> .\packetbeat.exe devices
0: \Device\NPF_NdisWanBh (NdisWan Adapter) (Not assigned ip address)
1: \Device\NPF_NdisWanIp (NdisWan Adapter) (Not assigned ip address)
2: \Device\NPF_NdisWanIpv6 (NdisWan Adapter) (Not assigned ip address)
3: \Device\NPF_{98706BA1-ADA1-4C5C-9DBD-1BEF5A363D47} (Intel(R) 82574L Gigabit Network Connection) (10.101.10.40)
4: \Device\NPF_Loopback (Adapter for loopback traffic capture) (Not assigned ip address)
PS C:\Program Files\Elastic\packetbeat-7.4.0>
Based on the output from the .\packetbeat.exe devices command, we will need to configure Packetbeat to capture data from device 3, meaning we will set packetbeat.interfaces.device: 3 in our packetbeat.yml configuration file.
If you plan on using the GeoIP ingest processor, you should configure logging for Packetbeat. Since we will store our log files in the C:\Program Files\Elastic\logs\ folder, our logging configuration will look like this:
#=== Packetbeat logging ===
# Initially use `info` for the logging.level, set logging.level to `debug` if you see
# an `Failed to publish events: temporary bulk send failure` error message in the logs
logging.level: info
logging.to_files: true
logging.files:
  path: C:\Program Files\Elastic\logs\
  name: packetbeat
  keepfiles: 7
  permissions: 0644
We will add the Packetbeat logging section to our configuration but leave it commented out for now. With that said, here is what I have set in packetbeat.yml:
#=== Packetbeat specific options ===
#=== Network device ===
# Select the network interface to sniff the data. On Linux, you can use the
# "any" keyword to sniff on all connected interfaces.
packetbeat.interfaces.device: 3
#=== Flows ===
packetbeat.flows:
  timeout: 30s
  period: 10s
#=== Transaction protocols ===
# For more information on the transaction protocols, see
# /guide/en/beats/packetbeat/7.4/configuration-protocols.html
packetbeat.protocols:
- type: icmp
  # Enable ICMPv4 and ICMPv6 monitoring. Default: false
  enabled: true
- type: dhcpv4
  # Configure the DHCP for IPv4 ports.
  ports: [67, 68]
  send_request: true
  send_response: true
- type: dns
  # Configure the ports where to listen for DNS traffic. You can disable
  # the DNS protocol by commenting out the list of ports.
  ports: [53]
  include_authorities: true
  include_additionals: true
- type: http
  # Configure the ports where to listen for HTTP traffic. You can disable
  # the HTTP protocol by commenting out the list of ports.
  ports: [80, 8080, 8000, 5000, 8002]
- type: tls
  # Configure the ports where to listen for TLS traffic. You can disable
  # the TLS protocol by commenting out the list of ports.
  ports:
    - 443   # HTTPS
    - 993   # IMAPS
    - 995   # POP3S
    - 5223  # XMPP over SSL
    - 8443
    - 8883  # Secure MQTT
    - 9243  # Elasticsearch
#=== Packetbeat logging ===
# Configure logging for Packetbeat if you plan on using the GeoIP ingest processor
# Initially use `info` for the logging.level, set logging.level to `debug` if you see
# an `Failed to publish events: temporary bulk send failure` error message in the logs
#logging.level: info
#logging.to_files: true
#logging.files:
#  path: C:\Program Files\Elastic\logs\
#  name: packetbeat
#  keepfiles: 7
#  permissions: 0644
#=== Beats Common Configs Here ===
You may have noticed the include_authorities: true and include_additionals: true entries in the DNS transaction protocol section, which is an example using DNS-specific configuration options. You may have also noticed the send_request: true and send_response: true entries in the DHCP transaction protocol section, which is an example using common protocol options. For reference, this example configuration can be found in the examples GitHub repo under Security Analytics/SIEM-at-Home.
Next, we will add the settings from our Beats common configuration settings to our packetbeat.yml configuration file. We will use the settings from the General, Top Level Processor, Elastic Cloud, Xpack Monitoring, and Queue sections and add them to the end of our configuration file. Our completed packetbeat.yml file now looks like this:
#=== Packetbeat specific options ===
#=== Network device ===
# Select the network interface to sniff the data. On Linux, you can use the
# "any" keyword to sniff on all connected interfaces.
packetbeat.interfaces.device: 3
#=== Flows ===
packetbeat.flows:
  timeout: 30s
  period: 10s
#=== Transaction protocols ===
# For more information on the transaction protocols, see
# /guide/en/beats/packetbeat/7.4/configuration-protocols.html
packetbeat.protocols:
- type: icmp
  # Enable ICMPv4 and ICMPv6 monitoring. Default: false
  enabled: true
- type: dhcpv4
  # Configure the DHCP for IPv4 ports.
  ports: [67, 68]
  send_request: true
  send_response: true
- type: dns
  # Configure the ports where to listen for DNS traffic. You can disable
  # the DNS protocol by commenting out the list of ports.
  ports: [53]
  include_authorities: true
  include_additionals: true
- type: http
  # Configure the ports where to listen for HTTP traffic. You can disable
  # the HTTP protocol by commenting out the list of ports.
  ports: [80, 8080, 8000, 5000, 8002]
- type: tls
  # Configure the ports where to listen for TLS traffic. You can disable
  # the TLS protocol by commenting out the list of ports.
  ports:
    - 443   # HTTPS
    - 993   # IMAPS
    - 995   # POP3S
    - 5223  # XMPP over SSL
    - 8443
    - 8883  # Secure MQTT
    - 9243  # Elasticsearch
#=== Packetbeat logging ===
# Configure logging for Packetbeat if you plan on using the GeoIP ingest processor
# Initially use `info` for the logging.level, set logging.level to `debug` if you see
# an `Failed to publish events: temporary bulk send failure` error message in the logs
#logging.level: info
#logging.to_files: true
#logging.files:
#  path: C:\Program Files\Elastic\logs\
#  name: packetbeat
#  keepfiles: 7
#  permissions: 0644
# Configuration applicable for all beats on a specific device
#=== General ===
name: myWinPC
tags: ["myTag", "myWinPC"]
fields:
  env: myEnv
  version: 11-26-2019
#=== Top Level Processor ===
processors:
  - add_host_metadata:
      # netinfo.enabled should be set to `false` until GitHub issue
      # https://github.com/elastic/elasticsearch/issues/46193 is resolved
      netinfo.enabled: false
      Geo: # These Geo configurations are optional
        location: 40.7128, -74.0060
        continent_name: North America
        country_iso_code: US
        region_name: New York
        region_iso_code: US-NY
        city_name: New York City
        name: myHomeLocation
  - add_locale: ~
  - add_cloud_metadata: ~
  - add_fields:
      #when.network.source.ip: 10.101.101.0/24
      when.network.source.ip: private
      fields:
        source.geo.location:
          lat: 40.7128
          lon: -74.0060
        source.geo.continent_name: North America
        source.geo.country_iso_code: US
        source.geo.region_name: New York
        source.geo.region_iso_code: US-NY
        source.geo.city_name: New York City
        source.geo.name: myHomeLocation
      target: ''
  - add_fields:
      #when.network.destination.ip: 10.101.101.0/24
      when.network.destination.ip: private
      fields:
        destination.geo.location:
          lat: 40.7128
          lon: -74.0060
        destination.geo.continent_name: North America
        destination.geo.country_iso_code: US
        destination.geo.region_name: New York
        destination.geo.region_iso_code: US-NY
        destination.geo.city_name: New York City
        destination.geo.name: myHomeLocation
      target: ''
#=== Elastic Cloud ===
# These settings simplify using beats with the Elastic Cloud (https://cloud.elastic.co/).
cloud.id: "My_Elastic_Cloud_Deployment:abcdefghijklmnopqrstuvwxyz1234567890ABCDEFGHIJKLMNOPQRSTUVWXYZ"
cloud.auth: "home_beats:0987654321abcDEF"
# The geoip-info pipeline is used to enrich GeoIP information in Elasticsearch
# You must configure the pipeline in Elasticsearch before enabling the pipeline in Beats.
# The `output.elasticsearch.pipeline: geoip-info` setting should be commented out until
# until GitHub issue https://github.com/elastic/elasticsearch/issues/46193 is resolved
#output.elasticsearch.pipeline: geoip-info
# The `max_retries` setting is the number of times to retry publishing an event after
# a publishing failure. After the specified number of retries, the events are typically dropped.
output.elasticsearch.max_retries: 5
# When deploying beats to multiple systems or locations, uncomment the following
# setup.template.* and setup.ilm.* configurations after running the beats setup command
# Otherwise, uncomment the following configurations for beats that will only publish data
#setup.template.enabled: false
#setup.ilm.check_exists: false
#setup.ilm.overwrite: false
#=== Xpack Monitoring ===
# When monitoring is enabled, the beat will ship monitoring data to the cluster
monitoring.enabled: true
#=== Queue ===
# See the 'Configure the internal queue' documentation for each Beat before
# configuring the queue. Note that only one queue type can be configured.
# You need to uncomment the specific queue type you decide to use.
# The `queue.mem` settings will cache events to memory in case access to the
# Elasticsearch cluster, via the internet, is unavailable (internet outage)
#queue.mem:
#  events: 4096
#  flush.min_events: 512
#  flush.timeout: 1s
# The `queue.spool` settings will cache events to disk in case the system is offline
# NOTE: The file spool queue is a beta functionality in 7.4
queue.spool:
  file:
    size: 512MiB
    page_size: 16KiB
    prealloc: ~
  write:
    buffer_size: 10MiB
    flush.timeout: 1s
    flush.min.events: 1024
Once the file is updated, don’t forget to save the changes made to packetbeat.yml before proceeding.
Starting Packetbeat
Now that the configuration is updated it is time to set up Packetbeat with our Elasticsearch Service deployment. Running the setup command only needs to be performed once for each Beat. In our Administrative PowerShell session, we’ll issue the .\packetbeat.exe setup command then confirm we receive “Index setup finished” and “Loaded dashboards” messages (shown below).
PS C:\Program Files\Elastic\packetbeat-7.4.0> .\packetbeat.exe setup
Index setup finished.
Loading dashboards (Kibana must be running and reachable)
Loaded dashboards
PS C:\Program Files\Elastic\packetbeat-7.4.0>
Now that we’ve set up the index and loaded the dashboards, it is time to start the Packetbeat service! In our Administrative PowerShell session, we will issue the Start-Service packetbeat command (see below), then we will optionally configure Auditbeat.
PS C:\Program Files\Elastic\packetbeat-7.4.0> Start-Service packetbeat
PS C:\Program Files\Elastic\packetbeat-7.4.0> Get-Service packetbeat
Status   Name           DisplayName
------   ----           -----------
Running  packetbeat     packetbeat
PS C:\Program Files\Elastic\packetbeat-7.4.0> cd ..
PS C:\Program Files\Elastic>
We will navigate back to the C:\Program Files\Elastic folder in our Administrative PowerShell session, so we can optionally install and configure Auditbeat on this Windows computer. If you are using the GeoIP ingest pipeline and do not see data coming from Packetbeat for this device in your Elastic cluster then you should uncomment the logging section and restart Packetbeat.
Auditbeat on Windows
While Auditbeat has more capabilities when deployed on Linux, we will use the file integrity and system modules to collect additional data on our Windows computer.
Installing Auditbeat
Since we’ve downloaded Auditbeat, it’s a good idea to read through the Auditbeat installation guide to get started. We’ve extracted the files to C:\Program Files\Elastic\auditbeat-7.4.0\ (I’ve kept the version number in the folder name for my own version control) and, using our Administrative PowerShell session, will install the service by issuing the .\install-service-auditbeat.ps1 command (shown below). After installing Auditbeat, do not start the service until we finish initial configuration.
PS C:\Program Files\Elastic> cd .\auditbeat-7.4.0
PS C:\Program Files\Elastic\auditbeat-7.4.0> .\install-service-auditbeat.ps1
Security warning
Run only scripts that you trust. While scripts from the internet can be useful,
this script can potentially harm your computer. If you trust this script, use
the Unblock-File cmdlet to allow the script to run without this warning message.
Do you want to run C:\Program Files\Auditbeat\install-service-auditbeat.ps1?
[D] Do not run  [R] Run once [S] Suspend  [?] Help (default is “D”): R
Status   Name           DisplayName
------   ----           -----------
Stopped  auditbeat      auditbeat
PS C:\Program Files\Elastic\auditbeat-7.4.0>
Note: If you run into any errors, see the ‘Error: cannot be loaded because running scripts is disabled on this system’ notes in the Winlogbeat section of this blog.
Configuring Auditbeat
After we have installed Auditbeat on this Windows computer, we need to update our auditbeat.yml configuration file. Since we have already determined our common Beats configurations, we only need to finalize our Auditbeat-specific options, which will be stored in the first section of the file. Make sure to read through the auditbeat.reference.yml page or the auditbeat.reference.yml file in the C:\Program Files\Elastic\auditbeat-7.4.0\ folder. For clarity, the Beats common configuration sections will be stored below the Auditbeat specific options.
If you plan on using the GeoIP ingest processor, you should configure logging for Auditbeat. Since we will store our log files in the C:\Program Files\Elastic\logs\ folder, our logging configuration will look like this:
#=== Auditbeat logging ===
# Initially use `info` for the logging.level, set logging.level to `debug` if you see
# an `Failed to publish events: temporary bulk send failure` error message in the logs
logging.level: info
logging.to_files: true
logging.files:
  path: C:\Program Files\Elastic\logs\
  name: auditbeat
  keepfiles: 7
  permissions: 0644
We will add the Auditbeat logging section to our configuration but leave it commented out for now. With that said, here is what I have set in auditbeat.yml:
#=== Auditbeat specific options ===
#===  Modules configuration ===
auditbeat.modules:
- module: file_integrity
  paths:
  - C:/windows
  - C:/windows/system32
  - C:/windows/SysWOW64
  - C:/Program Files
  - C:/Program Files (x86)
  - C:/ProgramData
- module: system
  datasets:
    - host
  state.period: 12h
  period: 1h
- module: system
  datasets:
    - process
  processors:
    - add_process_metadata:
        match_pids: [process.ppid]
        target: system.process.parent
  period: 3m
#=== Auditbeat logging ===
# Configure logging for Auditbeat if you plan on using the GeoIP ingest processor
# Initially use `info` for the logging.level, set logging.level to `debug` if you see
# an `Failed to publish events: temporary bulk send failure` error message in the logs
#logging.level: info
#logging.to_files: true
#logging.files:
#  path: C:\Program Files\Elastic\logs\
#  name: auditbeat
#  keepfiles: 7
#  permissions: 0644
#=== Beats Common Configs Here ===
You may have noticed I have added C:/windows/SysWOW64 and C:/ProgramData as example paths in the file integrity module section. You may have also noticed I specified state.period and period in the system module section. The period parameter controls the poll frequency while state.period controls the frequency of state updates. I also included the add process metadata processor to enrich events collected by the system module. For reference, this example configuration can be found in the examples GitHub repo under Security Analytics/SIEM-at-Home.
Next, we will add the settings from our Beats common configuration settings to our auditbeat.yml configuration file. We will use the settings from the General, Top Level Processor, Elastic Cloud, Xpack Monitoring, and Queue sections and add them to the end of our configuration file. Our completed auditbeat.yml file now looks like this:
#=== Auditbeat specific options ===
#===  Modules configuration ===
auditbeat.modules:
- module: file_integrity
  paths:
  - C:/windows
  - C:/windows/system32
  - C:/windows/SysWOW64
  - C:/Program Files
  - C:/Program Files (x86)
  - C:/ProgramData
- module: system
  datasets:
    - host
  state.period: 12h
  period: 1h
- module: system
  datasets:
    - process
  processors:
    - add_process_metadata:
        match_pids: [process.ppid]
        target: system.process.parent
  period: 3m
#=== Auditbeat logging ===
# Configure logging for Auditbeat if you plan on using the GeoIP ingest processor
# Initially use `info` for the logging.level, set logging.level to `debug` if you see
# an `Failed to publish events: temporary bulk send failure` error message in the logs
#logging.level: info
#logging.to_files: true
#logging.files:
#  path: C:\Program Files\Elastic\logs\
#  name: auditbeat
#  keepfiles: 7
#  permissions: 0644
# Configuration applicable for all beats on a specific device
#=== General ===
name: myWinPC
tags: ["myTag", "myWinPC"]
fields:
  env: myEnv
  version: 11-26-2019
#=== Top Level Processor ===
processors:
  - add_host_metadata:
      # netinfo.enabled should be set to `false` until GitHub issue
      # https://github.com/elastic/elasticsearch/issues/46193 is resolved
      netinfo.enabled: false
      Geo: # These Geo configurations are optional
        location: 40.7128, -74.0060
        continent_name: North America
        country_iso_code: US
        region_name: New York
        region_iso_code: US-NY
        city_name: New York City
        name: myHomeLocation
  - add_locale: ~
  - add_cloud_metadata: ~
  - add_fields:
      #when.network.source.ip: 10.101.101.0/24
      when.network.source.ip: private
      fields:
        source.geo.location:
          lat: 40.7128
          lon: -74.0060
        source.geo.continent_name: North America
        source.geo.country_iso_code: US
        source.geo.region_name: New York
        source.geo.region_iso_code: US-NY
        source.geo.city_name: New York City
        source.geo.name: myHomeLocation
      target: ''
  - add_fields:
      #when.network.destination.ip: 10.101.101.0/24
      when.network.destination.ip: private
      fields:
        destination.geo.location:
          lat: 40.7128
          lon: -74.0060
        destination.geo.continent_name: North America
        destination.geo.country_iso_code: US
        destination.geo.region_name: New York
        destination.geo.region_iso_code: US-NY
        destination.geo.city_name: New York City
        destination.geo.name: myHomeLocation
      target: ''
#=== Elastic Cloud ===
# These settings simplify using beats with the Elastic Cloud (https://cloud.elastic.co/).
cloud.id: "My_Elastic_Cloud_Deployment:abcdefghijklmnopqrstuvwxyz1234567890ABCDEFGHIJKLMNOPQRSTUVWXYZ"
cloud.auth: "home_beats:0987654321abcDEF"
# The geoip-info pipeline is used to enrich GeoIP information in Elasticsearch
# You must configure the pipeline in Elasticsearch before enabling the pipeline in Beats.
# The `output.elasticsearch.pipeline: geoip-info` setting should be commented out until
# until GitHub issue https://github.com/elastic/elasticsearch/issues/46193 is resolved
#output.elasticsearch.pipeline: geoip-info
# The `max_retries` setting is the number of times to retry publishing an event after
# a publishing failure. After the specified number of retries, the events are typically dropped.
output.elasticsearch.max_retries: 5
# When deploying beats to multiple systems or locations, uncomment the following
# setup.template.* and setup.ilm.* configurations after running the beats setup command
# Otherwise, uncomment the following configurations for beats that will only publish data
#setup.template.enabled: false
#setup.ilm.check_exists: false
#setup.ilm.overwrite: false
#=== Xpack Monitoring ===
# When monitoring is enabled, the beat will ship monitoring data to the cluster
monitoring.enabled: true
#=== Queue ===
# See the 'Configure the internal queue' documentation for each Beat before
# configuring the queue. Note that only one queue type can be configured.
# You need to uncomment the specific queue type you decide to use.
# The `queue.mem` settings will cache events to memory in case access to the
# Elasticsearch cluster, via the internet, is unavailable (internet outage)
#queue.mem:
#  events: 4096
#  flush.min_events: 512
#  flush.timeout: 1s
# The `queue.spool` settings will cache events to disk in case the system is offline
# NOTE: The file spool queue is a beta functionality in 7.4
queue.spool:
  file:
    size: 512MiB
    page_size: 16KiB
    prealloc: ~
  write:
    buffer_size: 10MiB
    flush.timeout: 1s
    flush.min.events: 1024
Once the file is updated, don’t forget to save the changes made to auditbeat.yml before proceeding.
Starting Auditbeat
Now that the configuration is updated it is time to set up Auditbeat with our Elasticsearch Service deployment. Running the setup command only needs to be performed once for each beat. In our Administrative PowerShell session, we’ll issue the .\auditbeat.exe setup command then confirm we receive “Index setup finished” and “Loaded dashboards” messages (shown below).
PS C:\Program Files\Elastic\auditbeat-7.4.0> .\auditbeat.exe setup
Index setup finished.
Loading dashboards (Kibana must be running and reachable)
Loaded dashboards
PS C:\Program Files\Elastic\auditbeat-7.4.0>
Now that we’ve set up the index and loaded the dashboards, it is time to start the Auditbeat service! In our Administrative PowerShell session, we will issue the Start-Service auditbeat command (see below).
PS C:\Program Files\Elastic\auditbeat-7.4.0> start-service auditbeat
PS C:\Program Files\Elastic\auditbeat-7.4.0> get-service auditbeat
Status   Name           DisplayName
------   ----           -----------
Running  auditbeat      auditbeat
PS C:\Program Files\Elastic\auditbeat-7.4.0> cd ..
PS C:\Program Files\Elastic>
If you are using the GeoIP ingest pipeline and do not see data coming from Auditbeat for this device in your Elastic cluster then you should uncomment the logging section and restart Auditbeat.
Wrapping up with Beats on Windows
Hurray! Now we have finished installing and configuring Winlogbeat, Packetbeat, and Auditbeat on this Windows device. We can issue the get-service *beat command in our Administrative PowerShell session to verify the beat services are running.
PS C:\Program Files\Elastic> Get-Service *beat
Status     Name          DisplayName
------     ----          -----------
Running    auditbeat     auditbeat
Running    packetbeat    packetbeat
Running    winlogbeat    winlogbeat
PS C:\Program Files\Elastic>
Next steps: Data collection with Beats
In the next blog, we will install and configure Auditbeat, Filebeat, and Packetbeat on a CentOS server. While the next few blogs will focus on data collection from different systems, we will also cover some other use cases, including visualizing GeoIP data in Elastic Maps.
Follow along with this Elastic SIEM for home and small business blog series as we develop a powerful, yet simple, security solution at home (or for your small business). Remember that once we install and configure Beats on our systems, we can go to the SIEM app to see what data is available.
Here are all the posts in the series:
- Part 1: Getting started
- Part 2: Securing cluster access
- Part 3: GeoIP data and Beats config
- Part 4: Beats on Windows
- Part 5: Beats on CentOS
- Part 6: Beats on macOS
- Part 7: SIEM overview
A few last things...
If you run into any issues, the first place we’d recommend turning is to our documentation. It can help with many common issues. If you still have outstanding questions, check out our Elastic forums for additional help. Or, if you want to talk to the Elastic Support team directly, you have direct access to a team of experts if you’ve deployed on Elasticsearch Service. If you are self-hosting, you can start an Elastic subscription today and have direct access to a team of experts. Be safe out there!