Elastic Stack 7.6.0 released
Editor’s Note — August 19, 2020: The Elastic SIEM solution mentioned in this post is now referred to as Elastic Security. The broader Elastic Security solution delivers SIEM, endpoint security, threat hunting, cloud monitoring, and more. If you're looking for more specific information on Elastic Security for SIEM use cases, visit our SIEM solution page.
We are excited to announce the general availability of version 7.6 of the Elastic Stack. This release streamlines automated threat detection with the launch of a new SIEM detection engine and a curated set of detection rules aligned to the MITRE ATT&CK™ knowledge base, brings performance improvements to Elasticsearch, makes supervised machine learning more turnkey with inference-on-ingest features, and deepens cloud observability and security with the launch of new data integrations. And that’s just a small slice of all that’s new and exciting in this release.
Version 7.6 is available right now on our Elasticsearch Service on Elastic Cloud — the only hosted Elasticsearch offering to include these new features. Or you can download the Elastic Stack for a self-managed experience.
The full feature rundown is in the individual blog posts but, without further ado, here are the release highlights.
Elasticsearch gets faster — yes, even faster
It's not every day that we get to make Elasticsearch queries many times faster. This time, we found a way to dramatically improve the performance of queries that are sorted by date or other long values. To do it, we were able to apply the block-max WAND optimization to sorted queries — a clever way to stop counting new results when they're clearly not going to change the results. Yes, the same Block-Max WAND that made your top-k hits queries faster in 7.0.
In case it's not obvious, this is huge. Sorting on time is one of the most common tasks in observability and security use cases. Chasing down an error in the Elastic Logs app or investigating a threat in Discover — these are just a few of the many things that will be snappier than usual thanks to this change. And you can enjoy this speed boost by simply upgrading to 7.6.
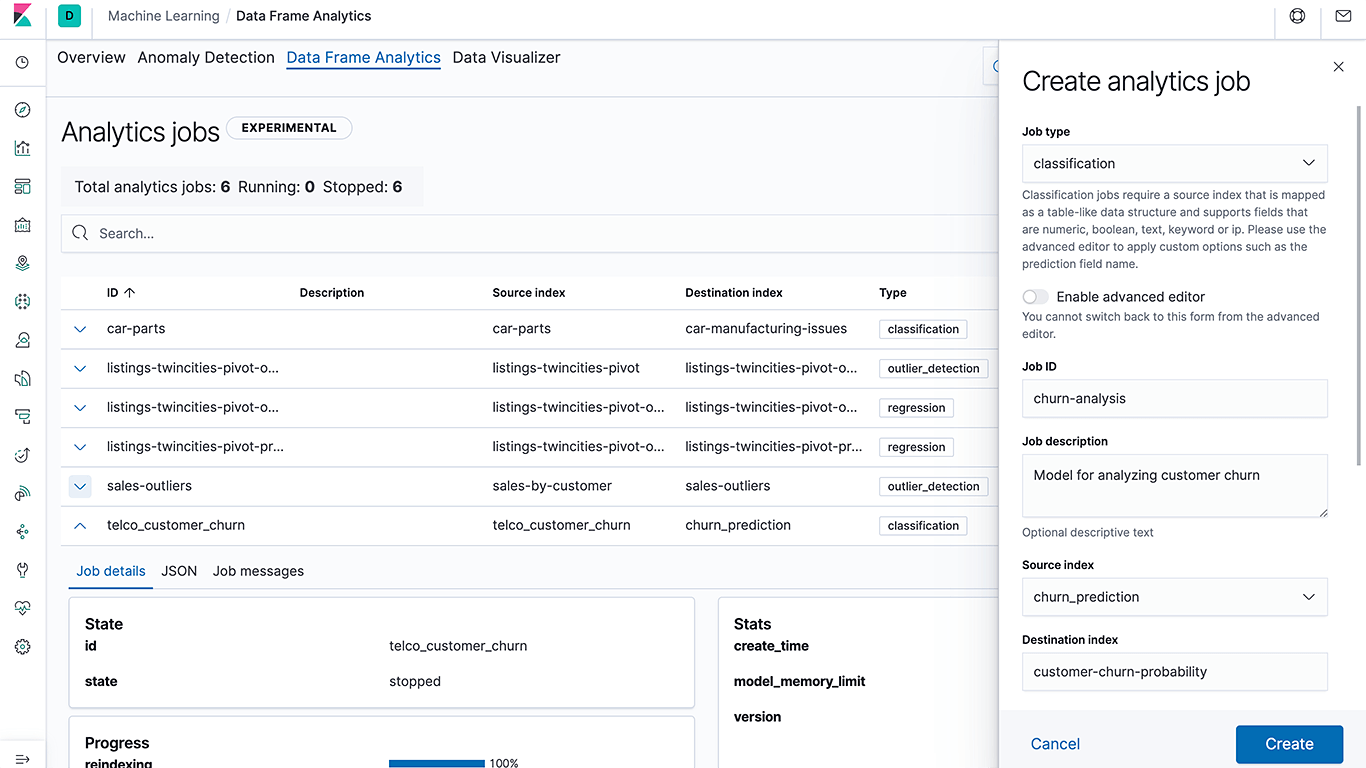
From training to inference, supervised machine learning is now a native part of the Elastic Stack
Our goal with machine learning in the Elastic Stack has always been to make it so easy that anyone in an organization can use it. With our first release in 5.4, we made detecting anomalies as easy as building a visualization in Kibana — making this accessible to a broader audience and making data science teams even more efficient. With 7.6, we are excited to bring end-to-end supervised machine learning capabilities to the stack, from training a model to using the model for inference at ingest time. The goal is to make supervised machine learning methods like classification and regression in Elasticsearch even more turnkey for practitioners across observability, security, and enterprise search use cases. For instance, a security analyst can now build a bot detection model using classification and then use the new inference ingest processor to infer and label new traffic as a bot (or not a bot) at ingest time — all natively within Elasticsearch.
Like we did with unsupervised learning and anomaly detection, our goal here is to make supervised machine learning easy and accessible to everyone. So, instead of building a generic data science toolkit or providing integration to external machine learning libraries that require users to cobble together and maintain complex workflows that move data across multiple tools, we have focused on simplifying common use cases. With this approach, we are unlocking new use cases, and keeping the operational side of things simple.
We're not just building the framework — we're users too. We're excited to be including a language identification model that can be used in the inference ingest processor to label the language on documents at ingest time. Language identification is key to so many use cases. For example, a support center can use this feature to route an incoming question to the right support agent or support location based on the language, and you can use it to make sure incoming text is indexed properly in Elasticsearch — stay tuned for a blog post on this!
“As the team responsible for the Wi-Fi subway network on public transit systems in New York City and Toronto, we are acutely aware of the need to detect system issues and connectivity anomalies. This ensures we can provide quality connections for millions of daily commuters. In 2017, we turned to anomaly detection powered by unsupervised machine learning from Elastic to detect issues that may have been otherwise missed in real time, minimizing impact on network performance,” said Jeremy Foran, Technology Specialist at BAI Communications. “As we look to the future and the onboarding of more transit systems across the world, we will continue to leverage the supervised machine learning features in Elastic Stack 7.6 to bring new networks online.”
For more details on all of these features and more, check out the Elasticsearch 7.6 blog post and Kibana 7.6 blog post.
Elastic Security
Approach zero dwell time with a new SIEM detection engine and MITRE ATT&CK™-aligned rules
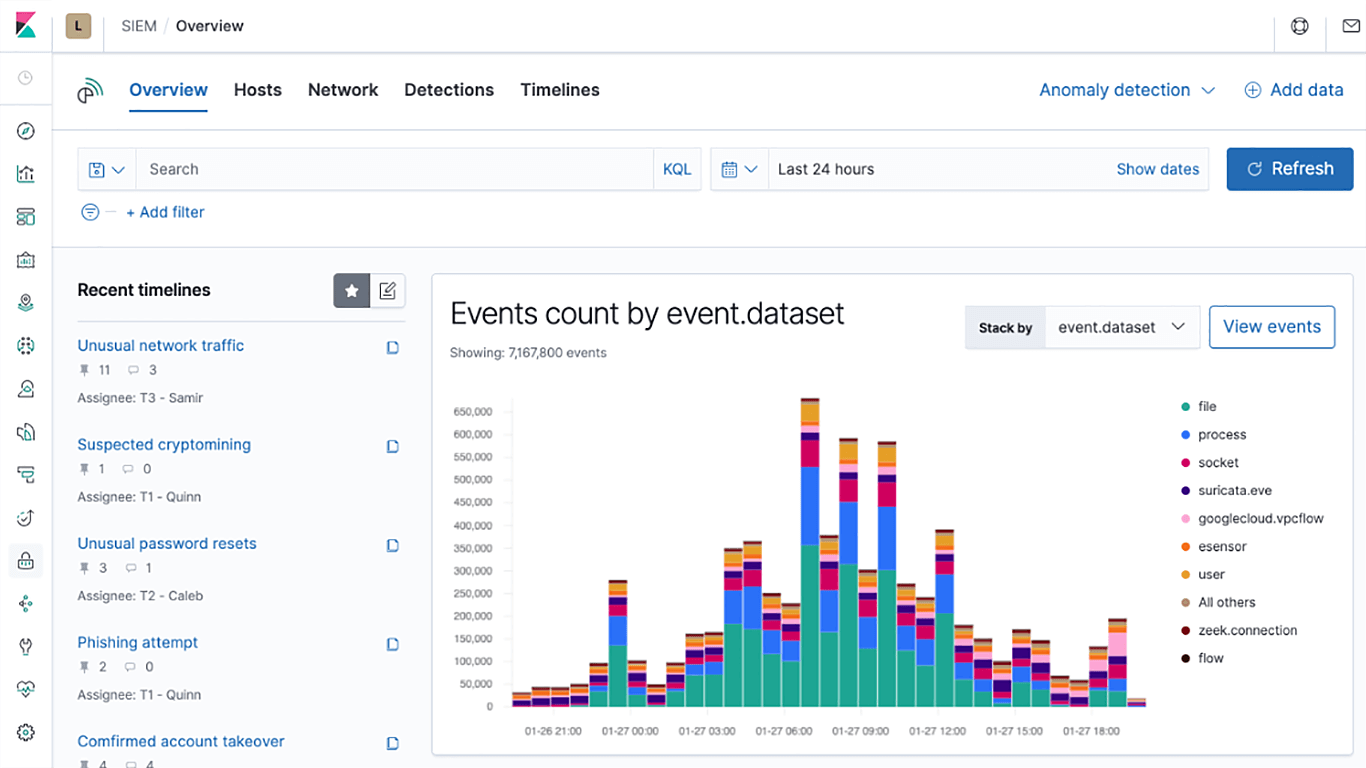
Elastic Security version 7.6 introduces a new SIEM detection engine to automate threat detection and minimize mean time to detect (MTTD). With Elasticsearch at its core, Elastic SIEM already reduces security investigation time from hours to minutes. With this new automated detection capability, we are reducing dwell time by surfacing threats that would otherwise be missed.
We are also launching nearly 100 out-of-the-box rules aligned with the ATT&CK knowledge base that can help surface threat signals that are often missed by other tools. Created and maintained by the security experts at Elastic, these rules are designed to automatically detect the tools, tactics, and procedures indicative of threat activity. Risk and severity scores of signals generated by the detection engine help analysts with efficient triage and to focus on the things that matter most.
We are releasing the detection engine and the prepackaged rules in the free Basic tier of Elastic Security — making automated analysis at scale openly accessible to security practitioners everywhere.
Unprecedented visibility into Windows endpoints, defeating adversaries’ attempts to evade defenses
Windows systems are a major attack target due to their popularity and lenient user permissions model. This release deepens visibility into Windows activity, collecting and enriching data from locations that are traditionally vulnerable to the evasion techniques of advanced threats. New out-of-the-box detections leverage this data to detect attempts to capture keyboard inputs, load malicious code into other processes, and more. Practitioners can pair events generated by these detection rules with automated responses (e.g., kill a process) to achieve layered prevention.
With this functionality, Elastic Security is bringing unprecedented levels of visibility and protection to enterprises with large Windows footprints, and at a price point accessible to every analyst.
But wait, there’s more to love in Elastic Security…
Elastic SIEM is generally available in 7.6. In addition to the detection engine, it includes a redesigned Overview page and a slew of UX improvements to help speed up threat hunting, triage, and investigation. New integrations into Amazon Web Services (AWS) and Google Cloud Platform (GCP) logs enable stronger cloud security. Get all the details in the Elastic Security 7.6 announcement post.
Elastic Enterprise Search
Unifying search for large companies without sacrificing functional autonomy
Managing the search experience across multiple sites and business units can be a difficult undertaking for large companies. Elastic App Search 7.6 introduces meta engines, document-less engines that query a set of engines. With meta engines, organizations get the ability to unify search across multiple engines from a single search bar, while still allowing admins complete control over the behavior of each individual sub-engine.
This feature will be available for App Search on Elastic Cloud and the self-managed version.
The Enterprise Search product is now called Workplace Search
We’ve up-leveled Elastic Enterprise Search as the new “umbrella” solution name that encompasses our suite of search products. And our Enterprise Search product, which was launched as a beta in May 2019, is now known as Elastic Workplace Search. Workplace Search allows teams and organizations to search and discover all the content scattered across the many tools that power the modern workforce. It’s the single search box for all your work data.
Learn about meta engines and other enhancements in the Elastic Enterprise Search update.
Elastic Observability
New AWS and GCP integrations bring deeper visibility into cloud operations
We are expanding our integrations into the cloud ecosystem and helping our users keep better tabs on their cloud operations. The AWS billing module lets enterprises track their AWS billing and usage. Combine this data with machine learning and alerting features to get notified on unusual usage patterns before spend gets out of hand. New GCP modules let you directly monitor VMs as well as any GCP service monitored by Stackdriver, and out-of-the-box Kibana dashboards mean that you can go from ingest to insight with minimal effort and in no time. These new cloud data integrations, along with several others added in recent releases, bring deeper visibility into cloud operations.
Doubling down on open standards with native Jaeger support in Elastic APM
From open source to open code, openness is at the heart of everything we do. It’s exciting to see the observability community develop and embrace open standards with initiatives like OpenTracing and OpenTelemetry, and we are committed to supporting these open standards in Elastic Observability. Jaeger, a CNCF graduated project, is a popular choice for end-to-end request tracing that is compatible with OpenTracing standards. Elastic APM agents have been OpenTracing-compatible since the early days. We are thrilled to provide an even more direct bridge between Elastic APM and Jaeger, with Jaeger intake support in version 7.6.
Elastic APM now acts as a Jaeger intake, enabling customers to ingest Jaeger-instrumented traces directly into Elasticsearch via the APM server without needing to change existing Jaeger-instrumented code. Users can now bring their Jaeger-instrumented traces into Elastic APM and explore them alongside their logs and metrics in no time, and with very little effort.
Other Elastic Observability highlights include:
- Log categorization, powered by machine learning, which groups logs with similar formats and simplifies trend analysis
- Release annotation in Elastic APM detects when new versions of services are released and automatically annotates the timeline in the APM app
Learn about all the new features in Elastic Observability in the detailed blog post.
There’s always more...
So much more. Check out the individual product blog posts for the details on everything we added in 7.6:
The Elastic Stack
Solutions